Facial Injectable Market (2026 - 2035)

Facial Injectable Market Research Report Information By Application (Facial Line Correction Treatment, Face Lift, and Lip Treatments), By End User (Hospitals and Specialty Clinics and Spa & Beauty Clinic), By Type (Botulinum Toxin, Hyaluronic Acid, Polymers, and Particles and Collagen), And By Region (North America, Europe, Asia-Pacific, And Rest Of The World) - Growth & Industry Forecast 2025 To 2035

Forecast Period
2026-2035
CAGR
9.5%
2025 Market Size
USD 15.20 Billion
2035 Market Size
USD 37.65 Billion
Medical Device ● Updated August 24, 2026 Report ID: MRFR/MED/0998-CR | Pages: 104 | Author: Nidhi Mandole, Rahul Gotadki

Facial Injectable Market Summary

The Facial Injectable Market reached USD 15.20 billion in 2025 and is projected to grow to USD 37.65 billion by 2035, expanding at a compound annual growth rate (CAGR) of 9.5% between 2026 and 2035. Market value is expected to reach USD 16.64 billion in 2026 as the first year of the forecast period. This growth is being driven primarily by tightened U.S. enforcement against unlicensed injectors and a surge in venture funding for longer-duration formulations, alongside a broader shift toward longer-lasting products and AI-assisted treatment delivery.

In the United States, the Food and Drug Administration (FDA) carried out a 2024 enforcement sweep against unlicensed "party-tox" operators, which pushed treatment volume back toward accredited clinics and licensed practitioners. At the same time, approximately USD 2.1 billion in aesthetic-device and biologics venture funding cleared in 2024 alone, with most of it directed toward longer-duration formulations. As a direct result, capital and patient volume are both consolidating around accredited providers offering newer, longer-lasting treatments.

Product substitution is also driving growth beneath the headline numbers. Short-acting onabotulinumtoxinA regimens, which required three to four clinic visits annually, are giving way to daxibotulinumtoxinA and prabotulinumtoxinA formulations that hold results for six months or more. Similarly, pre-hydrated poly-L-lactic acid suspensions are replacing hand-mixed collagen stimulators. AI-guided facial-mapping platforms, deployed across more than 4,000 clinics in the United States and South Korea by late 2025, have reduced operator variability and lifted repeat-booking rates by an estimated 14%.

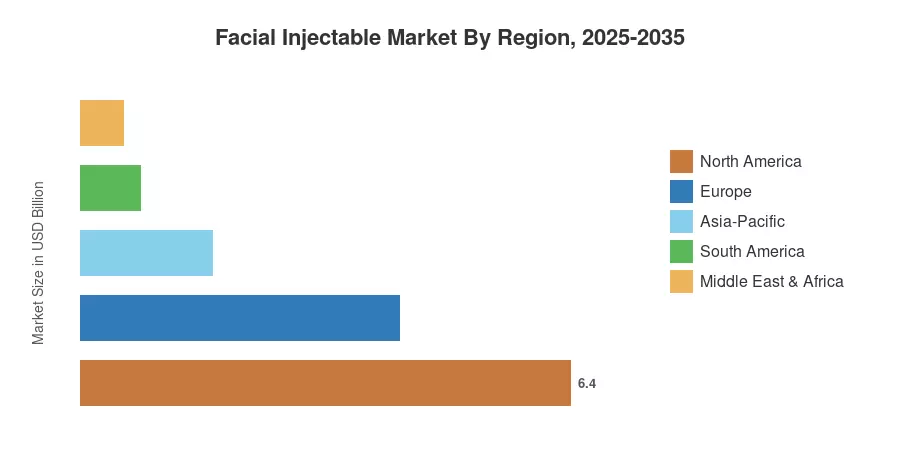
By region, North America holds the largest share of the Facial Injectable Market, at 42.1% of 2025 revenue, supported by its extensive medical-spa channel. Asia-Pacific is the fastest-growing region, with a projected CAGR of 11.3% through 2035, powered by Korean and Chinese domestic toxin manufacturing. Europe holds the second-largest share, at 27.4%, where reimbursement-adjacent therapeutic indications keep dermatology clinics busy throughout the year. The revenue gap between North America and Asia-Pacific is expected to narrow to single digits before 2033.


Key Report Takeaways

• By Product Type

  • Botulinum Toxin commanded 52.8% of Facial Injectable Market revenue in 2025, sustained by high repeat-visit frequency.
  • Poly-L-Lactic Acid is the fastest-expanding product line at a 15.6% CAGR through 2035
  • Hyaluronic Acid fillers generated USD 5.02 Billion in 2025

• By Application

  • Wrinkle reduction and anti-aging led applications with a 37.0% revenue share in 2025
  • Scar and acne-scar treatment advances at a 14.9% CAGR, the quickest application growth in the Facial Injectable Market


• By End user

  • Hospitals and dermatology clinics controlled 47.4% of end-user demand

• By Region

  • North America retained 42.1% of global revenue in 2025
  • Asia-Pacific posts the highest regional CAGR at 11.3% to 2035
  • Middle East & Africa contributed USD 0.56 Billion in 2025


Market Size and Forecast (2021–2035)

Estimates blend audited revenue disclosures from twelve publicly listed aesthetics manufacturers, customs-level import data for toxin and filler HS codes across 38 countries, and a procedure-volume model calibrated against national dermatology society registries. Historical years are reconciled bottom-up; forecast years apply a channel-weighted growth model.
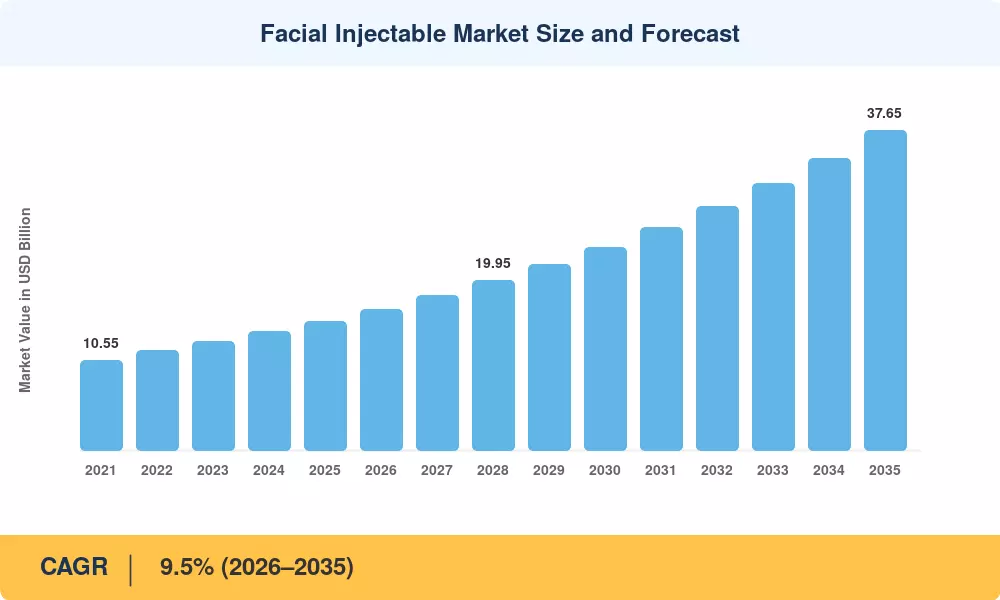
Facial Injectable Market Size and Forecast
Our Impact
Enabled $4.3B Revenue Impact for Fortune 500 and Leading Multinationals
Partnering with 2000+ Global Organizations Each Year
30K+ Citations by Top-Tier Firms in the Industry

Driver Impact Analysis

Driver ~% Impact on CAGR Geographic Relevance Impact Timeline
Normalisation of non-surgical aesthetics via social platforms 1.9 Global Medium-term (2–4 yr)
Medical spa and retail clinic channel proliferation 1.5 North America, Europe Short-term (≤2 yr)
Expanding male patient base 1.4 North America, Asia-Pacific Medium-term (2–4 yr)
Aging demographics and longevity spending 1.3 Europe, Asia-Pacific Long-term (≥4 yr)
AI-guided facial mapping and injection planning 1.2 North America, Asia-Pacific Long-term (≥4 yr)
Longer-duration toxin formulations 1.1 Global Medium-term (2–4 yr)
Therapeutic indication crossover 0.8 Global Long-term (≥4 yr)


Channel Expansion Through Medical Spas

Retail-format aesthetic providers have restructured the operational economics of the facial injectable market. According to data tracked by the American Med Spa Association (AmSpa), the active US medical spa footprint expanded to 10,488 locations, with average per-location annual revenues reaching approximately USD 1.39 million. This widespread retail footprint has transitioned treatments like neurotoxins from traditional dermatology-gated appointments into accessible transactions, stabilizing repeat patient rates at roughly 73% across the sector.


The Male Patient Cohort

Male patient participation in non-surgical aesthetics represents a rapidly scaling demographic, with global tracking data from the International Society of Aesthetic Plastic Surgery (ISAPS) showing overall cosmetic procedures performed on men increasing by an annual rate of 18%. While botulinum toxin and soft-tissue fillers remain heavily utilized across middle-age brackets, specialized structural treatments such as non-surgical lower face, masseter, and jawline balancing continue to drive the modern male consumer mix heavily.


Formulation Longevity as a Pricing Lever

Manufacturers extract premiums during the duration. The SAKURA trials showed a median 24-week glabellar response in DaxibotulinumtoxinA, compared to approximately 16 weeks for legacy comparators. Clinics are pricing the differential at a 30–38% per-treatment premium [6]. In metropolitan markets, payer-free discretionary spending readily incorporates that premium; however, it is less effective outside of them.


Computational Treatment Planning

Software has moved from marketing gimmick to clinical infrastructure. Platforms that overlay dynamic muscle-activity maps on patient video reduced touch-up rates by 22% across a 1,200-patient multi-site audit published in 2025, and clinics using them reported average revenue per patient 14% above matched controls [11]. Adoption remains concentrated among chains with more than four locations.


Restraints Impact Analysis

Restraint ~% Impact on CAGR Geographic Relevance Impact Timeline
Regulatory enforcement against unlicensed injectors -1.1 North America Short-term (≤2 yr)
Price compression from biosimilar toxin entrants -1.0 Global Medium-term (2–4 yr)
Counterfeit and grey-market product infiltration -0.9 Asia-Pacific, MEA Medium-term (2–4 yr)
Discretionary spending sensitivity -0.8 Europe, South America Short-term (≤2 yr)
Adverse-event publicity and safety signals -0.6 Global Short-term (≤2 yr)


Enforcement and Compliance Cost

Regulators have also been more watchful about unauthorized distribution outlets and illegal esthetic methods. Counterfeit botulinum toxin products supplied in several states caused 9 hospitalizations in 9 states, prompting the US Food and Drug Administration (FDA) and the Centers for Disease Control and Prevention (CDC) to coordinate safety messaging and enforcement measures. Federal regulatory enforcement extended to unlawful internet vendors. The FDA sent warning letters to 18 websites that illegally marketed unapproved and misbranded botulinum toxin items. Multiple state public health safety occurrences spurred extensive examinations of distribution channels and more stringent chain of custody rules for legitimate medical esthetic providers.


Biosimilar Price Pressure

Korean manufacturers have modified the pricing bottom. Hugel and Medytox products entering Western markets were priced at 25–40% less than incumbent list prices, and average realized price per toxin unit in the US declined 6.8% between 2023 and 2025 despite volume growth [15]. Instead of matching, incumbents responded with loyalty bundling, which protected share but lowered margin by about 240 basis points.


Facial Injectable Market Opportunities

Long-Acting Formulation Portfolios

Duration extension remains a primary focus of product development in the aesthetic neuromodulator market. Advanced peptide-stabilized formulations and novel delivery candidates evaluated in clinical pipelines target extended duration profiles—stretching therapeutic windows toward 6 to 9 months, compared to the traditional 3 to 4 month maintenance window. Such extended-duration portfolios aim to optimize patient convenience while commanding premium pricing structures. Furthermore, manufacturers leveraging extended-duration toxins alongside comprehensive dermal filler lines seek to capture a larger share of complete facial treatment plans rather than single procedural line items.


Emerging-Market Clinic Buildout

India, Vietnam, Indonesia and Saudi Arabia together represent fewer than 1.2 accredited aesthetic clinics per 100,000 adults against 9.4 in South Korea [16]. Local manufacturing partnerships and tiered pricing unlock that gap; Saudi Arabia's Vision 2030 health-sector privatisation has already licensed 340 new aesthetic facilities since 2022 [17].

Outcome Data as a Commercial Asset

Clinics sitting on longitudinal before-and-after imaging hold underused inventory. Anonymised outcome datasets are licensed to manufacturers for post-market surveillance and to software developers for model training, generating USD 40,000–120,000 annually for mid-size chains. Subscription memberships that bundle treatments with imaging access reset the revenue model from transaction to recurring.

Therapeutic Indication Crossover

Reimbursed indications enlarge the addressable base without discretionary-spending exposure. Chronic migraine and cervical dystonia already anchor covered toxin volume; masseter hypertrophy and temporomandibular disorder coding is progressing through several European payers [18]. Manufacturers running parallel aesthetic and therapeutic trials amortise development cost across both.

Male-Specific Product Positioning

Men need more units — typically 1.4× the glabellar dose — and respond to functional rather than cosmetic framing. Dedicated male-channel branding, sports-medicine clinic partnerships and workplace-adjacent scheduling remain largely untested in Europe and Japan despite proven results in North America.


Facial Injectable Market Future Outlook


Subscription Economics Replace Transactions

Membership and recurring revenue models are systematically restructuring clinic financial frameworks. Industry tracking data from enterprise medical spa management platforms (such as Zenoti) demonstrates that structured loyalty and membership models yield a 13% year-over-year growth in package and subscription sales, consistently outpacing standard transactional models. Furthermore, verified client metrics indicate that enrolled members visit clinics up to 2.9 times more frequently and spend 35% more per visit than non-member transactional patients, successfully stabilizing seasonal income fluctuations.


Safety Infrastructure and Traceability

Serialisation moves from optional to mandatory. EU and Gulf regulators are converging on unique device identification for injectables, and the Facial Injectable Market will carry roughly USD 380 million in annual incremental compliance cost by 2030 [19]. That cost falls hardest on small operators and accelerates the consolidation already underway across every major region.


Facial Injectable Market Segmentation

By Product Type

Product mix within the Facial Injectable Market remains toxin-led, but the growth is elsewhere.

Segment Metric (2025) Primary Demand Driver
Botulinum Toxin 52.8% share High repeat-visit frequency and brand loyalty
Hyaluronic Acid USD 5.02 Billion Reversibility and predictable volumisation
Calcium Hydroxylapatite 6.1% share Structural support in mid-face correction
Poly-L-Lactic Acid 15.6% CAGR Collagen stimulation with progressive results
Polymethyl Methacrylate USD 0.41 Billion Long-duration correction in select indications
Others 2.6% share Autologous and combination formulations


Botulinum toxin's dominance rests on visit cadence rather than price — patients return two to three times annually, generating lifetime value no single-session product matches. Hyaluronic acid holds second position because reversibility with hyaluronidase lowers the perceived risk for first-time patients, which matters enormously in a discretionary category. Poly-L-lactic acid grows fastest as practitioners shift toward gradual collagen stimulation for patients who want change that neighbours do not notice.

By Gender

Gender mix in the Facial Injectable Market is shifting faster than most operators have adjusted for.

Segment Metric (2025) Primary Demand Driver
Female 77.3% share Established treatment norms across age cohorts
Male 12.7% CAGR Professional-cohort adoption under age 45


The facial injectable market by gender is dominated by the Female segment, which holds a 77.3% share driven by established treatment norms across age cohorts. Meanwhile, the Male segment represents the fastest-growing area, expanding at a 12.7% CAGR fueled by professional-cohort adoption under age 45.

By Application

Segment Metric (2025) Primary Demand Driver
Wrinkle Reduction and Anti-Aging 37.0% share Core glabellar and periorbital demand
Lip Augmentation 18.2% share Social-media-driven volume among under-35 patients
Face Lift 16.1% share Non-surgical alternative to rhytidectomy
Scar and Acne-Scar Treatment 14.9% CAGR Dermatology referral pathways
Lipoatrophy 8.5% share HIV-related and age-related fat-pad loss
Others 6.8% share Hyperhidrosis and combination protocols


Anti-aging applications, with a 37.0% share, remain the volume backbone. However, scar treatment is where clinical credibility is being built — dermatologist referral is the entry point, and referred patients convert to broader treatment plans at roughly twice the rate of walk-ins.

By End User

Channel structure in the Facial Injectable Market determines both pricing power and compliance exposure.

Segment Metric (2025) Primary Demand Driver
Hospitals and Dermatology Clinics 47.4% share Clinical credibility and therapeutic crossover
Aesthetic Centers 31.2% share Specialist practitioner concentration
Medical Spas 12.6% CAGR Convenience, pricing and retail-format accessibility


Hospital and dermatology settings retain the largest share because complication management and therapeutic indications both live there. Medical spas grow fastest by removing friction — walk-in scheduling, retail locations, membership pricing — though they carry the heaviest regulatory scrutiny.


Regional Market Share Analysis

Region Metric (2025) Primary Investment Themes
North America 42.1% share Medical spa rollups, long-acting toxin launches
Europe 27.4% share Therapeutic indication crossover, cross-border clinic chains
Asia-Pacific 11.3% CAGR (2026–2035) Domestic toxin manufacturing, K-beauty export channels
South America USD 0.79 Billion Brazilian clinic consolidation, filler localisation
Middle East & Africa USD 0.56 Billion Gulf medical tourism, licensing liberalisation
Total USD 15.20 Billion

Regional performance in the Facial Injectable Market splits along regulatory maturity and channel structure rather than income alone. North America leads on channel density, Asia-Pacific on manufacturing cost and cultural adoption, and Europe on therapeutic crossover. Growth in the Facial Injectable Market over the forecast decade tilts steadily eastward.


North America

Country Metric (2025) Key Driver
US 84.6% of region Medical spa density and long-acting toxin adoption
Canada USD 0.53 Billion Provincial scope-of-practice expansion for nurse injectors
Mexico 12.9% CAGR Cross-border aesthetic tourism from southern US states


Scale and enforcement pull in opposite directions across the region. US clinic count growth continues, but the 2024 FDA warning-letter cycle and parallel state-board actions raised the compliance floor sharply, favouring multi-site operators who can amortise credentialing and cold-chain infrastructure [1][8]. Canada's nurse-injector scope expansion in Ontario and British Columbia added roughly 1,800 credentialed practitioners between 2023 and 2025. Mexican border-city clinics increasingly serve US patients at 45–55% price differentials, a flow that formal statistics undercount. Regional performance in the Facial Injectable Market remains the global benchmark for per-capita procedure frequency.

Europe

Country Metric (2025) Key Driver
Germany 21.8% of region Dermatology clinic density and therapeutic coding
UK USD 0.72 Billion Post-Brexit MHRA device pathway and clinic chain scale
France 16.4% of region Aesthetic medicine training accreditation
Italy USD 0.44 Billion Filler-led treatment mix and tourism corridors
Spain 8.9% of region Price-competitive clinic clusters in Madrid and Barcelona
Nordic Countries 8.1% CAGR High disposable income, low procedure penetration
Russia USD 0.24 Billion Domestic toxin substitution after supply disruption
Rest of Europe 9.6% of region Central European medical tourism


Regulation shapes European demand more directly than elsewhere. The EU Medical Device Regulation reclassified several dermal filler categories, forcing recertification that removed an estimated 14% of filler SKUs from the market between 2021 and 2024 and consolidated share among manufacturers with full technical files [19]. Germany's coding progress on masseter and bruxism treatment moved a slice of volume into reimbursed territory. UK clinic chains meanwhile scaled aggressively, with the top five operators tripling location count since 2021.

Asia-Pacific

Country Metric (2025) Key Driver
China 31.2% of region NMPA approvals for domestic and imported toxins
India 13.8% CAGR Metro clinic buildout and rising discretionary spend
Japan USD 0.61 Billion Aging demographics and high per-treatment pricing
South Korea 19.4% of region Manufacturing base and procedure normalisation
ASEAN USD 0.29 Billion Medical tourism into Thailand and Malaysia
Rest of Asia-Pacific 7.4% of region Australian clinic chain expansion


Supply-side advantage explains why the Facial Injectable Market grows fastest in the APAC. Korean manufacturers hold approvals across more than 60 countries and produce at cost structures 30–45% below Western incumbents, which lets regional clinics price aggressively without margin loss [15]. China's NMPA approved several additional toxin products between 2023 and 2025, expanding legitimate supply against a persistent grey channel. India's growth runs off a small base — roughly 0.4 accredited clinics per 100,000 adults — leaving substantial headroom.

South America

Country Metric (2025) Key Driver
Brazil 58.3% of region ANVISA-approved portfolio breadth and clinic density
Argentina USD 0.13 Billion Currency-driven inbound aesthetic tourism
Rest of South America 9.4% CAGR Chilean and Colombian clinic formalisation


Brazil anchors the region on cultural acceptance and practitioner supply — the country registers more aesthetic-trained physicians than any market outside the US, and ANVISA has approved a broad filler and toxin portfolio [20]. Argentine clinics benefit from exchange-rate arbitrage that draws patients from neighbouring countries, though import-cost volatility complicates inventory planning. Colombia's clinic sector is formalising quickly under tightened licensing rules introduced in 2024.

Middle East & Africa

Country Metric (2025) Key Driver
Saudi Arabia 24.1% of region Vision 2030 health-sector privatisation
UAE USD 0.16 Billion Dubai medical tourism and premium clinic clustering
South Africa 8.7% of region Private-sector dermatology network
Egypt 11.6% CAGR Cost-competitive clinics serving regional demand
Rest of MEA 18.3% of region Gulf spillover and Levantine clinic growth


Policy liberalisation drives Gulf growth. Saudi licensing reform under Vision 2030 permitted 340 new aesthetic facilities since 2022 and relaxed foreign-practitioner rules, while Dubai's health authority positioned aesthetics as a medical-tourism pillar with dedicated visa pathways [17]. Counterfeit penetration remains the sector's structural weakness across parts of the region, with seizure volumes rising steadily [12].


Facial Injectable Market By Region, 2025-2035

Competitive Benchmarking

Concentration sits in the medium band. The top five suppliers hold an estimated 62% of global revenue and the calculated HHI lands near 1,350, indicating a market led by a clear incumbent but with viable challengers on both price and duration. Korean entrants have compressed the tail meaningfully since 2022, and filler-only specialists retain defensible niches where toxin manufacturers lack portfolio depth.

Company Est. Revenue Share Range Key Offerings for Facial Injectable Market Strategic Positioning
AbbVie (Allergan Aesthetics) ~26–30% Botulinum toxin, hyaluronic acid filler portfolio Category incumbent; loyalty-program defence
Galderma ~14–17% Toxin and full filler range, collagen stimulators Broadest combined portfolio; strong Europe
Merz Aesthetics ~9–12% Toxin, calcium hydroxylapatite, energy devices Differentiated on non-HA biostimulators
Ipsen ~5–7% Botulinum toxin franchise Therapeutic and aesthetic dual-track
Hugel ~4–6% Toxin and HA filler lines Cost-led global expansion from Korea
Medytox ~3–5% Toxin portfolio, liquid formulations Formulation innovation; licensing-driven
Revance Therapeutics ~2–4% Long-duration toxin, HA filler Duration-led premium positioning
Evolus ~2–3% Toxin, filler distribution Performance-beauty branding for aesthetics-only
LG Chem ~2–3% Toxin and filler manufacturing Asia-Pacific manufacturing scale
Sinclair (Huadong Medicine) ~2–3% Collagen stimulators, HA fillers China distribution plus European brands
Teoxane ~2–3% HA filler specialist range Rheology-differentiated filler science
Prollenium Medical ~1–2% HA filler portfolio Independent challenger in North America


Recent News & Developments

  • US Food and Drug Administration (March 2024): Issued warning letters and a public safety communication targeting unlicensed injectors and counterfeit product distribution, raising documentation requirements for legitimate clinics across the Facial Injectable Market [1]
  • Galderma (May 2024): Completed its Zurich IPO, raising roughly CHF 2.3 billion earmarked partly for injectable portfolio expansion and emerging-market distribution [4]
  • Revance Therapeutics (August 2024): Expanded long-duration toxin distribution agreements across additional US clinic chains following favourable durability data [6]
  • Hugel (November 2024): Secured additional Western regulatory clearances, extending its approved-country footprint past sixty markets [15]
  • Merz Aesthetics (February 2025): Launched an integrated treatment-planning software suite bundled with its biostimulator portfolio for chain-clinic customers [11]
  • European Commission (April 2025): Advanced unique device identification requirements for injectable aesthetic products under MDR implementation timelines [19]
  • AbbVie (June 2025): Announced a next-generation toxin development programme targeting extended-duration response, with Phase II readouts expected in 2027 [3]
  • Saudi Ministry of Health (September 2025): Broadened aesthetic clinic licensing under Vision 2030 health privatisation, adding capacity across Riyadh and Jeddah [17]


Facial Injectable Market Report Scope

Parameter Detail
Market Scope Global Facial Injectable Market by product type, gender, application, end user and geography
Study Period 2021–2035 (Historical 2021–2024; Base Year 2025; Forecast 2026–2035)
CAGR 9.5% (2026–2035)
Market Size Checkpoints USD 15.20 Billion (2025); USD 16.64 Billion (2026); USD 37.65 Billion (2035)
Fastest Growing Segments Poly-L-Lactic Acid (product); Male (gender); Scar and Acne-Scar Treatment (application); Medical Spas (end user); Asia-Pacific (region)
Companies Profiled 12 leading suppliers including AbbVie, Galderma, Merz Aesthetics, Ipsen, Hugel, Medytox, Revance, Evolus, LG Chem, Sinclair, Teoxane, Prollenium
Valuation Currency USD Billion

FAQs

How should investors assess contract manufacturing exposure in the Facial Injectable Market?
Toxin fill-finish capacity is concentrated among fewer than a dozen qualified sites globally, giving long-term tolling agreements real scarcity value. Weight regulatory inspection history and contract duration above headline capacity claims. [12]
What procurement terms matter most when a clinic chain negotiates toxin supply?
Rebate tiers, consignment terms and guaranteed allocation during shortages matter more than headline unit price. Chains with multi-year volume commitments typically secure 12–18% better effective pricing than single-site buyers. [8]
How do biosimilar toxins reshape competitive dynamics in the Facial Injectable Market?
Biosimilar entrants compress unit pricing but expand procedure volume, leaving revenue broadly flat while margins narrow. Incumbents defend position through loyalty programmes and bundled filler portfolios rather than matching price. [15]
What credentialing barriers slow new clinic entrants?
Most jurisdictions require physician supervision plus documented injector training, and insurers increasingly demand proof of accredited coursework. Credentialing timelines of six to nine months are the practical bottleneck. [7]
What integration problems arise when clinics adopt facial-mapping software?
Imaging platforms rarely connect cleanly to legacy practice-management systems, forcing duplicate patient records. Budget for middleware and expect eight to twelve weeks before clinical workflows stabilise. [11]
How does cold-chain and inventory risk affect operators in the Facial Injectable Market?
Toxin vials require 2–8°C storage and lose potency after reconstitution, so overstocking destroys margin directly. Weekly ordering against booked appointments outperforms monthly bulk purchasing for most single-site clinics. [14]
Which emerging therapeutic uses could widen the addressable patient base?
Chronic migraine, cervical dystonia and hyperhidrosis already generate reimbursed toxin demand, and masseter reduction is moving toward functional coding. Depression and overactive bladder trials could extend the base further. [18]    
Author
Author
Author Profile
Nidhi Mandole LinkedIn
Senior Research Analyst
She is an extremely curious individual currently working in Healthcare and Medical Devices Domain. Nidhi is comfortably versed in data centric research backed by healthcare educational background. She leverages extensive data mining and analytics tools such as Primary and Secondary Research, Statistical Analysis, Machine Learning, Data Modelling. Her key role also involves Technical Sales Support, Client Interaction and Project management within the Healthcare team. Lastly, she showcases extensive affinity towards learning new skills and remain fascinated in implementing them.
Co-Author
Co-Author Profile
Rahul Gotadki LinkedIn
Research Manager
He holds an experience of about 9+ years in Market Research and Business Consulting, working under the spectrum of Life Sciences and Healthcare domains. Rahul conceptualizes and implements a scalable business strategy and provides strategic leadership to the clients. His expertise lies in market estimation, competitive intelligence, pipeline analysis, customer assessment, etc.
Share::
Request Free Sample

Research Approach


Secondary Research

The secondary research process involved comprehensive analysis of regulatory databases, peer-reviewed medical journals, clinical publications, and authoritative health organizations. Key sources included the US Food & Drug Administration (FDA) Center for Biologics Evaluation and Research, European Medicines Agency (EMA) Human Medicines Division, Pharmaceuticals and Medical Devices Agency (PMDA) Japan, Health Canada, Australian Therapeutic Goods Administration (TGA), International Society of Aesthetic Plastic Surgery (ISAPS.org), American Society for Dermatologic Surgery (ASDS), American Society of Plastic Surgeons (ASPS), International Association for Physicians in Aesthetic Medicine (IAPAM), American Med Spa Association (AmSpa), National Institutes of Health (NIH), National Center for Biotechnology Information (NCBI/PubMed), World Health Organization (WHO) Global Health Observatory, OECD Health Statistics, EU Eurostat Health Database, Centers for Disease Control and Prevention (CDC) National Center for Health Statistics, American Academy of Facial Plastic and Reconstructive Surgery (AAFPRS), British Association of Aesthetic Plastic Surgeons (BAAPS), Korean Ministry of Food and Drug Safety (MFDS), and national health ministry reports from key aesthetic markets including Brazil, Mexico, and Gulf Cooperation Council (GCC) states. These sources were used to collect procedure statistics, regulatory approval data, clinical safety studies, demographic trends, and market landscape analysis for botulinum toxin type A products, hyaluronic acid-based dermal fillers, calcium hydroxylapatite, poly-L-lactic acid, polymethylmethacrylate (PMMA) microspheres, and collagen-based injectable technologies.


Primary Research

In order to gather both qualitative and quantitative insights, supply-side and demand-side stakeholders were interviewed during the primary research process. CEOs, VPs of Product Development, heads of regulatory affairs, and commercial directors from biotechnology companies, OEM partners, and producers of face injectables were examples of supply-side sources. Board-certified dermatologists, plastic surgeons, facial plastic surgeons, medical spa medical directors, aesthetic nurses, and procurement leads from dermatology clinics, cosmetic surgery facilities, hospitals, and medical spa chains were among the demand-side sources. Primary research verified product pipeline timeframes, validated market segmentation across product classes (collagen, hyaluronic acid, polymers/particles, and botulinum toxin), and obtained information on patient demographic trends, pricing strategies, clinical adoption patterns, and reimbursement dynamics.

Primary Respondent Breakdown:

By Designation: C-level Primaries (32%), Director Level (30%), Others (38%)

By Region: North America (38%), Europe (25%), Asia-Pacific (28%), Rest of World (9%)


Market Size Estimation

Global market valuation was derived through revenue mapping and procedure volume analysis. The methodology included:

Identification of 50+ key manufacturers across North America, Europe, Asia-Pacific, Latin America, and Middle East & Africa

Product mapping across botulinum toxin, hyaluronic acid, polymers/particles (calcium hydroxylapatite, poly-L-lactic acid, PMMA), and collagen injectable categories

Analysis of reported and modeled annual revenues specific to facial injectable portfolios

Coverage of manufacturers representing 75-80% of global market share in 2024

Extrapolation using bottom-up (procedure volume × ASP by country/region) and top-down (manufacturer revenue validation) approaches to derive segment-specific valuations across facial line correction treatment, face lift procedures, and lip enhancement applications

Share::
Request Free Sample
Download Free Sample

Kindly complete the form below to receive a free sample of this Report

* Please use a valid business email

Share::
Request Free Sample
Download PDF ×

We do not share your information with anyone. However, we may send you emails based on your report interest from time to time. You may contact us at any time to opt-out.
















