Facial Serum Market (2026 - 2035)

Facial Serum Market Size, Share, Industry Trend & Analysis Research Report Information By Functionality (Hydrating Serum, Anti-Ageing Serum, Brightening/Lightening Serum, Acne-Fighting Serum, Others), By Form (Oil-Based, Water-Based, Others), By Price Point (Mass, Premium/Luxury), By Distribution Channel (Hypermarkets/Supermarkets, Health and Beauty Stores, Online Retail Stores, Others), By Geography (North America, Europe, Asia-Pacific, South America, Middle East & Africa) – Forecast Till 2035

Forecast Period
2026-2035
CAGR
8.0%
2025 Market Size
USD 6.75 Billion
2035 Market Size
USD 14.58 Billion
Consumer and Retail ● Updated August 27, 2026 Report ID: MRFR/CG/20325-HCR | Pages: 128 | Author: Sakshi Gupta

Facial Serum Market Summary

The Facial Serum Market was valued at USD 6.75 Billion in 2025 and opens the forecast window at USD 7.29 Billion in 2026, climbing to USD 14.58 Billion by 2035 at a compound annual growth rate of 8.0% across 2026–2035. Two catalysts anchor that trajectory. The U.S. Food and Drug Administration's Modernization of Cosmetics Regulation Act, which has required facility registration and product listing since July 2024, has pushed serum makers toward documented, traceable formulation practices [1]. Alongside it, the European Union's phased restrictions under Regulation (EC) No 1223/2009 continue to reshape which molecules brands can commercialize at scale [2].

Reformulation is the quiet engine of the Facial Serum Market. Legacy emulsion-heavy creams delivering low-percentage botanicals are giving way to precision-dosed aqueous systems built around encapsulated retinoids, stabilized ascorbic acid derivatives and multi-weight hyaluronic fractions. L'Oréal alone reported research and innovation spending above EUR 1.3 billion in its most recent full year, a meaningful share of it directed at delivery-system science [3].

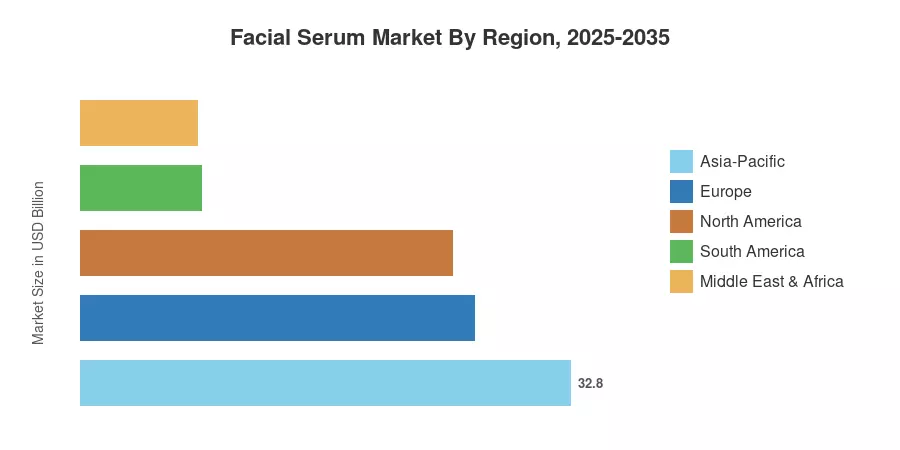
Regionally, Asia-Pacific holds 32.8% of 2025 revenue, powered by Korean and Chinese ampoule culture. The Middle East & Africa region is the pace-setter at a 9.3% CAGR. Europe follows Asia-Pacific with 26.4%, sustained by pharmacy-adjacent dermocosmetic brands. The decade ahead belongs to whoever proves efficacy claims fastest.

Key Report Takeaways

The bullets below summarize the headline findings of the Facial Serum Market study.

• By Functionality

  • Anti-ageing serums held 32.7% of global revenue in 2025, the single largest functional pool in the Facial Serum Market.
  • Acne-fighting serums are forecast to compound at 8.9% through 2035 as dermatologist-adjacent brands scale.

• By Form and Price Point

  • Water-based formats accounted for 56.0% of 2025 revenue
  • Premium and luxury price tiers are advancing at a 9.7% CAGR, the fastest of any commercial tier

• By Region

  • Asia-Pacific contributed USD 2.21 Billion in 2025
  • Middle East & Africa is the fastest-expanding geography in the Facial Serum Market at a 9.3% CAGR
  • North America holds 24.9% of global revenue

Market Size and Forecast (2021–2035)

Historical values were triangulated from audited beauty-division filings of eleven listed manufacturers, customs-level trade data for cosmetic preparations and retail scanner panels covering pharmacy, specialty beauty and e-commerce channels. Forecast values apply a demand model weighted to per-capita discretionary beauty spend and channel migration. The table below presents the Facial Serum Market on a revenue basis.
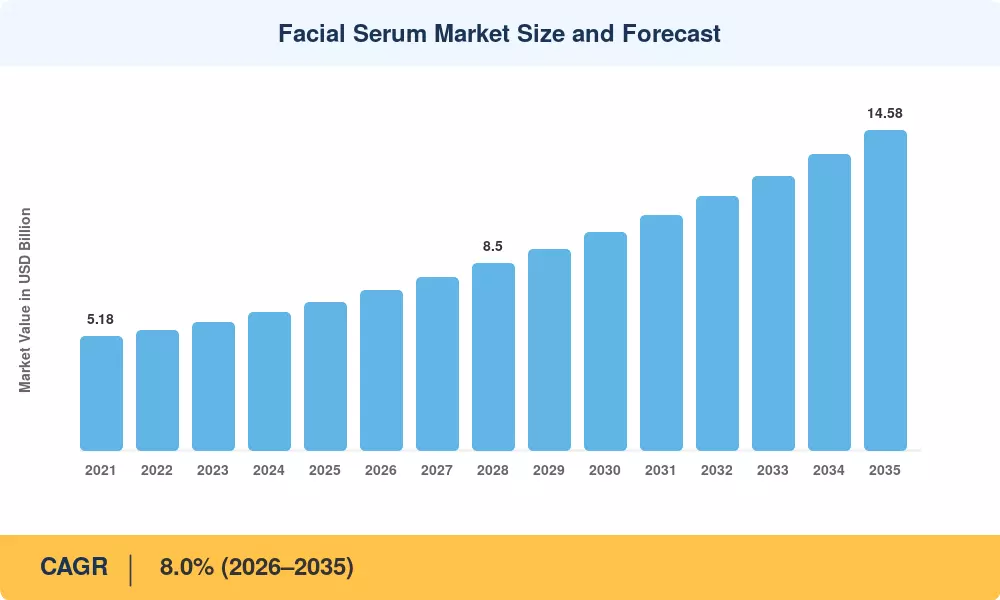
Facial Serum Market Size and Forecast
Our Impact
Enabled $4.3B Revenue Impact for Fortune 500 and Leading Multinationals
Partnering with 2000+ Global Organizations Each Year
30K+ Citations by Top-Tier Firms in the Industry

Driver Impact Analysis

Driver ~% Impact on CAGR Geographic Relevance Impact Timeline
Concentration-led efficacy positioning 1.9 Global Medium-term (2–4 yr)
E-commerce and social commerce migration 1.6 Asia-Pacific, North America Short-term (≤2 yr)
Dermocosmetic and pharmacy channel growth 1.2 Europe, Latin America Medium-term (2–4 yr)
Male grooming category expansion 0.8 Asia-Pacific, MEA Long-term (≥4 yr)
Regulatory clarity post-MoCRA 0.7 North America Short-term (≤2 yr)
Gulf beauty retail investment 0.6 Middle East Medium-term (2–4 yr)
Refill and concentrate packaging economics 0.5 Europe Long-term (≥4 yr)


Concentration-Led Efficacy Positioning

Shoppers now read percentages the way they once read brand names. Clinical-style labelling of active skincare ingredients has moved from niche indie brands into mass retail, and the Facial Serum Market has been the primary beneficiary because serums carry the highest payload per millilitre in a routine. Beiersdorf disclosed that its dermocosmetic arm grew at a double-digit organic rate on the back of concentration-forward launches [9].

E-Commerce and Social Commerce Migration

Digital shelves reward serums disproportionately. Small format, high price-per-gram and demonstrable before-and-after content make the category unusually shippable and unusually viral. Online retail stores are compounding at 9.8% through 2035, outpacing every physical channel, with livestream commerce in China accounting for an estimated fifth of prestige skincare sell-through [8].

Dermocosmetic and Pharmacy Channel Growth

Pharmacy shelves lend credibility that advertising cannot buy. European pharmacy skincare sales expanded roughly 9% in 2024, with serums the fastest sub-category inside that basket [9]. L'Oréal's dermatological beauty division has been its growth leader for three consecutive reporting years, and serum SKUs anchor the assortment [3].

Regulatory Clarity Post-MoCRA

Registration requirements initially read as a cost burden. In practice, they raised the entry bar, consolidated shelf space around compliant manufacturers, and gave established players a defensible moat. Facilities registering under the Act must maintain adverse-event records, a discipline that favours the roughly 15% of manufacturers already operating to pharmaceutical-adjacent quality systems [1].

Restraints Impact Analysis

Restraint weightings represent estimated drag on the headline growth rate and are directional rather than additive. Each reflects observable friction in pricing, supply or claim substantiation.

Restraint ~% Drag on CAGR Geographic Relevance Impact Timeline
Active ingredient cost volatility -0.9 Global Short-term (≤2 yr)
Claim substantiation and greenwashing scrutiny -0.7 Europe, North America Medium-term (2–4 yr)
Category saturation and SKU proliferation -0.6 North America, South Korea Medium-term (2–4 yr)
Counterfeit penetration in online channels -0.5 Asia-Pacific, MEA Long-term (≥4 yr)
Consumer skin-barrier fatigue and over-exfoliation backlash -0.4 Global Long-term (≥4 yr)


Active Ingredient Cost Volatility

Pharmaceutical-grade actives are priced as specialized compounds, not commodities. For bio-fermented hyaluronic acid, contract pricing swung over 20% in 2023–2024 as demand outpaced and then lagged capacity expansions in Shandong [12]. Margin compression strikes mass-tier brands hardest, which cannot reprice without losing volume.


Claim Substantiation Scrutiny

Regulators have focused on effectiveness language. The EU’s Green Claims framework and current uniform criteria for cosmetic claims demand that performance statements must be evidence based and enforcement proceedings across member states have increased year on year [2]. Substantiation investigations cost between USD 40,000 and USD 120,000 per claim set, essentially preventing smaller competitors from making comparison claims.


Category Saturation

Serum introductions are not limited by shelf space. In 2024, retailer assortment assessments in North America resulted in mid-single-digit percentage reductions in skincare SKU counts in numerous chains, with serums bearing a disproportionate part of the delisting as they had the highest level of duplication [7].


Facial Serum Market Opportunities

Emerging-Market Premiumization

India, Indonesia and Nigeria have the largest gap in awareness of skincare and serum penetration. Urban India's household penetration of serum is also less than 15% compared to more than 40% in South Korea [15]. But when discretionary cash surpasses the barrier where a regimen gets a third step, the Facial Serum Market is the first to pick up that upgrade.


Diagnostic-Led Personalization and Data Monetization

Skin-scan applications generate a proprietary asset most brands are barely using. Firms that convert diagnostic imagery into recommendation engines can monetize subscription refills and sell anonymized efficacy cohorts to ingredient suppliers. Amorepacific and Shiseido both operate consumer diagnostic platforms with installed bases in the millions [16].

Male-Directed Formulation

Men's serum demand is growing from a small base but with unusually low competitive density. Gulf and East Asian markets lead adoption, and a 0.8-point CAGR contribution is attributable to this cohort alone.

Refill and Concentrate Architecture

Packaging is the largest carbon line item in a serum's footprint. Refill systems cut per-unit packaging mass by roughly 60% and allow a price ladder that protects margin while lowering the consumer's repeat cost [11].

Clinical Channel Crossover

Aesthetic clinics increasingly dispense post-procedure serums as an adjunct revenue line. This channel is small today but carries pricing power and physician endorsement that no retail shelf can match [9].

Facial Serum Market Future Outlook

Algorithmic Formulation and Diagnostic Personalization

Machine-learning models trained on ingredient-response datasets are compressing formulation cycles from years to months. The Facial Serum Market will feel this first in efficacy claims, because faster iteration means faster substantiation. Shiseido has publicly tied its digital skin-analysis platform to product development inputs, and peers are following [16].

Channel Economics and the Subscription Turn

Repeat purchase intervals for serums cluster between eight and twelve weeks, which is close to ideal subscription economics. Brands that convert even a fifth of their base to auto-replenishment lift lifetime value materially while smoothing demand planning [8].

Ingredient Supply Chain Localization

Concentration risk in fermentation-derived actives is now a board-level topic. Capacity announcements across South Korea and India signal a deliberate move away from single-country sourcing, with several suppliers committing to dual-site qualification by 2028 [12].

Sustainability Disclosure and Packaging Reform

The EU Packaging and Packaging Waste Regulation sets binding reuse and recyclability targets that bite from 2030 onward, and serum packaging — glass, droppers, secondary cartons — is squarely in scope [11]. Expect the Facial Serum Market to converge on refillable architecture faster than the broader skincare category, because unit volumes are small and refill economics work.

Facial Serum Market Segmentation

Segmentation of the Facial Serum Market follows functionality, form, price point and distribution channel.

By Functionality

Segment Metric Primary Demand Driver
Anti-Ageing Serum 32.7% share (2025) Ageing demographics and retinoid adoption
Hydrating Serum USD 1.86 Billion (2025) Barrier-repair positioning
Brightening/Lightening Serum 7.6% CAGR Pigmentation concerns in Asia-Pacific
Acne-Fighting Serum 8.9% CAGR Younger cohorts and dermatologist influence
Others USD 0.61 Billion (2025) Niche concern targeting


Anti-ageing remains the profit anchor of the Facial Serum Market, and the reason is pricing rather than volume: anti-aging formulations command the widest gross margins in skincare. Acne-fighting serums are the growth story, propelled by clinically framed brands that borrowed dermatology's vocabulary and sold it at mass price points [14].

By Form

Segment Metric Primary Demand Driver
Water-Based 56.0% share (2025) Layering compatibility and light finish
Oil-Based 9.4% CAGR Barrier and facial-oil crossover demand
Others USD 0.42 Billion (2025) Gel-cream and biphasic hybrids


The lion’s share of the market is held by water-based formulas, which are highly desirable for their ability to slot into multi-step layering procedures and their featherlight finish. In contrast, the strong interest on skin barrier protection from consumers is driving high growth in oil-based treatments as well as alternative hybrid formats (gel-creams and dual-phase/biphasic serums) that are catering to specialized niche demand for combined hydration and lipid nourishing.


By Price Point

Segment Metric Primary Demand Driver
Mass 64.5% share (2025) Accessible pricing and drugstore reach
Premium/Luxury 9.7% CAGR Prestige trade-up and gifting occasions


Mass still owns the volume, but the premium tier owns the momentum within the Facial Serum Market. Trade-up behaviour is strongest in the Gulf and in tier-one Chinese cities, where a single high-ticket serum frequently substitutes for a multi-product routine [7].

By Distribution Channel

Segment Metric Primary Demand Driver
Health and Beauty Stores 33.9% share (2025) Assortment depth and staff advice
Online Retail Stores 9.8% CAGR Social commerce and subscription models
Hypermarkets/Supermarkets USD 1.55 Billion (2025) Basket attachment at mass tier
Others 6.4% CAGR Clinics, salons and direct selling


Health and beauty specialty stores occupy the biggest market share, driven by curated product depth and individualized customer service. Meanwhile, online retail stores are the fastest growing distribution channel, driven by social commerce platforms, digital beauty creator education and recurring subscription models.


Regional Market Share Analysis

Region Share of 2025 Revenue Primary Investment Themes
Asia-Pacific 32.8% Ampoule innovation, livestream retail, K-beauty export
Europe 26.4% Dermocosmetics, refill packaging, claim compliance
North America 24.9% MoCRA compliance, clinical-grade branding, DTC
South America 8.1% Direct-selling networks, local manufacturing
Middle East & Africa 7.8% Luxury retail buildout, halal certification
Total 100.0%

Regional performance in the Facial Serum Market diverges more on channel structure than on category awareness.


North America

Country Metric Key Driver
US 78.4% of regional revenue Prestige and clinical-grade brand density
Canada USD 0.21 Billion Pharmacy-led dermocosmetic adoption
Mexico 8.1% CAGR Direct-selling and modern trade expansion


Compliance reshaped the U.S. competitive field faster than any consumer trend. Registration and listing obligations effective July 2024 forced hundreds of contract manufacturers to formalize documentation, and several small brands exited rather than absorb the cost [1]. Mexico's growth leans on Natura-style relationship selling reaching consumers that modern trade has not.

Europe

Country Metric Key Driver
Germany 21.3% of regional revenue Pharmacy skincare depth
UK USD 0.29 Billion Specialty beauty retail and DTC
France 19.6% of regional revenue Luxury house serum franchises
Italy 7.4% CAGR Parapharmacy channel growth
Spain USD 0.13 Billion Value-tier premiumization
Nordic Countries 6.9% CAGR Clean-formulation preference
Russia USD 0.09 Billion Domestic substitution brands
Rest of Europe 8.4% of regional revenue Cross-border e-commerce


Europe's regulatory perimeter is its competitive advantage. Annex restrictions under Regulation 1223/2009 have removed several legacy preservatives and UV filters from circulation, and manufacturers that reformulated early now export compliant products into jurisdictions adopting similar standards [2]. France's luxury houses continue to treat serum as the profit centre of the skincare pyramid.

Asia-Pacific

Country Metric Key Driver
China 34.2% of regional revenue Livestream commerce and domestic C-beauty
India 10.4% CAGR Urban routine adoption and value serums
Japan USD 0.38 Billion Lotion-serum hybrid formats
South Korea 15.7% of regional revenue Ampoule innovation and export engine
ASEAN 9.6% CAGR Halal and tropical-climate formulation
Rest of Asia-Pacific USD 0.17 Billion Travel retail recovery


Asia-Pacific anchors the Facial Serum Market because it invented the format's modern grammar. Korean cosmetic exports reached record levels in 2024, with the United States overtaking China as the largest destination [5]. China's NMPA registration regime for new cosmetic ingredients has simultaneously opened a domestic innovation lane that C-beauty brands are exploiting aggressively [17].

South America

Country Metric Key Driver
Brazil 56.8% of regional revenue Direct-selling scale and local production
Argentina USD 0.07 Billion Inflation-resilient value tiers
Rest of South America 7.9% CAGR Andean modern trade expansion


Brazil's structural advantage is distribution rather than formulation. Natura's consultant network reaches households far outside retail catchments, and serum attachment rates within existing skincare baskets have climbed steadily since 2022 [18]. ANVISA's simplified registration pathway for lower-risk cosmetics shortened launch cycles materially.

Middle East & Africa

Country Metric Key Driver
Saudi Arabia 24.6% of regional revenue Vision 2030 retail and tourism buildout
UAE USD 0.11 Billion Travel retail and luxury concentration
South Africa 8.7% CAGR Pharmacy chain skincare expansion
Egypt 9.9% CAGR Local manufacturing and value formats
Rest of MEA 31.2% of regional revenue Distributor-led market entry


Gulf demand behaves like luxury demand elsewhere, only younger. Saudi Arabia's Vision 2030 retail programme has underwritten mall and beauty-format investment exceeding USD 20 billion in commitments, and prestige skincare has been an early beneficiary [6]. Halal certification is now a purchase filter across much of the region, not a niche label.

Facial Serum Market By Region, 2025-2035

Competitive Benchmarking

Concentration is moderate. The top five groups control an estimated 38–43% of global revenue, implying a Herfindahl-Hirschman Index in the 500–700 band — fragmented enough that indie brands still scale, consolidated enough that shelf access runs through a handful of gatekeepers. Acquisition remains the dominant entry route into the Facial Serum Market for large houses.

Company Est. Revenue Share Range Key Offerings for Facial Serum Market Strategic Positioning
L'Oréal Group ~11–14% Revitalift, Hyaluron Expert, Vichy Mineral 89 Multi-tier portfolio from mass to dermocosmetic
The Estée Lauder Companies ~8–11% Advanced Night Repair, The Ordinary concentrates Prestige leadership plus value-active challenger brand
Unilever ~6–8% Pond's, Dermalogica, Paula's Choice Mass reach with acquired clinical brands
Beiersdorf AG ~5–7% Eucerin, Nivea Luminous, La Prairie Dermocosmetic credibility and clinical claims
Shiseido Company ~4–6% Ultimune, Clé de Peau serums Japanese prestige and diagnostic platforms
Procter & Gamble ~4–6% Olay Regenerist, SK-II Essence Mass-prestige bridge with heavy media investment
Amorepacific Corporation ~3–5% Sulwhasoo, Laneige ampoules Ampoule format innovation and export engine
LVMH Beauty ~2–4% Dior Capture, Guerlain Abeille Royale Luxury ritual positioning and gifting
Kenvue Inc. ~2–4% Neutrogena, Aveeno serums Pharmacy trust and dermatologist endorsement
Natura &Co ~2–3% Chronos, Avon Anew Direct-selling scale in Latin America
Clarins Group ~1–3% Double Serum franchise Single-franchise depth and spa channel
Coty Inc. ~1–2% Lancaster, philosophy Travel retail and licensed brand leverage


Recent News & Developments

  • U.S. Food and Drug Administration (July 2024): Facility registration and product listing obligations took full effect, raising documentation costs and consolidating contract manufacturing around larger, audited sites [1]
  • L'Oréal (June 2024): Completed acquisition of a controlling stake in a Swiss dermatological skincare brand, deepening its clinical serum portfolio [3]
  • Estée Lauder (February 2024): Announced a multi-year profit recovery programme redirecting spend toward high-margin serum and essence franchises [19]
  • Amorepacific (September 2023): Acquired a majority stake in a U.S. clean-beauty brand to widen North American serum distribution [16]
  • European Commission (March 2024): Advanced the Green Claims Directive through trilogue, tightening substantiation requirements for cosmetic performance statements [2]
  • Shiseido (April 2025): Expanded its Osaka innovation centre with dedicated capacity for encapsulated active development [16]
  • Beiersdorf (November 2024): Reported double-digit organic growth in its dermocosmetic division, led by concentration-forward serum launches [9]
  • Saudi Arabia Ministry of Investment (January 2025): Confirmed additional retail and beauty-format commitments under the Vision 2030 tourism programme [6]

Facial Serum Market Report Scope

Parameter Detail
Market Scope Global Facial Serum Market by functionality, form, price point, distribution channel and geography
Study Period 2021–2035 (Historical 2021–2024; Base Year 2025; Forecast 2026–2035)
CAGR 8.0% (2026–2035)
Market Size Checkpoints USD 6.75 Billion (2025); USD 7.29 Billion (2026); USD 9.92 Billion (2030); USD 14.58 Billion (2035)
Fastest Growing Segments Premium/Luxury (9.7% CAGR); Online Retail Stores (9.8% CAGR); Middle East & Africa (9.3% CAGR)
Companies Profiled 12 major manufacturers and brand groups
Valuation Currency USD Billion, constant 2025 exchange rates

FAQs

What contract manufacturing capacity constraints should buyers entering the Facial Serum Market anticipate?
Encapsulation-capable fill lines remain scarce outside South Korea, Italy and New Jersey. Lead times for qualified slots run six to nine months, so brands planning launches should secure capacity before finalizing formulations [12].
How should procurement teams evaluate an active ingredient supplier's stability data?
Request accelerated stability at 40°C alongside real-time twelve-month data, plus batch-level certificates of analysis. Suppliers unwilling to share degradation curves for light-sensitive actives are usually masking formulation limitations [12].
Do private-label serums threaten branded margins in the Facial Serum Market?
Yes, but selectively. Retailer private label competes hardest in single-active hydrating formats where differentiation is minimal, while multi-active and clinically substantiated products retain pricing power [7].
What patent exposure exists around encapsulation technology?
Core liposomal and cyclodextrin patents from the 2000s have largely lapsed, but newer polymer-shell and time-release claims remain enforceable into the 2030s. Freedom-to-operate reviews are essential before commercializing delivery-system claims [3].
Which certifications matter most for exporting into the Facial Serum Market in Gulf states?
GSO conformity marking is mandatory, and halal certification has become commercially decisive even where not legally required. Arabic labelling with local importer details is enforced at customs [6].
How do clinics differ from retail as a serum channel?
Clinics buy smaller volumes at higher unit prices and expect professional-strength differentiation from retail SKUs. Physician dispensing also transfers liability expectations, requiring stronger adverse-event documentation [9].
What integration challenges arise when adding serums to an existing cream-led portfolio?
Serums demand different filling equipment, tighter oxygen control and separate stability protocols. Brands frequently underestimate packaging qualification, which alone can add three months to launch timelines [1].    
Author
Author
Author Profile
Sakshi Gupta LinkedIn
Team Lead - Research
Currently a Team Lead in consumer goods, FMCG, and F&B, she translates rigorous research into decisive strategy. She develops GTM roadmaps, pricing architectures, and competitive benchmarks for companies across Europe, the US, and APAC. She synthesize insights, align cross-functional teams, and drive execution from brief to measurable outcomes. She leads end-to-end engagements with crisp analysis, compelling storytelling, and a strong command of Power BI, Tableau, SQL, and advanced research platforms.
Share::
Request Free Sample

Research Approach


Secondary Research

The secondary research process involved comprehensive analysis of regulatory databases, peer-reviewed cosmetic science journals, dermatology publications, and authoritative consumer health organizations. Key sources included the US Food & Drug Administration (FDA) Center for Food Safety and Applied Nutrition (CFSAN), European Commission Directorate-General for Internal Market, Industry, Entrepreneurship and SMEs (DG GROWTH), Cosmetics Europe – The Personal Care Association, Personal Care Products Council (PCPC), International Fragrance Association (IFRA), National Institutes of Health (NIH) PubMed Central, NCBI/PubMed (cosmetic dermatology journals), World Health Organization (WHO) Chemical Risk Assessment, US Environmental Protection Agency (EPA) Safer Choice Program, EU CosIng Database (Cosmetic Ingredients), European Medicines Agency (EMA) for cosmeceutical regulations, US Federal Trade Commission (FTC) advertising guidelines, International Cooperation on Cosmetics Regulation (ICCR), Society of Cosmetic Chemists (SCC), International Federation of Societies of Cosmetic Chemists (IFSCC), National Bureau of Statistics of China, Eurostat Consumer Goods Statistics, US Bureau of Labor Statistics Consumer Expenditure Surveys, and trade association reports from India's Cosmetics & Personal Care Industry Association. These sources were used to collect formulation trends, regulatory compliance data, clinical efficacy studies, consumer behavior analytics, demographic trends, and competitive landscape analysis for vitamin C serums, hyaluronic acid formulations, retinol products, peptide-based serums, botanical actives, and emerging fermented ingredient technologies.


Primary Research

In order to gather both qualitative and quantitative insights, supply-side and demand-side stakeholders were interviewed during the primary research process. CEOs, Chief Marketing Officers, VPs of R&D, Heads of Product Innovation, Regulatory Affairs Directors, and Supply Chain Directors from producers of face serums, cosmetic OEMs/ODMs, and ingredient suppliers were examples of supply-side sources. Board-certified dermatologists, cosmetic chemists, estheticians, medical spa directors, retail beauty buyers, e-commerce category managers, and procurement leads from department stores, pharmacy chains, specialized beauty shops, and direct-to-consumer companies were among the demand-side sources. Primary research confirmed product pipeline timelines for innovative delivery systems (encapsulation, liposomal technology), validated market segmentation across anti-aging, brightening, hydrating, and acne-fighting serums, and gathered information on clinical adoption patterns, pricing strategies, clean beauty certification dynamics, and influencer marketing ROI.

Primary Respondent Breakdown:

By Designation: C-level Primaries (28%), Director Level (33%), Others (39%)

By Region: North America (32%), Europe (30%), Asia-Pacific (28%), Rest of World (10%)


Market Size Estimation

Global market valuation was derived through revenue mapping and consumption volume analysis. The methodology included:

Identification of 50+ key manufacturers across North America, Europe, Asia-Pacific, and Latin America including L'Oréal S.A., Estée Lauder Companies Inc., Shiseido Company Limited, Procter & Gamble Co., Beiersdorf AG, Johnson & Johnson, Amorepacific Corporation, Unilever PLC, Coty Inc., and emerging indie brands

Product mapping across anti-aging serums, skin brightening serums, hydrating serums, acne-fighting serums, exfoliating serums, and multifunctional hybrids

Ingredient-specific analysis of hyaluronic acid, vitamin C (L-ascorbic acid and derivatives), retinol, peptides, niacinamide, alpha hydroxy acids (AHAs), bakuchiol, botanical extracts, and fermented actives

Analysis of reported and modeled annual revenues specific to facial serum portfolios and active ingredient categories

Coverage of manufacturers representing 75-80% of global market share in 2024

Extrapolation using bottom-up (consumer spending patterns × ASP by country/retail channel) and top-down (manufacturer revenue validation and retail audit data) approaches to derive segment-specific valuations including water-based, oil-based, gel-based, and emulsion formulations

Share::
Request Free Sample
Download Free Sample

Kindly complete the form below to receive a free sample of this Report

* Please use a valid business email

Share::
Request Free Sample
Download PDF ×

We do not share your information with anyone. However, we may send you emails based on your report interest from time to time. You may contact us at any time to opt-out.
















