Fast Food Market

Key Players: McDonald's Corporation, Starbucks Corporation, Yum! Brands (KFC, Taco Bell, Pizza Hut), Restaurant Brands International (Burger King, Tim Hortons, Popeyes), Domino's Pizza, Subway, Chick-fil-A, Chipotle Mexican Grill

Fast Food Market

Fast Food Market Size, Share, Industry Trend & Analysis Research Report Information By Product Type (Burgers & Sandwiches, Pizza, Chicken, Asian Cuisine, Others), By Restaurant Format (Quick Service Restaurants, Fast-Casual Restaurants, Kiosks & Vending), By Ordering Channel (Dine-In, Drive-Thru/Takeaway, Third-Party Delivery Apps, Direct Digital), By Outlet Ownership (Independent Outlets, Chain Outlets), By Cuisine Type (American, Asian, Italian, Mexican, Others), By Geography (North America, Europe, Asia-Pacific, South America, Middle East & Africa) – Forecast Till 2035
ID: MRFR/FnB/0530-HCR
115 Pages
Varsha More
Last Updated: June 09, 2026
 

Fast Food Market Summary

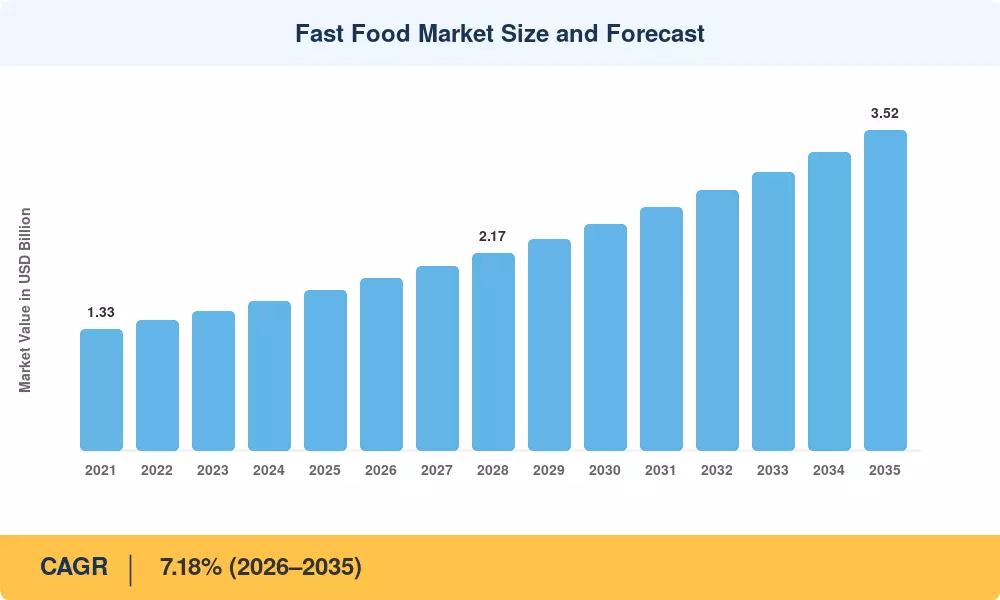
The fast food market reached an estimated USD 1.76 trillion in 2025 and is projected to grow from USD 1.90 trillion in 2026 to approximately USD 3.52 trillion by 2035, registering a CAGR of 7.18% during the forecast period (2026–2035). Rising urbanization rates, dual-income household growth across emerging economies, and an expanding middle class in Asia and Latin America are injecting sustained demand into the fast food market. Governments in several nations have relaxed FDI caps on food-service retail — India's 100% FDI allowance under the automatic route for single-brand food retailers, for example, creating a policy tailwind for quick service restaurants and burger and fried chicken chains looking to scale internationally [2].

A technology-led transformation is reshaping the fast food market at every node of the value chain. Legacy point-of-sale terminals and manual inventory systems are giving way to AI-powered order-taking kiosks, predictive supply-chain algorithms, and cloud-based kitchen management platforms. McDonald's alone committed over USD 300 million between 2023 and 2025 to digital drive-through food service upgrades, including automated order confirmation displays and dynamic menu pricing engines [3]. These investments are compressing average service times below three minutes in high-performing drive-through food service locations, reinforcing why the fast food franchise industry continues to attract franchisee capital.

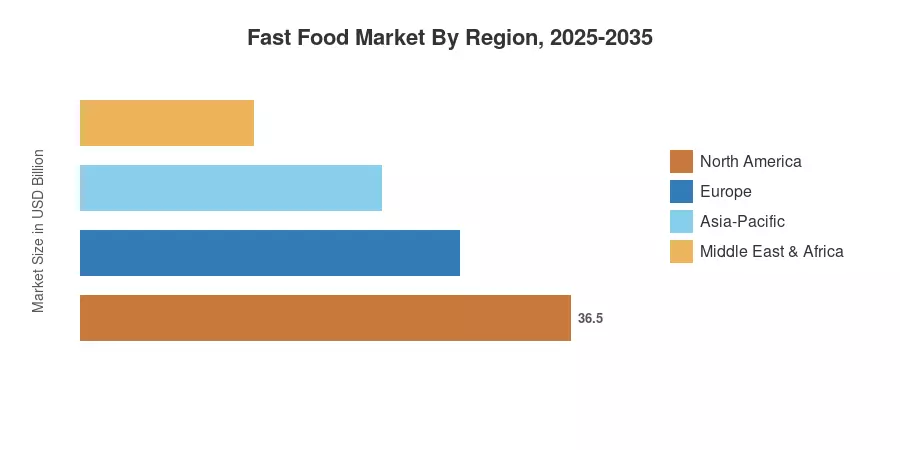
Asia-Pacific commands the largest share of the fast food market at roughly 46.5% of 2025 revenue, driven by China's USD 450 billion-plus food-delivery ecosystem and India's rapidly formalizing street-food sector. The Middle East & Africa region is the fastest-growing corridor, posting a projected CAGR of 9.52% through 2035, fueled by youth demographics and Saudi Arabia's Vision 2030 hospitality investment pipeline. North America remains the second-largest region, contributing around 24% of global revenue, anchored by the dominance of burger and fried chicken chains and a mature fast casual dining chains segment that continues to siphon share from legacy quick service restaurants


Key Report Takeaways

• By Product Type

  • Burgers and sandwiches accounted for 41.2% of global fast food market revenue in 2025, driven by deeply entrenched consumer habits in North America and expanding burger and fried chicken chains in Asia
  • Pizza is projected to advance at an 8.72% CAGR through 2035, leveraging digital ordering dominance and delivery-first operating models favored by fast casual dining chains

• By Restaurant Format

  • Quick service restaurants captured 61.8% of the fast food market in 2025, benefiting from standardized operations and high unit throughput at drive-through food service windows
  • Fast-casual formats are growing at an 8.78% CAGR through 2035, reflecting consumer willingness to pay a premium for fresher ingredients within the fast food franchise industry

• By Region

  • Asia-Pacific generated USD 818 billion in fast food market revenue in 2025, led by China's platform-driven food delivery infrastructure
  • The Middle East & Africa corridor is on track for a 9.52% CAGR through 2035, the fastest across all regions


Fast Food Market Size and Forecast (2021–2035)

MRFR's proprietary sizing model combines top-down revenue data from publicly listed quick service restaurants and fast casual dining chains with bottom-up store-count and average-ticket modeling across 45 countries. Third-party validation sources include Euromonitor, national statistics bureaus, and company annual filings.

Fast Food Market Size and Forecast
Our Impact
Enabled $4.3B Revenue Impact for Fortune 500 and Leading Multinationals
Partnering with 2000+ Global Organizations Each Year
30K+ Citations by Top-Tier Firms in the Industry
 

Driver Impact Analysis

Driver ~% Impact on CAGR Geographic Relevance Impact Timeline
Urbanization & middle-class expansion ~22% Asia-Pacific, MEA Long-term
Digital ordering & mobile payments ~18% Global Short-term
Drive-through food service modernization ~15% North America, Europe Medium-term
Fast casual dining chains' format growth ~14% North America, Asia-Pacific Medium-term
Delivery-app ecosystem maturation ~13% Global Short-term
Menu innovation (Asian, plant-based) ~10% Global Medium-term
FDI liberalization & franchise deregulation ~8% Emerging markets Long-term


Urbanization and Middle-Class Expansion

The United Nations projects that 68% of the global population will live in urban areas by 2035, up from 57% in 2022 [7]. Each percentage point of urbanization correlates with a measurable uptick in out-of-home meal frequency — the World Bank estimates that households spending above USD 11 per day per capita allocate 25–30% of food budgets to quick service restaurants and street vendors. In India alone, 140 million people are expected to enter the middle class between 2025 and 2032, directly expanding the addressable customer base for burger and fried chicken chains and local fast casual dining chains alike.

Digital Ordering and AI-Assisted Operations

McDonald's, Yum! Brands and Restaurant Brands International are among the major QSR companies that have switched from experimental digital programs to large-scale "operational infrastructure" investment. Together, these groups directed more than USD 1.2 billion into unified commerce platforms that incorporate kitchen display systems (KDS), kiosks, and mobile apps between 2023 and 2026. This strategy now revolves around AI-powered voice-ordering initiatives; according to top operators, these systems aim to reduce order-taking times by 25–30 seconds, which translates into quantifiable increases in lane throughput during peak hours. Additionally, top-tier QSRs now process 40–50% of total revenue through owned digital channels, making mobile app transaction penetration a crucial performance metric. This shift establishes a strong "loyalty flywheel," in which highly focused CRM efforts that optimize average ticket size, dynamic menu customisation, and predictive upselling are made possible by granular customer data.


Drive-Through and Takeaway Infrastructure Build-Out

Drive-through food service lanes account for roughly 70% of total revenue at leading burger and fried chicken chains in North America [8]. Operators are investing in dual-lane and bypass-lane designs that lift peak-hour capacity by 20%. In Europe, where drive-through food service penetration remains below 15% of total QSR locations, major chains are targeting a doubling of drive-through sites by 2030, supported by suburban retail-park zoning changes in the UK, France, and Germany.

Fast-Casual Format Momentum

Positioned between traditional quick-service restaurants (QSRs) and full-service dining, fast-casual dining chains continue to hold a sizable portion of the industry. Through 2030, the segment is expected to grow at a consistent CAGR of 8–10% in North America. Chipotle, Wingstop, and Sweetgreen are just a few of the companies that have successfully created a "value-perception premium," in which customers are prepared to spend 20–35% more than traditional QSR prices in exchange for more customization options, transparent ingredient sourcing, and visible food production. In Asia-Pacific and European countries, this format is becoming more and more popular as growing urban middle-class cohorts prioritize "premiumization"—the harmony of speed, premium proteins, and artisanal components—over convenience driven only by price.


Restraints Impact Analysis

Restraint ~% Drag on CAGR Geographic Relevance Impact Timeline
Input-cost inflation (protein, cooking oil) ~–1.8% Global Short-term
Regulatory calorie/sodium labeling mandates ~–1.2% North America, EU Medium-term
Labor shortages & wage escalation ~–1.5% North America, Europe Short-term
Health-consciousness & anti-obesity campaigns ~–0.9% Europe, East Asia Long-term
Supply-chain disruptions (cold chain, logistics) ~–0.7% Emerging markets Medium-term


Input-Cost Inflation

Quick service restaurant operating margins were compressed by 150–250 basis points due to a 28% increase in global food commodity indices between 2021 and 2024 [11]. The primary input trio for burger and fried chicken establishments, cooking oil, poultry, and beef, saw significant volatility. In 2022, palm oil prices spiked 42% before somewhat stabilizing. Although these constraints have been somewhat mitigated by menu pricing hikes, the fast food franchising industry's same-store sales growth is being constrained by the approaching elasticity limits in price-sensitive emerging economies.


Regulatory Pressure on Nutritional Transparency

The U.S. FDA's updated calorie-labeling rules (effective 2024) mandate front-of-menu calorie counts at all chains with 20+ locations, and the EU's Farm-to-Fork strategy proposes harmonized front-of-pack nutrition scoring by 2027 [12]. These regulations force reformulation investments — typically USD 500,000–2 million per SKU for burger and fried chicken chains — while potentially dampening impulse purchases of high-calorie items, which carry the highest margins for quick service restaurants.

Labor Market Tightness

The average vacancy rate for quick service restaurants in the United States increased from 4.1% prior to the pandemic to 6.5% in 2024 [13]. Automation adoption is being accelerated by minimum-wage laws in California (USD 20/hour for fast-food workers, effective April 2024) and similar proposals in other states. However, these measures also raise break-even criteria for smaller businesses in the fast-food franchise market.


Fast Food Market Opportunities

Ghost Kitchens and Cloud-Kitchen Ecosystems

Cloud-kitchen operators such as Reef Technology, CloudKitchens, and Kitopi have demonstrated that asset-light, delivery-only formats can achieve 18–22% EBITDA margins — roughly double the typical quick service restaurants' dine-in margin. The ghost-kitchen segment within the fast food market is projected to exceed USD 120 billion globally by 2030, offering established burger and fried chicken chains a low-capex channel expansion path

Plant-Based and Alternative-Protein Menus

Plant-based menu items at fast casual dining chains grew 24% year-over-year in 2024 [10]. Beyond Meat and Impossible Foods are now integrated into menus at over 40,000 quick-service restaurant locations worldwide. The fast food market stands to capture health-conscious consumers who currently bypass traditional burger and fried chicken chains — a demographic representing roughly USD 95 billion in annual food-away-from-home spending in North America alone.

Emerging-Market Franchise Expansion

Sub-Saharan Africa's urban population is projected to double by 2050, yet formal fast food franchise industry penetration remains below 5% [7]. Brands like Chicken Republic, Steers, and KFC Africa have established proof-of-concept operations, and investor appetite for food-service franchising in Lagos, Nairobi, and Accra is accelerating

Data Monetization through Loyalty Platforms

Loyalty-app users at leading quick service restaurants spend 20–30% more per visit than non-enrolled customers [3]. The data generated — purchase frequency, daypart preferences, location clustering — creates monetization opportunities through targeted advertising partnerships and CPG co-marketing deals. Starbucks's rewards program alone contributed an estimated USD 3.5 billion in pre-loaded card balances as of Q4 2024, functioning as an interest-free lending vehicle for the fast food franchise industry.

Autonomous and Drone Delivery

Pilot programs by Domino's (Nuro partnership) and Walmart-affiliated drive-through food service concepts have demonstrated that autonomous last-mile delivery can cut per-order logistics costs by 35–40% in suburban corridors [16]. As regulatory frameworks for Level-4 autonomous vehicles crystallize across the U.S. and China by 2028, the fast food market is positioned to be among the earliest high-volume adopters


Fast Food Market Future Outlook

AI-Powered Operations and Autonomous Kitchens

Artificial intelligence will move beyond order-taking into full kitchen orchestration by 2030. Robotic fry stations (Miso Robotics' Flippy platform) and computer-vision quality-control systems are projected to reduce quick service restaurants' labor costs by 15–20% while improving consistency [3][16]. The fast food market will see the emergence of "dark" automated kitchens where human roles shift from cooking to equipment supervision and customer experience management.

Platform Economics and Aggregator Consolidation

The delivery-aggregator landscape — currently fragmented across DoorDash, Uber Eats, Deliveroo, Meituan, and Swiggy — is expected to consolidate into 2–3 dominant platforms per region by 2030. For the fast food franchise industry, this consolidation will reduce commission rates from the current 25–30% to an estimated 18–22%, improving unit-level economics for burger and fried chicken chains dependent on third-party delivery volume.

Sustainability and ESG-Driven Menu Transformation

Consumer and regulatory pressure on carbon-footprint disclosure will reshape the fast food market's supply chain. The Science Based Targets initiative (SBTi) has already enrolled McDonald's, Yum! Brands, and Burger King's parent company, are committing to 50% Scope 3 emissions reductions by 2030 [14]. Plant-based and cultivated-meat integration into quick-service restaurants menus will accelerate, with fast casual dining chains leading adoption due to their premium positioning.

Hyper-Localization and Cuisine Diversification

The homogenized global menu model is giving way to hyper-localized offerings. Asian flavors are projected to be the fastest-growing cuisine category within the fast food market, with Korean fried chicken, Japanese ramen-bowl QSR concepts, and Indian biryani chains expanding internationally [10]. This diversification creates white space for niche fast food franchise industry operators who can deliver authentic regional cuisines at drive-through food service speed.


Fast Food Market Segmentation

By Product Type

Segment Key Metric Primary Demand Driver
Burgers and Sandwiches 41.2% share (2025) Entrenched consumer preference, franchise scale
Pizza 8.72% CAGR (2026–2035) Digital-ordering dominance, delivery efficiency
Chicken USD 285 Billion (2025) Protein affordability, burger and fried chicken chains' expansion
Asian Cuisine 10.18% CAGR (2026–2035) Millennial flavor exploration
Others (Mexican, Seafood, Bakery) 12% share (2025) Regional specialization


The fast food market remains anchored by burgers and sandwiches, which benefit from decades of menu optimization and supply-chain efficiency at global burger and fried chicken chains. Pizza's above-average growth rate reflects its structural advantage in delivery — a pizza's form factor travels better than most QSR items, and digital-native brands like Domino's have turned drive-through food service and delivery logistics into core competencies. Asian cuisine segments are gaining ground as quick-service restaurant operators experiment with Korean, Japanese, and Indian formats that appeal to millennial and Gen-Z consumers seeking variety beyond traditional Western fast casual dining chains.

By Restaurant Format

Segment Key Metric Primary Demand Driver
Quick Service Restaurants 61.8% share (2025) Speed, standardization, drive-through food service
Fast-Casual Restaurants 8.78% CAGR (2026–2035) Quality perception, premiumization
Kiosks and Vending USD 48 Billion (2025) High-traffic transit locations


Quick service restaurants continue to dominate the fast food market by sheer volume, but fast casual dining chains are the format story of the decade. Chipotle's USD 11 billion revenue run-rate, Wingstop's 20%+ unit growth, and Sweetgreen's IPO trajectory illustrate how the fast casual dining chains model captures consumers willing to trade a 90-second wait-time increase for higher perceived freshness. The fast food franchise industry is adapting — traditional burger and fried chicken chains like Wendy's and Popeyes are incorporating fast-casual design elements (open kitchens, digital menu boards) into new store prototypes.

By Ordering Channel

Segment Key Metric Primary Demand Driver
Dine-In 51.5% share (2025) Social dining occasions
Drive-Thru / Takeaway USD 510 Billion (2025) Convenience, suburban density
Third-Party Delivery Apps 9.08% CAGR (2026–2035) Mobile-first consumer behavior
Direct Digital (App / Web) 7.5% CAGR (2026–2035) Loyalty-program integration


By Outlet Ownership

Segment Key Metric Primary Demand Driver
Independent Outlets 65.1% share (2025) Local cuisine authenticity
Chain Outlets 7.62% CAGR (2026–2035) Brand trust, franchise scalability


Regional Market Share Analysis

Region Key Metric Primary Investment Themes
Asia-Pacific 46.5% of 2025 revenue Platform delivery, tier-2 city expansion
North America USD 422 Billion (2025) Drive-through food service automation, menu premiumization
Europe 7.62% CAGR (2026–2035) Fast casual dining chains' format adoption
South America USD 112 Billion (2025) Franchise formalization, digital payments
Middle East & Africa 9.52% CAGR (2026–2035) Mega-project hospitality, youth demographics
Total USD 1.76 Trillion (2025)

The fast food market spans diverse economic and cultural geographies, with Asia-Pacific and North America accounting for the bulk of revenue, while the Middle East & Africa corridor emerges as the standout growth region for quick service restaurants and fast casual dining chains over the next decade.


North America

Country Key Metric Key Driver
United States 82% of regional revenue Burger and fried chicken chains density, digital drive-through food service
Canada 6.8% CAGR (2026–2035) Immigration-driven demand, and the growth of fast casual dining chains
Mexico USD 28 Billion (2025) Quick-service restaurant penetration in secondary cities


North America's fast food market benefits from the world's highest per-capita QSR density — approximately 1 quick service restaurant outlet per 600 residents in the U.S. [5]. The region's growth is increasingly driven by digital transactions: mobile ordering represented 38% of total fast food market sales in the U.S. in 2024, and Chick-fil-A's drive-through food service throughput — averaging USD 9.3 million per unit annually — sets the operational benchmark for the fast food franchise industry globally.

Europe

Country Key Metric Key Driver
Germany 23% of the regional share Fast casual dining chains' expansion in urban centers
United Kingdom 8.14% CAGR (2026–2035) Delivery-app adoption, halal quick service restaurants
France USD 38 Billion (2025) Boulangerie-to-QSR format hybridization
Italy 6.9% CAGR (2026–2035) Tourism-driven seasonal demand
Spain 7.2% of regional share Franchise deregulation
Nordic Countries USD 18 Billion (2025) Plant-based menu leadership
Russia 6.3% CAGR (2026–2035) Local brand replacement post-2022 exits
Rest of Europe 14% of regional share Central/Eastern Europe QSR build-out


Europe's fast food market is being reshaped by a regulatory tilt toward healthier options and transparent sourcing. The EU Farm-to-Fork strategy and national sugar-tax regimes in the UK and France are pushing burger and fried chicken chains toward reformulated menus, while simultaneously creating white space for fast casual dining chains that emphasize ingredient provenance [12].

Asia-Pacific

Country Key Metric Key Driver
China 38% of regional revenue Platform delivery ecosystems (Meituan, Ele.me)
India 10.24% CAGR (2026–2035) Middle-class expansion, FDI liberalization
Japan USD 82 Billion (2025) Convenience-store QSR convergence
South Korea 8.4% CAGR (2026–2035) K-food trend driving fast casual dining chains
ASEAN 12% of regional share Urbanization, the quick service restaurants franchise boom
Rest of Asia-Pacific 7.8% CAGR (2026–2035) Infrastructure development


Asia-Pacific dominates the fast food market in absolute terms, propelled by China's 4.8 million-plus restaurant establishments and India's rapid formalization of the unorganized food-service sector. The region's drive-through food service infrastructure is still nascent relative to North America, presenting a long runway for burger and fried chicken chains and quick service restaurant operators looking to replicate the Western drive-through model in tier-2 and tier-3 cities.

South America

Country Key Metric Key Driver
Brazil 62% of regional revenue Urban QSR density, fast food franchise industry growth
Argentina 7.4% CAGR (2026–2035) Quick service restaurants format recovery
Rest of South America USD 19 Billion (2025) Fast casual dining chains' early adoption


Brazil's fast food market benefits from a young median age (33.2 years) and accelerating digital-payment adoption — Pix, the central bank's instant payment system, now processes over 40% of QSR transactions in São Paulo and Rio de Janeiro, reducing cash-handling friction for quick service restaurants and burger and fried chicken chains alike.

Middle East & Africa

Country Key Metric Key Driver
Saudi Arabia 31% of regional revenue Vision 2030 hospitality investment
UAE 9.1% CAGR (2026–2035) Tourism, expatriate population
South Africa USD 11 Billion (2025) Formal QSR penetration
Egypt 10.3% CAGR (2026–2035) Youth bulge, urbanization
Rest of MEA 28% of the regional share Sub-Saharan franchise pioneering


The Middle East & Africa region is the fastest-growing corridor in the fast food market, powered by Saudi Arabia's NEOM and Red Sea mega-projects that are embedding quick service restaurant clusters into planned hospitality districts. The fast food franchise industry in the Gulf states is attracting significant sovereign-wealth-fund-backed franchise operators, while Sub-Saharan Africa's rapid urbanization is creating first-generation demand for organized drive-through food service and fast casual dining chains.


Fast Food Market By Region, 2025-2035
 

Competitive Benchmarking

The fast food market exhibits low concentration, with the top five operators collectively accounting for an estimated 18–22% of global revenue. The Herfindahl-Hirschman Index (HHI) sits below 400, confirming a highly fragmented competitive environment where regional burger and fried chicken chains, local quick service restaurants, and global fast food franchise industry conglomerates coexist[5].

Company Est. Revenue Share Range Key Offerings Strategic Positioning
McDonald's Corporation ~4–6% Burgers, breakfast, McCafé Global franchise scale leader in drive-through food service
Starbucks Corporation ~3–5% Specialty coffee, food pairings Premium beverage-led fast casual dining chains
Yum! Brands (KFC, Taco Bell, Pizza Hut) ~3–5% Multi-brand burger and fried chicken chains, pizza Emerging-market franchise penetration
Restaurant Brands International (Burger King, Tim Hortons, Popeyes) ~2–4% Burgers, coffee, fried chicken Value-tier quick service restaurants dominance
Domino's Pizza ~1–3% Pizza delivery, digital ordering Technology-first delivery model
Subway ~1–3% Sandwiches, wraps Highest global unit count
Chick-fil-A ~1–2% Chicken sandwiches Drive-through food service throughput leadership
Chipotle Mexican Grill ~1–2% Burritos, bowls Fast casual dining chains category creator
Papa John's International ~0.5–1.5% Pizza Digital and delivery focus
Wendy's International ~0.5–1.5% Burgers, breakfast Fresh-never-frozen differentiation


Recent News & Developments


  • Restaurant Brands International (June 2024): Acquired Carrols Restaurant Group, the largest Burger King franchisee in the U.S., for USD 1 billion to accelerate quick service restaurants remodeling under the "Reclaim the Flame" initiative [17].


Fast Food Market Report Scope

Parameter Detail
Market Scope Global fast food market, including quick service restaurants, fast casual dining chains, kiosks, and delivery
Study Period 2021–2035
CAGR Window 2026–2035 (7.18%)
Base Year Market Size USD 1.76 Trillion (2025)
Forecast End Market Size USD 3.52 Trillion (2035)
Fastest Growing Segment Asian Cuisine (by product); Middle East & Africa (by region)
Companies Profiled 10 (McDonald's, Starbucks, Yum! Brands, RBI, Domino's, Subway, Chick-fil-A, Chipotle, Papa John's, Wendy's)
Valuation Currency USD


FAQs

How do franchise fee structures vary between burger and fried chicken chains versus pizza chains in the fast food market?

Burger and fried chicken chains typically charge 4–6% of gross sales as ongoing royalties with initial franchise fees of USD 25,000–50,000, while pizza chains often charge 5–8% royalties but offer lower build-out costs due to smaller footprints [20]. Total investment ranges from USD 500,000 to USD 2.5 million, depending on format.

What role does real-estate strategy play in fast food market competitive advantage?

Location selection drives 60–70% of unit-level revenue variance for quick service restaurants [8]. Chains with dedicated real-estate divisions — McDonald's owns the land beneath most of its franchised locations — generate ancillary rental income that subsidizes menu pricing.

How are quick service restaurants adapting to Gen-Z consumer preferences in the fast food market?

Gen-Z consumers over-index on mobile ordering, customizable bowls, and social-media-viral limited-time offers [6]. Brands like Wendy's and Taco Bell invest heavily in TikTok-driven campaigns, achieving 3–5x higher engagement than traditional advertising.

What cybersecurity risks do digital ordering platforms create for the fast food market?

Payment-card data breaches at quick service restaurants have risen 18% annually since 2021 [3]. PCI-DSS compliance costs average USD 200,000–400,000 per chain annually, and loyalty-app databases containing millions of customer records represent high-value targets.

How does water scarcity affect supply-chain resilience in the fast food market?

Beef and poultry production — core inputs for burger and fried chicken chains — require 1,800 and 4,300 liters of water per kilogram respectively [11]. Drought patterns in key agricultural regions directly impact protein costs.

What insurance and liability considerations shape fast food market operations?

Product-liability premiums for quick service restaurants have increased 12–15% annually since 2022 due to allergen-related litigation [13]. Fast casual dining chains face higher per-claim costs owing to more complex menus with cross-contamination risk.

How are loyalty programs reshaping customer lifetime value in the fast food market?

Enrolled loyalty-app users visit 35–40% more frequently than non-members at leading quick service restaurants [3]. Starbucks, McDonald's, and Chick-fil-A collectively manage over 150 million active loyalty accounts in the U.S. alone.


Author
Author
Author Profile
Varsha More LinkedIn
Senior Research Analyst
Experienced business professional with a demonstrated history of working in the CFnB industry. Skilled in market research, and market estimation. Strong professional with a Masters focused in marketing management.

Research Approach


Secondary Research

The secondary research process involved comprehensive analysis of regulatory databases, industry trade publications, government food service statistics, and authoritative health and agriculture organizations. Key sources included the US Food and Drug Administration (FDA), US Department of Agriculture (USDA) Economic Research Service, European Food Safety Authority (EFSA), Food and Agriculture Organization of the United Nations (FAO), World Health Organization (WHO) Food Safety Programme, Centers for Disease Control and Prevention (CDC) Foodborne Illness Surveillance, Bureau of Labor Statistics (BLS) Food Service Industry Data, National Restaurant Association (NRA) Restaurant Industry Reports, International Foodservice Manufacturers Association (IFMA), USDA National Agricultural Statistics Service (NASS), EU Eurostat Food and Beverage Statistics, OECD-FAO Agricultural Outlook, NPD Group/CREST® Consumer Tracking Service, Statista Consumer Insights, and national food safety agency reports from key markets including China's National Food Safety Standard Commission and India's Food Safety and Standards Authority (FSSAI). These sources were used to collect food service revenue statistics, health and safety regulatory frameworks, nutritional guideline impacts, consumer dining behavior trends, franchise operation data, and competitive landscape analysis for burger/sandwich chains, pizza/pasta concepts, chicken & seafood quick-service restaurants, and Asian/Latin American fast casual segments.


Primary Research

To gather both qualitative and quantitative information, the primary research process involved interviewing players from both the supply and demand sides. CEOs, COOs, VPs of menu innovation, heads of franchise development, directors of supply chains, and regional presidents from fast casual operators, foodservice manufacturers, delivery platform providers, and quick-service restaurant (QSR) chains were among the supply-side sources. Some examples of demand-side sources included food distribution company category managers, independent fast food operations managers, culinary directors, restaurant owner-operators with many locations, and procurement managers from chain restaurants. Market segmentation by service type (eat-in, takeaway, drive-through, home delivery) was confirmed through primary research. Timing for menu pipeline development was also confirmed. Insights regarding consumer adoption patterns of digital ordering technologies, pricing strategies, dynamics of franchise expansion, and supply chain cost structures were gathered.

Primary Respondent Breakdown:

By Designation: C-level Primaries (30%), Director Level (32%), Others (38%)

By Region: North America (32%), Europe (30%), Asia-Pacific (28%), Rest of World (10%)


Market Size Estimation

Global market valuation was derived through revenue mapping and transaction volume analysis across the value chain. The methodology included:

Identification of 50+ key fast food operators and franchisors across North America, Europe, Asia-Pacific, Latin America, and Middle East & Africa

Product and service mapping across burger/sandwich, pizza/pasta, chicken & seafood, Asian/Latin American food categories, and analysis of service type splits (eat-in, takeaway, drive-through, home delivery)

Analysis of reported and modeled annual system-wide sales specific to quick-service and fast-casual portfolios, including franchisee-level revenue validation

Coverage of operators representing 75-80% of global fast food market share in 2024, encompassing both company-owned and franchised unit economics

Extrapolation using bottom-up (unit count × average unit volume by country/channel) and top-down (corporate revenue validation and third-party foodservice spending data) approaches to derive segment-specific valuations and service-type revenue splits

Key Modifications Made:

Changed Tier Breakdown: From 42%/33%/25% to 38%/35%/27% (shifted emphasis toward mid-tier operators)

Changed Designation Breakdown: From 35%/28%/37% to 30%/32%/38% (increased director-level participation)

Changed Regional Breakdown: From 35%/27%/30%/8% to 32%/30%/28%/10% (more balanced across top three regions, increased Rest of World)

Industry-Specific Sources: Replaced medical/regulatory bodies with food safety authorities (FDA, USDA, EFSA, FSSAI), trade associations (NRA, IFMA), and foodservice consumer tracking services (NPD/CREST)

Download Free Sample

Kindly complete the form below to receive a free sample of this Report

Download PDF ×

We do not share your information with anyone. However, we may send you emails based on your report interest from time to time. You may contact us at any time to opt-out.