Filter Integrity Test Market (2025 - 2035)

Filter Integrity Test Market Research Report Information By Method (Forward Flow, Bubble Point, Pressure Hold, Water Intrusion, and Others), By Mode (Automated and Manual), By End User (Biopharmaceutical & Pharmaceutical Industry, Food & Beverage Industry, and Others) And By Region (North America, Europe, Asia-Pacific, And Rest Of The World) - Growth & Industry Forecast 2025 To 2035
ID: MRFR/Pharma/19976-HCR
128 Pages
Nidhi Mandole, Rahul Gotadki
Last Updated: July 24, 2026
Filter Integrity Test Market
Market Size
Forecast Period2025-2035
CAGR (2025-2035)5.56%
2025 Market SizeUSD 90.12 Million
2035 Market SizeUSD 154.83 Million
Key Players
Sartorius AG
Merck KGaA
Pall Corporation
Parker Hannifin Corporation
Meissner Filtration Products
Eaton Corporation
Opportunities
  • Continuous Bioprocessing Integration
  • Cloud-Connected Quality Analytics Platforms
  • Emerging-Market CMO Capacity Expansion

Filter Integrity Test Market Summary

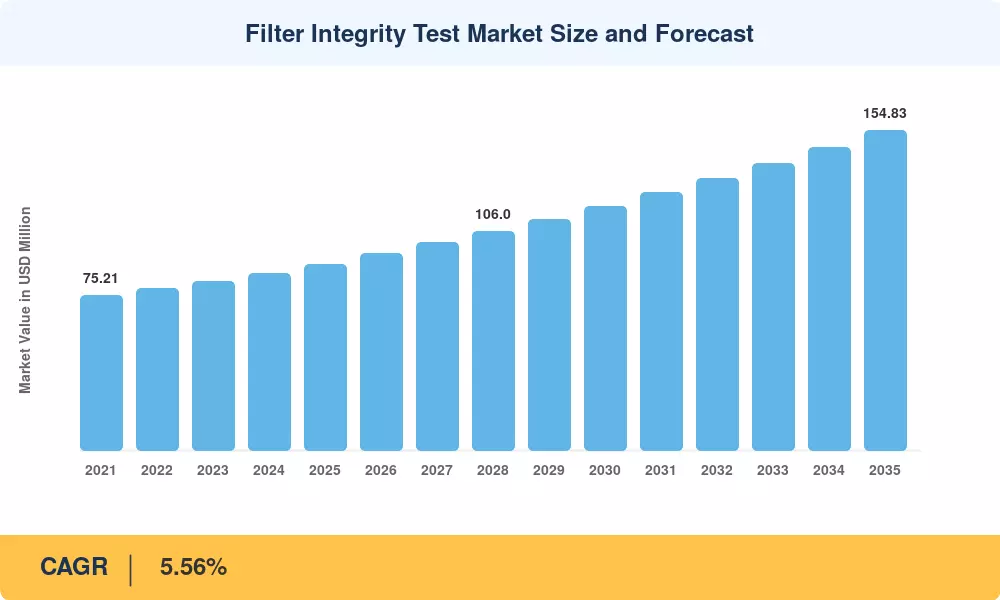
The Filter Integrity Test Market was valued at USD 90.12 million in 2025 and is projected to reach USD 154.83 million by 2035, expanding at a 5.56% CAGR during 2026–2035. Tightening regulatory oversight across sterile pharmaceutical manufacturing — particularly through updated FDA Guidance on Sterile Drug Products Produced by Aseptic Processing and the EU Annex 1 revision mandating enhanced contamination-control strategies — has turned filter integrity verification from a routine quality step into a critical compliance requirement. Biopharmaceutical capital expenditure surpassed USD 28 billion globally in 2024 [1], and a substantial portion of that investment flows directly into quality-control infrastructure, including testing platforms that validate membrane filters before and after each production batch.

Manufacturers are implementing a technology shift that is transforming the way they think about filter certification. Legacy manual test setups that relied on operator-dependent pressure readings and subjective pass/fail interpretation are being replaced by automated sensor-driven platforms that can generate tamper-proof electronic batch records. These systems reduce human error by over 60% (industry benchmarks [2]) and reduce batch-release timelines from hours to minutes. Simultaneously, acoustic-emission test technologies are getting popular due to their non-destructive and high-sensitive flaw identification, which enables the possibility of real-time in-line monitoring that was not possible with conventional pressure-decay methods.


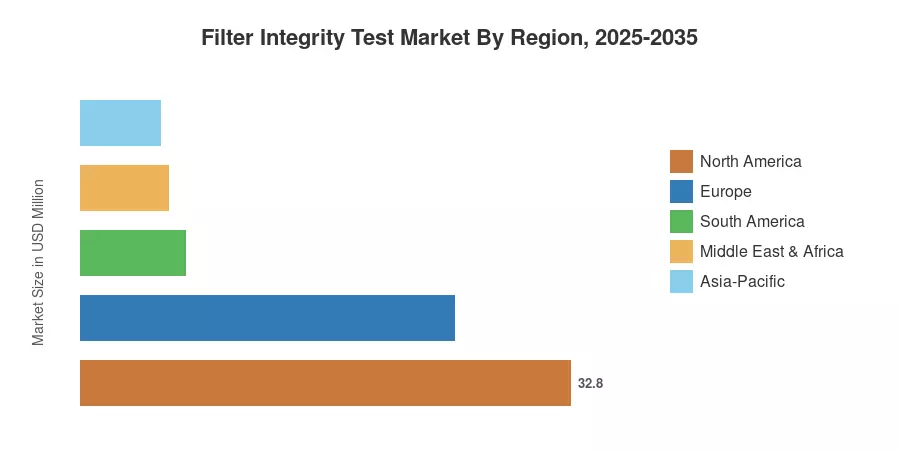
North America is the largest market (about 36.4% of 2025 sales) because of the presence of several FDA-regulated biologics makers and a well-established installed base of automated test platforms. The Asia-Pacific region is the fastest-growing region, with a CAGR of 5.96% through 2035 as bioprocess capacity is scaled up in China and India to support domestic and contract-manufacturing demand. Europe is the second biggest region with a share of approximately 27.8%. The strict EMA standards and a dense network of vaccine production facilities drive this. The Filter Integrity Test Market will move from a compliance-driven niche to a data-rich quality analytics layer within smart manufacturing ecosystems in the coming decade.


Key Report Takeaways

• By Product Type & Test Method

  • Automated filter integrity test systems accounted for roughly 53% of total revenue in 2025, reflecting the industry's decisive pivot away from manual configurations.
  • Bubble point testing held a 37.9% share of the Filter Integrity Test Market in 2025, remaining the most widely adopted test methodology across pharmaceutical sterile filtration.
  • Water intrusion testing is advancing at a 6.62% CAGR through 2035, gaining preference in applications where wetting agents are incompatible with conventional diffusion tests.

• By Mechanism & Filter Type

  • Pressure-based testing mechanisms commanded 57.4% of the Filter Integrity Test Market in 2025, though acoustic technologies are expanding at a 7.41% CAGR.
  • Liquid filters represented 63.2% of market demand in 2025, driven by widespread use in parenteral drug and biologics manufacturing.

• By Geography

  • North America retained leadership with a 36.4% share in 2025, while Asia-Pacific is forecast to record the highest regional growth rate through 2035.
  • Contract manufacturing organizations are posting the strongest end-user growth at a 7.95% CAGR, reflecting the outsourcing wave in advanced therapeutics production.


Filter Integrity Test Market Size and Forecast (2021–2035)

The market sizing is based on a bottom-up revenue study of filter integrity test equipment providers and top-down confirmation against pharmaceutical capital expenditure databases, regulatory file counts and bioprocessing facility build-out trackers. Historical figures (2021–2024) are derived from company disclosures and trade association data, and forecast projections utilize a calibrated compound growth model based on the expansion rates of biopharmaceutical production capacity.
Filter Integrity Test Market Size and Forecast
Our Impact
Enabled $4.3B Revenue Impact for Fortune 500 and Leading Multinationals
Partnering with 2000+ Global Organizations Each Year
30K+ Citations by Top-Tier Firms in the Industry

Driver Impact Analysis

Driver ~% Impact on CAGR Geographic Relevance Impact Timeline
Stringent EU Annex 1 & FDA aseptic processing guidelines ~18% Global Short-term (≤2 yr)
Cell- and gene-therapy facility build-outs ~16% North America, Europe Medium-term (2–4 yr)
Shift to single-use filtration assemblies ~14% Global Short-term (≤2 yr)
Adoption of automated electronic batch records ~13% North America, Europe Medium-term (2–4 yr)
Asia-Pacific bioprocess capacity expansion ~12% Asia-Pacific Medium-term (2–4 yr)
Acoustic-emission testing technology maturation ~10% Global Long-term (≥4 yr)
Data-integrity mandates (ALCOA+ frameworks) ~9% Global Long-term (≥4 yr)


Regulatory Tightening Across Sterile Manufacturing

The revised EU Annex 1, effective since August 2023, introduced explicit requirements for contamination-control strategies that place filter integrity verification at the center of aseptic process validation. Manufacturers operating under EMA jurisdiction now face mandatory pre- and post-use testing for every sterilizing-grade filter, a requirement that has doubled test volumes at several large-scale biologics facilities [5]. The FDA's parallel emphasis on process analytical technology (PAT) further reinforces demand, as regulators increasingly expect real-time, data-backed proof that filters perform within validated specifications throughout production runs.

Cell- and Gene-Therapy Manufacturing Expansion

Over 2,400 cell- and gene-therapy clinical trials were active globally as of late 2024, and the pipeline is translating into dedicated commercial manufacturing suites at an unprecedented rate [6]. These facilities handle low-volume, high-value products where a single contamination event can destroy millions of dollars in therapeutic material. Consequently, operators invest in redundant filter integrity verification protocols, often deploying automated test systems at multiple points along the fluid path — from media preparation through final fill.

Single-Use Filtration Assembly Proliferation

Single-use bioprocessing systems now account for more than 55% of new biomanufacturing installations globally [10], and each disposable filter capsule or cartridge requires its own pre-use integrity test. This structural shift has multiplied the number of individual tests performed per batch compared to traditional stainless-steel installations, where filters were validated once and reused across campaigns. The resulting test-volume uplift is a direct growth catalyst for the Filter Integrity Test Market, particularly for compact, portable automated testers designed specifically for single-use workflows.

Data-Integrity Compliance and Electronic Batch Records

ALCOA+ data-integrity principles — now embedded in FDA, EMA, and PIC/S inspection frameworks — require that every filter test result be attributable, legible, contemporaneous, original, and accurate [12]. Manual paper-based test records frequently fail these criteria during regulatory audits, pushing manufacturers toward automated systems that generate tamper-proof digital audit trails. Facilities that transitioned to electronic batch records reported a 40% reduction in documentation-related deviations within the first year of implementation.


Restraints Impact Analysis

Restraint ~% Negative Impact on CAGR Geographic Relevance Impact Timeline
High upfront capital cost of automated platforms ~−12% Emerging markets Short-term (≤2 yr)
Complexity of validating novel test technologies ~−10% Global Medium-term (2–4 yr)
Shortage of qualified validation engineers ~−8% Asia-Pacific, South America Medium-term (2–4 yr)
Regulatory fragmentation across jurisdictions ~−7% Global Long-term (≥4 yr)
Resistance to changing established SOPs ~−6% Europe, North America Short-term (≤2 yr)


Capital Cost Barriers in Emerging Markets

A fully configured automated filter integrity test platform carries a price tag of USD 35,000–80,000 depending on channel count and software capabilities [13]. For small and mid-sized pharmaceutical manufacturers in India, Southeast Asia, and Latin America — where annual quality-control budgets may total less than USD 500,000 — this investment represents a significant capital hurdle. Many of these facilities continue to rely on manual bubble-point testers, delaying the penetration of automated systems in precisely the regions where bioprocessing capacity is growing fastest.

Validation Complexity for Acoustic Technologies

While acoustic-emission testing offers compelling technical advantages, securing regulatory acceptance requires extensive method validation including comparability studies against established pressure-based approaches. The validation package for a new test methodology can take 12–18 months and cost upwards of USD 200,000 per product line [8]. This timeline slows commercial adoption even among large pharmaceutical companies that recognize the technology's long-term benefits for the Filter Integrity Test Market.

Qualified Personnel Shortages

The intersection of filtration science, regulatory affairs, and digital quality systems demands a specialized skill set that is in short supply globally. Industry surveys indicate that nearly 35% of biopharmaceutical quality managers cite difficulty in hiring validation engineers as a constraint on adopting advanced testing platforms [14]. This talent gap is especially acute in rapidly industrializing markets where bioprocess training programs have not kept pace with facility construction.


Filter Integrity Test Market Opportunities

Continuous Bioprocessing Integration

The pharmaceutical industry's migration toward continuous manufacturing creates an opportunity for inline filter integrity verification systems that operate without halting production flow. Companies that develop real-time test modules compatible with perfusion bioreactors and continuous chromatography trains stand to capture early-mover advantage in a segment that could represent 8–10% of the Filter Integrity Test Market by 2032.

Cloud-Connected Quality Analytics Platforms

Filter integrity test data — pressure curves, diffusion rates, pass/fail outcomes — remains largely siloed within individual facility databases. Aggregating this data into cloud-based analytics platforms would enable cross-site benchmarking, predictive maintenance scheduling, and real-time regulatory reporting. This data-monetization model creates recurring software revenue streams alongside traditional equipment sales.

Emerging-Market CMO Capacity Expansion

India's Bulk Drug Park initiative and China's 14th Five-Year Plan for bioeconomy development are catalyzing construction of contract manufacturing facilities that will require thousands of new filter integrity test installations over the next decade [11]. Equipment vendors that establish local service networks and calibration centers in these markets will secure durable competitive positions.

Acoustic Sensing for Advanced Therapy Medicinal Products

Advanced therapy medicinal products — including viral vectors and exosome-based therapeutics — use specialized filters with unique material properties that challenge conventional pressure-based test methods. Acoustic-emission testing, which detects micro-defects through ultrasonic wave analysis, offers higher sensitivity for these novel filter formats without the destructive wetting requirements of traditional approaches.

Regulatory Harmonization as a Market Catalyst

The International Council for Harmonisation (ICH) is progressing toward globally aligned sterile-manufacturing standards. If harmonized guidelines explicitly prescribe automated filter integrity verification, the resulting compliance requirement would unlock demand in markets where manual testing currently dominates — particularly across South America, the Middle East, and parts of Southeast Asia.


Filter Integrity Test Market Future Outlook

AI-Powered Predictive Quality Assurance

Machine-learning algorithms are beginning to analyze historical filter integrity test data to predict filter failure before it occurs, shifting the paradigm from reactive testing to predictive quality assurance. By correlating pressure-decay profiles with filter lot variations, raw-material changes, and environmental conditions, these systems can flag at-risk batches before they enter sterile filling — a capability that the FDA's Emerging Technology Program has recognized as consistent with its quality-by-design framework [19]. Widespread adoption could reduce batch rejection rates by 15–20% across the biologics sector by 2030.

Platform Economics and Testing-as-a-Service

The Filter Integrity Test Market is likely to see the emergence of testing-as-a-service models where equipment vendors shift from one-time capital sales to usage-based subscription pricing. This transition mirrors broader trends in bioprocessing where single-use consumables and managed-service contracts are replacing owned infrastructure. Companies offering cloud-connected test platforms with bundled calibration, software updates, and regulatory-reporting modules can generate predictable recurring revenue while lowering adoption barriers for smaller manufacturers.

Sustainability and Environmental Compliance

Growing environmental scrutiny of pharmaceutical manufacturing waste streams is creating demand for test methodologies that reduce solvent and wetting-agent consumption. Acoustic integrity test methods eliminate the need for liquid wetting entirely, positioning them as environmentally favorable alternatives. The pharmaceutical industry's commitment to Science Based Targets initiative (SBTi) goals — with over 40 major companies pledging net-zero operations by 2045 [20] — will accelerate adoption of lower-waste testing protocols across the Filter Integrity Test Market.

Continuous Manufacturing and Real-Time Release Testing

The FDA's 2023 draft guidance on continuous manufacturing explicitly encourages real-time release testing (RTRT) frameworks that verify critical quality attributes without interrupting production flow [21]. Inline filter integrity verification is a natural extension of this vision, and instrument manufacturers are developing compact, flow-through test modules designed for integration into continuous bioprocessing trains. By 2032, RTRT-compatible filter test systems could represent a meaningful share of new equipment installations in advanced biologics facilities.


Filter Integrity Test Market Segmentation

By Product Type

Segment Key Metric Primary Demand Driver
Automated 52.9% share (2025) Data-integrity mandates and electronic batch records
Manual 47.1% share (2025) Cost-sensitive labs and legacy facility installations


Automated systems lead the Filter Integrity Test Market by revenue, reflecting the pharmaceutical industry's broader digitalization of quality-control operations. These platforms integrate pressure sensors, flow controllers, and software interfaces that automate test execution, data capture, and report generation. Manual testers retain a significant installed base, particularly in small-scale compounding pharmacies, academic research facilities, and emerging-market manufacturers where capital budgets limit equipment investments. The gap between automated and manual adoption is narrowing as entry-level automated units reach price points below USD 30,000.

By Test Type

Segment Key Metric Primary Demand Driver
Bubble Point Test 37.9% share (2025) Established regulatory acceptance across pharmacopeias
Diffusion Test USD 24.72 Million (2025) Preferred for large-area membrane cartridges
Water Intrusion Test 6.62% CAGR Hydrophobic filter applications in gas filtration
Pressure Hold Test USD 9.83 Million (2025) Rapid screening in high-throughput environments


Bubble point testing remains the anchor methodology for the Filter Integrity Test Market because it directly correlates with the critical pore size of membrane filters, providing a definitive pass/fail determination recognized by USP, EP, and JP pharmacopeias. Water intrusion testing is gaining momentum specifically in applications involving hydrophobic gas-sterilizing filters where traditional wetting-based methods are impractical.

By Mechanism

Segment Key Metric Primary Demand Driver
Pressure-Based 57.4% share (2025) Proven technology with extensive validation history
Acoustic 7.41% CAGR Non-destructive, high-sensitivity defect detection
Other Mechanisms USD 4.86 Million (2025) Specialized electrochemical and optical methods


Pressure-based mechanisms dominate the Filter Integrity Test Market through decades of established use and deep regulatory familiarity. Acoustic technologies, while currently a small fraction of installed systems, represent the fastest-growing mechanism category as manufacturers seek non-invasive test approaches for sensitive advanced therapy products.

By Filter Type

Segment Key Metric Primary Demand Driver
Liquid Filters 63.2% share (2025) Sterile drug product and biologics manufacturing
Gas/Air Filters 36.8% share (2025) HVAC and vent filter integrity in cleanrooms

Liquid filters dominate the market with a 63.2% share in 2025, driven by the growing demand for sterile drug product and biologics manufacturing. Gas and air filters account for the remaining 36.8%, supported by the need for HVAC and vent filter integrity within cleanroom environments. Together, these segments underscore the critical role filtration plays across both liquid processing and air quality control in pharmaceutical production.

By Application

Segment Key Metric Primary Demand Driver
Liquid Filtration Integrity 56.7% share (2025) Parenteral drug and vaccine production
Gas Filtration Integrity 43.3% share (2025) Cleanroom air handling and fermenter venting

Liquid filtration integrity holds the larger share at 56.7% in 2025, driven by rigorous demands in parenteral drug and vaccine production. Gas filtration integrity accounts for 43.3% of the market, supported by the critical need for cleanroom air handling and fermenter venting systems. Both segments highlight how filtration integrity testing underpins quality assurance across liquid- and air-based pharmaceutical manufacturing processes.

By End User

Segment Key Metric Primary Demand Driver
Pharmaceutical & Biotechnology Companies 49.2% share (2025) Largest installed base of sterile manufacturing lines
Contract Manufacturing Organizations 7.95% CAGR Outsourcing wave in biologics and gene therapy
Food & Beverage USD 10.24 Million (2025) Microbial filtration for beverages and dairy
Other End Users 4.38% CAGR Academic, water treatment, semiconductor applications


Pharmaceutical and biotechnology companies remain the core demand base for the Filter Integrity Test Market, operating the vast majority of sterilizing-grade filtration systems that require routine integrity verification. Contract manufacturing organizations are growing fastest as large pharma increasingly outsources production of complex biologics, cell therapies, and viral vectors to specialized CDMOs that invest heavily in quality infrastructure.


Regional Market Share Analysis

Region Key Metric Primary Investment Themes
North America 36.4% share (2025) FDA compliance modernization, biologics manufacturing
Europe 27.8% share (2025) EU Annex 1 implementation, vaccine production hubs
Asia-Pacific 5.96% CAGR (2026–2035) CMO expansion, domestic pharma scaling
South America USD 7.03 Million (2025) Regulatory alignment, biosimilar production
Middle East & Africa 6.5% share (2025) Healthcare infrastructure investment
Total USD 90.12 Million (2025)

The Filter Integrity Test Market exhibits a concentrated geographic footprint, with North America and Europe collectively accounting for over 64% of 2025 revenue. Asia-Pacific's rapid capacity build-out is reshaping this distribution, while South America and the Middle East & Africa present greenfield growth opportunities.


North America

Country Key Metric Key Driver
US 78.2% of regional share Largest biologics manufacturing base globally [1]
Canada 5.18% CAGR Life-sciences corridor investments in Ontario and Quebec
Mexico USD 1.14 Million (2025) Nearshoring of pharmaceutical production


The US dominates the North American Filter Integrity Test Market through its concentration of FDA-regulated biologics and sterile injectable manufacturing. More than 180 FDA-approved biologic products required sterile filtration validation as of 2024, and new modalities — including mRNA-based therapeutics — continue to expand the installed base of filter test equipment [1]. Canada's growing life-sciences investment and Mexico's emerging role as a pharmaceutical nearshoring destination add incremental growth vectors across the region.

Europe

Country Key Metric Key Driver
Germany 24.6% of regional share Biotech hub with strong GMP infrastructure [5]
UK 5.42% CAGR Post-Brexit regulatory independence accelerates adoption
France USD 3.96 Million (2025) Vaccine manufacturing capacity at Sanofi and bioMérieux sites
Italy 11.3% of regional share Contract manufacturing cluster in Lombardy
Spain 4.88% CAGR Biosimilar production expansion
Nordic Countries USD 2.18 Million (2025) Advanced bioprocessing R&D facilities
Russia 3.8% of regional share Import substitution driving local equipment demand
Rest of Europe 4.52% CAGR Emerging pharma manufacturing in CEE nations


Europe's Filter Integrity Test Market is shaped decisively by the EU Annex 1 revision, which elevated filter integrity verification from a recommended practice to a regulatory expectation across all aseptic manufacturing operations. Germany anchors regional demand through its dense network of biotech companies and contract manufacturers. At the same time, the UK's post-Brexit Medicines and Healthcare products Regulatory Agency (MHRA) framework has independently strengthened testing requirements.

Asia-Pacific

Country Key Metric Key Driver
China 31.5% of regional share 14th Five-Year Plan bioeconomy investments [11]
India 6.48% CAGR Bulk Drug Park initiative and WHO prequalification targets
Japan USD 3.22 Million (2025) Advanced biologics and regenerative medicine programs
South Korea 5.87% CAGR Samsung Biologics, Celltrion capacity scale-ups
ASEAN 18.4% of regional share Emerging vaccine manufacturing hubs in Thailand and Indonesia
Rest of Asia-Pacific 5.34% CAGR Australia, Taiwan life-sciences growth


Asia-Pacific represents the most dynamic growth frontier for the Filter Integrity Test Market. China's state-backed bioeconomy programs and India's ambition to become a global biosimilar supply hub are generating sustained demand for quality-control infrastructure. South Korea's concentration of large-scale contract biologics manufacturers — with combined capacity exceeding 600,000 liters — creates particularly dense demand for high-throughput automated testing platforms.

South America

Country Key Metric Key Driver
Brazil 58.3% of regional share Largest pharma market in Latin America [17]
Argentina 5.12% CAGR Biosimilar regulatory pathway development
Rest of South America USD 1.58 Million (2025) Colombia, Chile pharma sector growth


Brazil's national pharmaceutical production policies and its regulatory agency ANVISA's increasing alignment with ICH guidelines are the primary forces shaping the South American Filter Integrity Test Market. The region remains in an early adoption phase for automated test platforms, with most facilities still relying on manual configurations.

Middle East & Africa

Country Key Metric Key Driver
Saudi Arabia 28.7% of regional share Vision 2030 healthcare sector modernization
UAE 5.68% CAGR Dubai and Abu Dhabi biotech free zones
South Africa USD 0.94 Million (2025) Biovac Institute and vaccine manufacturing [18]
Egypt 4.76% CAGR Local pharmaceutical production incentives
Rest of MEA 21.4% of regional share Emerging pharma hubs in Morocco and Kenya


The Middle East & Africa region is the smallest contributor to the Filter Integrity Test Market by revenue but presents significant long-term potential. Saudi Arabia's Vision 2030 program earmarks substantial investment for domestic pharmaceutical and biotechnology manufacturing, while South Africa's mRNA vaccine technology transfer hub is creating new demand for membrane filter validation infrastructure.


Filter Integrity Test Market By Region, 2025-2035

Competitive Benchmarking

The Filter Integrity Test Market is highly concentrated, with the top five competitors holding 48-55% of the global market revenue. The Herfindahl-Hirschman Index is in the moderate range, suggesting that the market is a mix of a few established life-sciences instrumentation companies competing against specialized filtration testing companies and new entrants with new technology. The competition is about the sophistication of automation, regulatory validation support, software integration and worldwide service coverage.

Company Est. Revenue Share Range Key Offerings for Filter Integrity Test Market Strategic Positioning
Sartorius AG ~12–15% Sartocheck® automated integrity test instruments Integrated bioprocess equipment portfolio
Merck KGaA (MilliporeSigma) ~10–13% Integritest® automated filter testers End-to-end filtration and testing ecosystem
Pall Corporation (Danaher) ~9–12% Palltronic® flow/compact integrity test systems Global service network and validation support
Parker Hannifin Corporation ~6–9% Valairdata integrity test instruments Broad industrial and biopharma filter range
Donaldson Company ~5–7% Automated filter test modules for life sciences Cross-industry filtration expertise
Meissner Filtration Products ~4–6% IntegriPac® single-use test systems Single-use bioprocessing specialization
Eaton Corporation ~3–5% Beco Integrity Pro testing platforms Food, beverage, and pharma diversification
Thermo Fisher Scientific ~3–5% Nalgene filter integrity verification instruments Broad life-sciences instrument portfolio
SUEZ Water Technologies ~2–4% Filter integrity solutions for water and pharma Water-pharma crossover applications
DrM, Dr. Müller AG ~2–3% Pressure-hold and diffusion test equipment European niche specialization


Recent News & Developments


  • Merck KGaA (November 2024): Expanded Integritest® platform connectivity with cloud-based data management module, enabling multi-site test-data aggregation and remote audit access [23].
  • Pall Corporation (August 2024): Received FDA feedback letter acknowledging Palltronic® acoustic test methodology as suitable for inclusion in investigational drug manufacturing protocols [8].
  • European Commission (August 2023): EU GMP Annex 1 revision took full effect, mandating comprehensive contamination-control strategies that include pre- and post-use filter integrity verification for all sterilizing-grade filters [5].
  • Parker Hannifin (June 2024): Entered strategic partnership with a leading South Korean CDMO to deploy Valairdata systems across three biologics manufacturing campuses [24].
  • Meissner Filtration Products (January 2024): Introduced IntegriPac® rapid-connect test interface designed to reduce single-use filter setup time by 45% compared to previous-generation assemblies [25].
  • FDA (October 2023): Published draft guidance on continuous manufacturing for biological products, specifically referencing real-time filter integrity monitoring as a potential component of real-time release testing frameworks [21].


Filter Integrity Test Market Report Scope

Parameter Detail
Market Scope Global Filter Integrity Test Market — products, services, and associated consumables for filter integrity verification
Study Period 2021–2035
CAGR (2026–2035) 5.56%
Base Year 2025 USD 90.12 Million
Forecast 2035 USD 154.83 Million
Fastest Growing Segment Acoustic mechanism (7.41% CAGR); CMOs by end user (7.95% CAGR)
Companies Profiled 10 (Sartorius, Merck KGaA, Pall Corporation, Parker Hannifin, Donaldson, Meissner, Eaton, Thermo Fisher, SUEZ, DrM)
Valuation Currency USD Million


FAQs

How does acoustic testing compare with pressure-based methods for detecting sub-micron filter defects?
Acoustic testing detects defects through ultrasonic wave pattern analysis, achieving sensitivity below 0.1 µm without requiring liquid wetting agents [8]. Pressure-based methods remain more widely validated but cannot match acoustic resolution on ultra-fine membranes.
What operator training is typically required before deploying automated filter integrity test systems?
Most vendors provide 2–3 day onsite certification programs covering instrument operation, software configuration, and troubleshooting [2]. Ongoing competency assessments aligned with GMP training requirements are recommended annually.
How does single-use bioprocessing affect the total cost of filter integrity testing per batch?
Single-use assemblies multiply the number of individual tests per batch, increasing consumable and labor costs by 30–40% compared to reusable stainless-steel setups [10]. Faster changeover times partially offset this through improved facility utilization.
What cybersecurity considerations apply to cloud-connected filter integrity test platforms?
Connected platforms must comply with 21 CFR Part 11 electronic-records requirements and facility IT security policies [12]. Encrypted data transmission, role-based access controls, and audit-trail integrity are baseline expectations.
How frequently should automated filter integrity test instruments undergo metrology recalibration?
Industry best practice calls for annual calibration against traceable pressure and flow standards, with interim verification checks every six months [2]. Regulatory inspectors routinely review calibration records during site audits.
What procurement factors differentiate filter integrity test vendors beyond price?
Key differentiators include global service-center reach, regulatory validation support packages, software interoperability with LIMS/MES systems, and availability of application-specific test protocols [13]. After-sales support quality often outweighs initial equipment cost.
How are emerging biosimilar manufacturing trends shaping the Filter Integrity Test Market?
Biosimilar production requires identical sterile filtration validation as originator biologics, expanding the test-equipment installed base proportionally [6]. Markets with active biosimilar regulatory pathways — especially India and South Korea — are seeing accelerated demand.    
Author
Author
Author Profile
Nidhi Mandole LinkedIn
Senior Research Analyst
She is an extremely curious individual currently working in Healthcare and Medical Devices Domain. Nidhi is comfortably versed in data centric research backed by healthcare educational background. She leverages extensive data mining and analytics tools such as Primary and Secondary Research, Statistical Analysis, Machine Learning, Data Modelling. Her key role also involves Technical Sales Support, Client Interaction and Project management within the Healthcare team. Lastly, she showcases extensive affinity towards learning new skills and remain fascinated in implementing them.
Co-Author
Co-Author Profile
Rahul Gotadki LinkedIn
Research Manager
He holds an experience of about 9+ years in Market Research and Business Consulting, working under the spectrum of Life Sciences and Healthcare domains. Rahul conceptualizes and implements a scalable business strategy and provides strategic leadership to the clients. His expertise lies in market estimation, competitive intelligence, pipeline analysis, customer assessment, etc.

Research Approach


Secondary Research

The secondary research process involved comprehensive analysis of regulatory databases, peer-reviewed scientific journals, filtration industry publications, and authoritative quality assurance organizations. Key sources included the US Food & Drug Administration (FDA) Center for Drug Evaluation and Research, European Medicines Agency (EMA) Quality Guidelines, International Conference on Harmonisation (ICH) Q5A-Q5D Guidelines, Parenteral Drug Association (PDA) Technical Reports, American Society for Testing and Materials (ASTM) International, International Organization for Standardization (ISO) 13408 (Aseptic Processing), Pharmaceutical Quality Group (PQG), BioPhorum Operations Group (BPOG), International Society for Pharmaceutical Engineering (ISPE) Baseline Guides, National Sanitation Foundation (NSF) International, US Environmental Protection Agency (EPA) Water Quality Standards, 3-A Sanitary Standards, European Directorate for the Quality of Medicines & HealthCare (EDQM), National Institute for Health and Care Excellence (NICE), World Health Organization (WHO) Technical Report Series on Good Manufacturing Practices, USDA Food Safety and Inspection Service (FSIS), and national medicines regulatory authorities from key markets. These sources were used to collect regulatory compliance requirements, sterilization validation protocols, pharmaceutical filtration standards, audit inspection data, and quality control frameworks for membrane filtration systems, integrity testing methodologies, and automated validation technologies.


Primary Research

In order to gather both qualitative and quantitative insights, supply-side and demand-side stakeholders were interviewed during the primary research process. CEOs, VPs of Manufacturing Operations, directors of quality assurance, and R&D heads from manufacturers of membrane filtering, automation technologies, and filter integrity test equipment were examples of supply-side sources. Validation managers, quality control directors, sterile processing engineers, and procurement leads from biopharmaceutical manufacturing facilities, contract manufacturing organizations (CMOs), sterile fill-finish operations, food and beverage processing facilities, and biotechnology companies were examples of demand-side sources. Primary research obtained information on regulatory audit patterns, equipment validation procedures, and total cost of ownership dynamics. It also validated market segmentation across testing methodologies and corroborated technology adoption timescales.

Primary Respondent Breakdown:

By Designation: C-level Primaries (28%), Director Level (32%), Others (40%)

By Region: North America (38%), Europe (25%), Asia-Pacific (28%), Rest of World (9%)


Market Size Estimation

Global market valuation was derived through revenue mapping and equipment installation base analysis. The methodology included:

Identification of 35+ key manufacturers across North America, Europe, Asia-Pacific, and Latin America

Product mapping across Forward Flow, Bubble Point, Pressure Hold, Water Intrusion, and other testing methodologies

Analysis of reported and modeled annual revenues specific to filter integrity test equipment and consumables portfolios

Coverage of manufacturers representing 75-80% of global market share in 2024

Extrapolation using bottom-up (installed base × service contract value by industry vertical) and top-down (manufacturer revenue validation) approaches to derive segment-specific valuations

Download Free Sample

Kindly complete the form below to receive a free sample of this Report

Download PDF ×

We do not share your information with anyone. However, we may send you emails based on your report interest from time to time. You may contact us at any time to opt-out.
















