Flat Glass Market (2026 - 2035)

ID: MRFR/CnM/3972-HCR
111 Pages
Priya Nagrale
Last Updated: July 12, 2026
Flat Glass Market Research Report Information By Product Type (Clear Float Glass, Tempered Glass, Insulated Glass, Coated Glass, Annealed Glass and Laminated Glass), By End-Use Industry (Building & Construction, Automotive, Consumer Goods and Solar), and By Region (North America, Europe, Asia-Pacific, And Rest Of The World) – Market Forecast Till 2035
Flat Glass Market
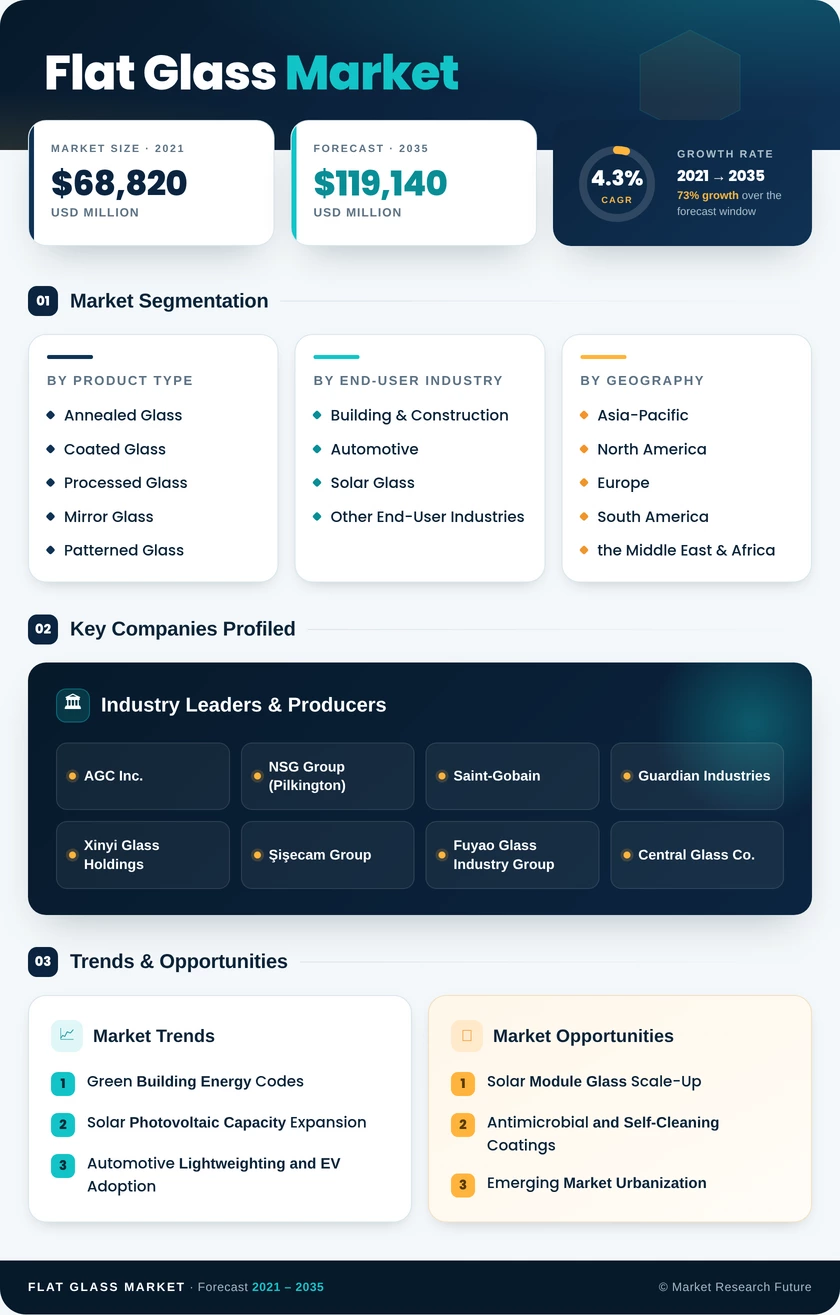
Market Size
Forecast Period2026-2035
CAGR (2026-2035)4.3%
2025 Market SizeUSD 78,200 Million
2035 Market SizeUSD 119,140 Million
Key Players
AGC Inc.
NSG Group
Saint-Gobain
Guardian Industries
Xinyi Glass Holdings
Şişecam Group
Opportunities
  • Solar Module Glass Scale-Up
  • Antimicrobial and Self-Cleaning Coatings
  • Emerging Market Urbanization
  1. 1 Market Overview |
    1. 1.1 Study Assumptions & Market Definition |
    2. 1.2 Scope of the Study |
    3. 1.3 Research Methodology
  2. 2 Market Summary & Key Takeaways
  3. 3 Market Dynamics |
    1. 3.1 Market Drivers Analysis | |
      1. 3.1.1 Green Building Energy Codes | |
      2. 3.1.2 Solar PV Capacity Expansion | |
      3. 3.1.3 Automotive Lightweighting & EV Adoption | |
      4. 3.1.4 Urbanization in Emerging Economies | |
      5. 3.1.5 Renovation and Deep-Retrofit Mandates | |
      6. 3.1.6 Smart Glass and IoT Glazing Systems | |
      7. 3.1.7 Healthcare Facility Modernization |
    2. 3.2 Market Restraints Analysis | |
      1. 3.2.1 Volatile Energy and Raw Material Costs | |
      2. 3.2.2 Carbon Emission Regulations on Glass Melting | |
      3. 3.2.3 Substitution from Polycarbonate and Acrylic | |
      4. 3.2.4 Overcapacity in Select Asian Markets | |
      5. 3.2.5 Logistics Bottlenecks and Freight Cost Inflation |
    3. 3.3 Market Opportunity Analysis | |
      1. 3.3.1 Solar Module Glass Scale-Up | |
      2. 3.3.2 Antimicrobial and Self-Cleaning Coatings | |
      3. 3.3.3 Emerging Market Urbanization | |
      4. 3.3.4 Vacuum-Insulated and Triple-Glazed Retrofit Products | |
      5. 3.3.5 Smart Glass and Data-Driven Building Platforms |
    4. 3.4 Industry Value Chain Analysis |
    5. 3.5 Porter's Five Forces Analysis
  4. 4 Global Flat Glass Market Size & Forecast (2021–2035) |
    1. 4.1 Historical Market Size (2021–2025) |
    2. 4.2 Current & Forecast Market Size (2026–2035) |
    3. 4.3 Market Size by Revenue (USD Million) |
    4. 4.4 Year-over-Year Growth Analysis
  5. 5 Segmentation Analysis |
    1. 5.1 By Product Type | |
      1. 5.1.1 Annealed Glass | |
      2. 5.1.2 Coated Glass | |
      3. 5.1.3 Processed Glass | |
      4. 5.1.4 Mirror Glass | |
      5. 5.1.5 Patterned Glass |
    2. 5.2 By End-User Industry | |
      1. 5.2.1 Building & Construction | |
      2. 5.2.2 Automotive | |
      3. 5.2.3 Solar Glass | |
      4. 5.2.4 Other End-User Industries
  6. 6 Regional Analysis |
    1. 6.1 North America | |
      1. 6.1.1 United States | |
      2. 6.1.2 Canada | |
      3. 6.1.3 Mexico |
    2. 6.2 Europe | |
      1. 6.2.1 Germany | |
      2. 6.2.2 United Kingdom | |
      3. 6.2.3 France | |
      4. 6.2.4 Italy | |
      5. 6.2.5 Spain | |
      6. 6.2.6 Nordic Countries | |
      7. 6.2.7 Russia | |
      8. 6.2.8 Rest of Europe |
    3. 6.3 Asia-Pacific | |
      1. 6.3.1 China | |
      2. 6.3.2 India | |
      3. 6.3.3 Japan | |
      4. 6.3.4 South Korea | |
      5. 6.3.5 ASEAN | |
      6. 6.3.6 Rest of Asia-Pacific |
    4. 6.4 South America | |
      1. 6.4.1 Brazil | |
      2. 6.4.2 Argentina | |
      3. 6.4.3 Rest of South America |
    5. 6.5 Middle East & Africa | |
      1. 6.5.1 Saudi Arabia | |
      2. 6.5.2 UAE | |
      3. 6.5.3 South Africa | |
      4. 6.5.4 Egypt | |
      5. 6.5.5 Rest of MEA
  7. 7 Competitive Landscape |
    1. 7.1 Market Share Analysis (2025) |
    2. 7.2 Competitive Benchmarking Matrix |
    3. 7.3 Company Profiles | |
      1. 7.3.1 AGC Inc. | |
      2. 7.3.2 NSG Group (Pilkington) | |
      3. 7.3.3 Saint-Gobain | |
      4. 7.3.4 Guardian Industries | |
      5. 7.3.5 Xinyi Glass Holdings | |
      6. 7.3.6 Şişecam Group | |
      7. 7.3.7 Fuyao Glass Industry Group | |
      8. 7.3.8 Central Glass Co., Ltd. | |
      9. 7.3.9 Taiwan Glass Industry Corp. | |
      10. 7.3.10 Vitro S.A.B. de C.V.
  8. 8 Future Outlook & Strategic Recommendations (2026–2035) |
    1. 8.1 Decarbonization of Glass Manufacturing |
    2. 8.2 Smart Glass and Building Automation Integration |
    3. 8.3 Solar Energy Supercycle |
    4. 8.4 Circular Economy and Glass Recycling
  9. 9 Recent Developments & News
  10. 10 Frequently Asked Questions (FAQs)
  11. 11 Report Scope & Methodology |
    1. 11.1 Study Period & Base Year |
    2. 11.2 Data Sources & Citations |
    3. 11.3 Abbreviations
  12. 12 LIST OF TABLES |
  13. TABLE 1 Global Flat Glass Market Size & Forecast, by Revenue (USD Million), 2021–2035 |
  14. TABLE 2 Global Flat Glass Market — Year-over-Year Growth Analysis, 2021–2035 |
  15. TABLE 3 Global Flat Glass Market — Driver Impact Analysis |
  16. TABLE 4 Global Flat Glass Market — Restraint Impact Analysis |
  17. TABLE 5 Global Flat Glass Market Size, by Product Type, 2021–2035 (USD Million) |
  18. TABLE 6 Global Flat Glass Market Size, by End-User Industry, 2021–2035 (USD Million) |
  19. TABLE 7 Global Flat Glass Market Size, by Region, 2021–2035 (USD Million) |
  20. TABLE 8 North America Flat Glass Market Size, by Country, 2021–2035 (USD Million) |
  21. TABLE 9 Europe Flat Glass Market Size, by Country, 2021–2035 (USD Million) |
  22. TABLE 10 Asia-Pacific Flat Glass Market Size, by Country, 2021–2035 (USD Million) |
  23. TABLE 11 South America Flat Glass Market Size, by Country, 2021–2035 (USD Million) |
  24. TABLE 12 Middle East & Africa Flat Glass Market Size, by Country, 2021–2035 (USD Million) |
  25. TABLE 13 North America Flat Glass Market Size, by Product Type, 2021–2035 (USD Million) |
  26. TABLE 14 North America Flat Glass Market Size, by End-User Industry, 2021–2035 (USD Million) |
  27. TABLE 15 Europe Flat Glass Market Size, by Product Type, 2021–2035 (USD Million) |
  28. TABLE 16 Europe Flat Glass Market Size, by End-User Industry, 2021–2035 (USD Million) |
  29. TABLE 17 Asia-Pacific Flat Glass Market Size, by Product Type, 2021–2035 (USD Million) |
  30. TABLE 18 Asia-Pacific Flat Glass Market Size, by End-User Industry, 2021–2035 (USD Million) |
  31. TABLE 19 South America Flat Glass Market Size, by Product Type, 2021–2035 (USD Million) |
  32. TABLE 20 South America Flat Glass Market Size, by End-User Industry, 2021–2035 (USD Million) |
  33. TABLE 21 Middle East & Africa Flat Glass Market Size, by Product Type, 2021–2035 (USD Million) |
  34. TABLE 22 Middle East & Africa Flat Glass Market Size, by End-User Industry, 2021–2035 (USD Million) |
  35. TABLE 23 Competitive Benchmarking Matrix — Global Flat Glass Market, 2025 |
  36. TABLE 24 Company Profiles — Key Players, Global Flat Glass Market |
  37. TABLE 25 Recent Developments & Strategic Announcements, 2023–2025 |
  38. TABLE 26 Report Scope & Methodology Summary |
  39. TABLE 27 Detailed Sources and Citations
  40. 13 LIST OF FIGURES |
  41. FIGURE 1 Global Flat Glass Market Dynamics — Drivers, Restraints, and Opportunities |
  42. FIGURE 2 Industry Value Chain Analysis — Flat Glass Market |
  43. FIGURE 3 Porter's Five Forces Analysis — Flat Glass Market |
  44. FIGURE 4 Global Flat Glass Market Size Trend (USD Million), 2021–2035 |
  45. FIGURE 5 Global Flat Glass Market Share, by Product Type (2025) |
  46. FIGURE 6 Global Flat Glass Market Share, by End-User Industry (2025) |
  47. FIGURE 7 Global Flat Glass Market Share, by Region (2025) |
  48. FIGURE 8 North America Flat Glass Market Size Trend (USD Million), 2021–2035 |
  49. FIGURE 9 Europe Flat Glass Market Size Trend (USD Million), 2021–2035 |
  50. FIGURE 10 Asia-Pacific Flat Glass Market Size Trend (USD Million), 2021–2035 |
  51. FIGURE 11 South America Flat Glass Market Size Trend (USD Million), 2021–2035 |
  52. FIGURE 12 Middle East & Africa Flat Glass Market Size Trend (USD Million), 2021–2035 |
  53. FIGURE 13 Competitive Landscape — Market Share Analysis, Flat Glass Market (2025) |
  54. FIGURE 14 Competitive Positioning Matrix — Key Players, Flat Glass Market

Segmentation Quick Reference

DimensionSub-SegmentsDominant SegmentFastest Growing Segment
By Product TypeAnnealed Glass, Coated Glass, Processed Glass, Mirror Glass, Patterned GlassAnnealed Glass (~74% share, 2025)Processed Glass (5.0% CAGR)
By End-User IndustryBuilding & Construction, Automotive, Solar Glass, Other End-User IndustriesBuilding & Construction (~75% share, 2025)Solar Glass (7.0% CAGR)
By GeographyAsia-Pacific, North America, Europe, South America, the Middle East & AfricaAsia-Pacific (~59% share, 2025)Asia-Pacific (5.0% CAGR)


Market Segmentation Overview

By Product Type

Sub-SegmentKey Trend
Annealed GlassVolumetric baseline; feedstock for all processed and coated derivatives
Coated GlassLow-emissivity and solar-control coatings driven by energy-code mandates
Processed GlassSafety-glazing upgrades in commercial and automotive applications
Mirror GlassInterior design growth and concentrated solar power reflector demand
Patterned GlassDecorative and privacy applications in residential and hospitality sectors


Annealed glass serves as the industry's foundation, processed through float lines into sheets that either ship as-is or feed downstream tempering, laminating, and coating operations. Coated and processed variants are capturing an increasing share of value as building codes and automotive safety standards tighten globally.

By End-User Industry

Sub-SegmentKey Trend
Building & ConstructionNew-build and renovation activity across residential and commercial segments
AutomotiveEV lightweighting, panoramic roofs, and advanced driver-assist glazing
Solar GlassBifacial module adoption doubling glass content per installed watt.
Other End-User IndustriesFurniture, electronics, display covers, appliance panels


Building and construction remains the dominant demand channel, but solar glass is rapidly closing the gap in growth terms. Automotive glass content per vehicle continues to increase as panoramic roof designs and head-up-display windshields become standard on premium and mid-range EV platforms.

By Geography

Sub-SegmentKey Trend
Asia-PacificDominant producer and consumer; China and India drive volume growth
EuropeRenovation-wave mandates and CBAM reshaping competitive dynamics
North AmericaIRA-driven solar manufacturing and commercial retrofit activity
South AmericaBrazilian housing programs anchoring regional demand
Middle East & AfricaMega-project construction and new domestic float-line capacity


Asia-Pacific's commanding position reflects China's unmatched production scale combined with India's accelerating urbanization cycle. In mature Western markets, demand growth is increasingly tied to renovation and energy-code compliance rather than greenfield construction volume.


Download PDF ×

We do not share your information with anyone. However, we may send you emails based on your report interest from time to time. You may contact us at any time to opt-out.