Foliar Spray Market (2026 - 2035)

Foliar Spray Market Size, Share, Industry Trend & Analysis Research Report By Chemical Type (Nitrogenous, Phosphatic, Potassic, Calcium, Micronutrients, Others), By Product Form (Liquid, Powder), By Source (Synthetic, Bio-based / Organic), By Application (Horticulture Crops, Agriculture Crops, Orchard Crops, Others), By Geography (Asia-Pacific, North America, Europe, South America, Middle East & Africa) - Forecast to 2035

Forecast Period
2026-2035
CAGR
5.70%
2025 Market Size
USD 8.72 Billion (2025)
2035 Market Size
USD 15.19 Billion (2035)
Agriculture ● Updated July 28, 2026 Report ID: MRFR/Agri/4885-HCR | Pages: 100 | Author: Snehal Singh, Sakshi Gupta

Foliar Spray Market Summary

The global Foliar Spray Market stood at USD 8.72 billion in 2025 and is projected to reach USD 9.22 billion in 2026 before climbing to USD 15.19 billion by 2035, expanding at a 5.70% CAGR over the 2026–2035 forecast window. Two catalysts are accelerating demand: national soil-health mandates — India's Soil Health Card scheme alone has covered more than 230 million holdings since its 2015 launch [1] — and large-scale precision-agriculture investment programs such as the USDA's USD 3.1 billion Climate-Smart Commodities initiative [2]. Both programs push growers toward targeted foliar applications that correct nutrient gaps faster than soil-applied alternatives.

Technology is reshaping how nutrients reach the leaf surface. Conventional boom sprayers with blanket coverage are giving way to AI-guided variable-rate systems and electrostatic applicators that cut chemical volumes by 30–40% while boosting deposition uniformity [3]. Nanocarrier-based formulations — chitosan-coated zinc and iron chelates, for instance — have moved from lab trials into commercial orchards across Spain and Brazil, improving foliar uptake efficiency and reducing the number of spray passes per season [4]. Government sustainability frameworks, including the EU's Farm to Fork target of a 50% pesticide-use reduction by 2030, are creating regulatory pull for these high-efficiency delivery systems [5].

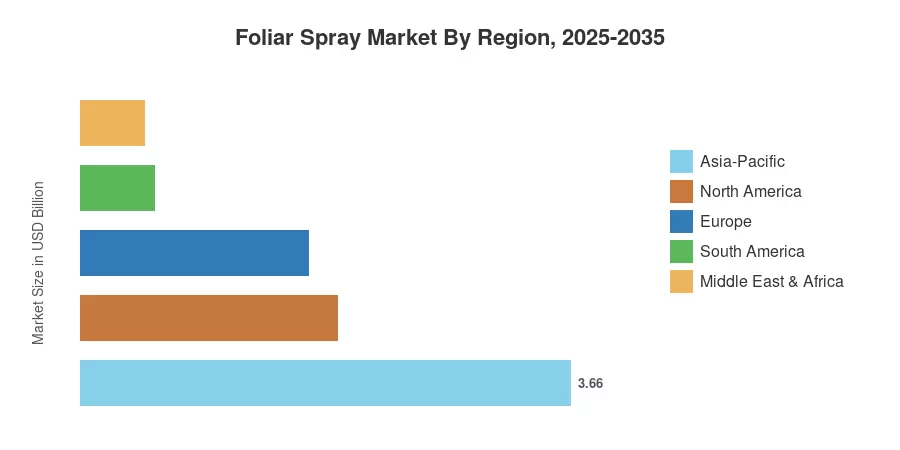
Asia-Pacific dominates the Foliar Spray Market with roughly 42% of 2025 revenue, driven by intensive rice and vegetable cultivation across China, India, and Southeast Asia. South America is the fastest-growing region at a projected 6.25% CAGR, supported by soybean and coffee nutrient-management programs in Brazil and Argentina. North America holds the second-largest share at approximately 22%, where specialty-crop growers in California and Florida rely heavily on foliar calcium and micronutrient products to meet export-grade quality standards. As arable land per capita declines globally, foliar spray technology will remain central to closing yield gaps without expanding cultivated area.


Key Report Takeaways

• By Chemical Type

  • Nitrogenous formulations captured roughly 37% of the Foliar Spray Market in 2025, reflecting strong demand for urea-based foliar feeds in cereal and vegetable production.
  • Micronutrient products are forecast to register a 6.05% CAGR through 2035, the fastest among chemical segments, driven by zinc- and boron-deficient soils across South Asia and sub-Saharan Africa.

• By Product Form & Source

  • Liquid formulations accounted for approximately 79% of the Foliar Spray Market in 2025, owing to ease of tank-mixing and compatibility with drone and pivot-based sprayers.
  • Bio-based products are on pace to grow at a 5.88% CAGR during 2026–2035, benefiting from organic-certification premiums and tightening EU input regulations.

• By Application

  • Horticulture crops represented around 47% of Foliar Spray Market revenue in 2025, as high-value vegetable and flower growers invest aggressively in nutrient-quality programs.


• By Region

  • South America is projected to post the highest regional CAGR at 6.25%, while Asia-Pacific retains the largest revenue share through 2035.


Foliar Spray Market Size and Forecast (2021–2035)

Market sizing draws on a triangulated approach combining company revenue disclosures, trade-flow data from the International Fertilizer Association (IFA), and proprietary primary interviews with agronomists, distributors, and procurement heads across 28 countries. Historical figures reflect confirmed shipment data; forecast projections apply econometric modeling tied to planted acreage, crop-mix shifts, and regulatory trajectories.
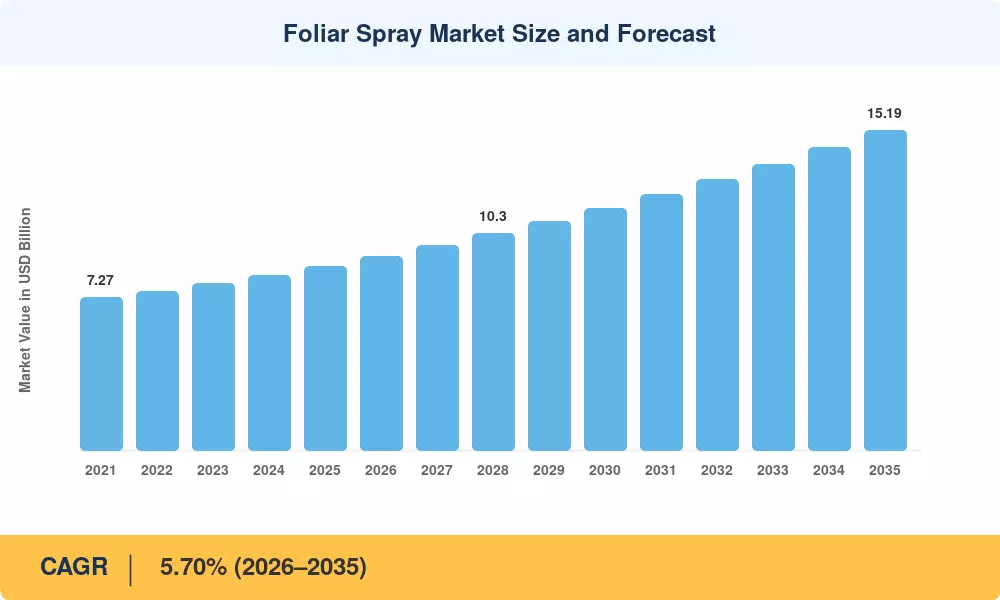
Foliar Spray Market Size and Forecast
Our Impact
Enabled $4.3B Revenue Impact for Fortune 500 and Leading Multinationals
Partnering with 2000+ Global Organizations Each Year
30K+ Citations by Top-Tier Firms in the Industry

Driver Impact Analysis

Driver ~% Impact on CAGR Geographic Relevance Impact Timeline
Precision agriculture & variable-rate spraying +0.9% Global Medium-term
Micronutrient deficiency mitigation programs +0.8% Asia-Pacific, Africa Long-term
Bio-based and organic certification demand +0.6% Europe, North America Medium-term
Drone-based foliar application expansion +0.7% Asia-Pacific, South America Short-term
Nanocarrier and adjuvant innovation +0.5% Global Long-term
Protected and controlled-environment agriculture +0.4% Middle East, Europe Medium-term
Climate-induced nutrient stress events +0.3% Global Long-term


Precision Agriculture and Variable-Rate Spraying

Adoption of GPS-guided and sensor-driven sprayers has moved the Foliar Spray Market away from blanket application. A 2024 USDA Economic Research Service study found that variable-rate nutrient management reduced input costs by 12–18% per hectare on large US corn operations while improving grain quality metrics [3]. Equipment manufacturers such as John Deere and AGCO are embedding multispectral canopy sensors directly into boom systems, enabling real-time dose adjustments that align foliar nutrient delivery with plant demand curves. This driver has the broadest geographic impact because the underlying hardware platforms are already deployed across North America, Europe, and parts of South America.

Government Micronutrient Deficiency Programs

Zinc and iron deficiency affect more than one-third of cultivated soils in South Asia, according to the Food and Agriculture Organization [1]. India's Soil Health Card program and Bangladesh's Integrated Nutrient Management project both recommend foliar zinc sprays as a cost-effective correction strategy. These government-backed advisories convert millions of smallholders into first-time buyers of foliar products, widening the addressable Foliar Spray Market in regions where soil amendment alone cannot close the micronutrient gap within a single growing season.

Bio-Based Formulation Demand

The EU's Farm to Fork strategy explicitly targets a 20% reduction in fertilizer use by 2030, steering growers toward concentrated, bio-based foliar inputs that deliver more nutrient per liter of spray solution [5]. Certification bodies — USDA Organic, EU Organic, and Demeter — increasingly accept seaweed-extract and amino-acid-based foliar feeds, opening shelf space in high-margin organic supply chains. Bio-based products still represent a minority of Foliar Spray Market revenue, yet their growth trajectory outpaces synthetic counterparts by a meaningful margin.

Drone-Based Foliar Application

Agricultural drone fleets exceeded 200,000 units in China alone by mid-2024, according to the Ministry of Agriculture and Rural Affairs [9]. DJI's Agras T50 and XAG's P100 can cover 15–20 hectares per hour at ultra-low volumes, making foliar application economically viable on crops and terrains previously served only by knapsack sprayers. In Brazil, sugarcane and coffee estates are converting to drone-applied foliar calcium to reduce fruit-cracking losses, a trend that directly expands Foliar Spray Market volumes in South America.


Restraints Impact Analysis

The negative-impact estimates below follow the same directional methodology described in Section 4. They represent headwinds that moderate, rather than eliminate, the growth trajectory of the Foliar Spray Market.

Restraint ~% Impact on CAGR Geographic Relevance Impact Timeline
Competition from fertigation and soil-applied CRFs –0.5% Global Long-term
Environmental concerns over spray drift and runoff –0.4% Europe, North America Medium-term
Price sensitivity among smallholder farmers –0.4% Asia-Pacific, Africa Short-term
Regulatory fragmentation on bio-stimulant classification –0.3% Europe Medium-term
Water scarcity limiting spray volumes –0.2% Middle East, Africa Long-term


Fertigation and Controlled-Release Fertilizer Competition

Drip-fertigation systems deliver nutrients directly to the root zone with 90%+ efficiency, and the global fertigation market itself is growing above 6% annually [12]. In high-value greenhouse and vineyard operations — segments that also constitute prime Foliar Spray Market territory — growers are evaluating whether fertigation alone can replace multiple foliar passes. While the two methods are often complementary rather than substitutive, capital investment in drip infrastructure can shift budget allocation away from foliar programs, particularly in water-scarce regions where irrigation upgrades receive government subsidies.

Environmental and Drift Regulation

Spray-drift buffer zones are becoming increasingly regulated in the EU and some US states, increasing compliance costs of foliar applicators. The French ZNT (Zones de Non-Traitement) regulations require 5–20 meter unsprayed strips around rivers, which effectively reduces the area that can be treated and increases the per hectare treatment costs [5]. "While the rules don't preclude foliar use, they create some friction that can slow adoption on farms next to environmentally sensitive areas and push some growers to look at other ways of delivering nutrients.


Smallholder Price Sensitivity

In Sub-Saharan Africa and parts of South and South-East Asia, foliar products are competing for the same restricted input budget as seeds, basic NPK and crop protection chemicals. While agronomic gains support correction by foliar application [13], field studies by IFDC have revealed that when funds are tight, smallholders tend to rate foliar feeding lower than soil-applied fertilizers. Subsidized distribution channels, commonly handled by government extension services, are frequently used to overcome barriers. However, subsidies are not always available and are vulnerable to political pressures, restricting consistent growth in the Foliar Spray Market in price-sensitive regions.


Foliar Spray Market Opportunities

AI-Enabled Prescription Spraying

Machine learning platforms are combining satellite imagery, weather data and soil mapping to provide field-level foliar prescriptions that inform producers which nutrient to spray, where and at what concentration. There are companies such as CropX and Taranis that currently incorporate foliar advice into their decision support dashboards [3]. As these platforms grow, they will improve the accuracy and frequency of foliar treatments, increasing per-hectare expenditure on the Foliar Spray Market in technology-forward agricultural operations.


Expansion into Protected Agriculture in the Middle East

The UAE National Food Security Strategy seeks to expand local food production by 30% by 2030, mostly through climate-controlled greenhouses and vertical farms [10]. These settings depend solely on foliar and hydroponic nutrient delivery, presenting a greenfield opportunity for the Foliar Spray Market in an area that has historically relied on food imports. Saudi Arabia’s NEOM agricultural zone and Qatar’s foray into hydroponics are adding to this trajectory.


Bio-Stimulant and Bio-Based Foliar Convergence

Regulatory harmonization of bio-stimulant definitions — the EU's Fertilising Products Regulation 2019/1009 took full effect in July 2022 — is collapsing the line between bio-based foliar feeds and bio-stimulants [14]. Manufacturers who combine seaweed extracts, humic acids, and chelated micronutrients into single tank-mix products can capture both nutrient and stress-mitigation value propositions, expanding share of wallet per spray pass.

Data-Driven Subscription Models for Foliar Programs

Agronomy-as-a-service platforms are bundling soil testing, satellite monitoring, and customized foliar spray programs into annual subscription packages. This model converts episodic foliar purchases into recurring revenue streams and locks in customer relationships. Nutrien's Digital Hub and Yara's AtFarm are early examples of platforms that monetize agronomic data while increasing grower commitment to the Foliar Spray Market.

Emerging-Market Yield Intensification

With Sub-Saharan Africa's cereal yields averaging roughly one-third of the global mean, the African Union's Comprehensive Africa Agriculture Development Programme (CAADP) targets a 6% annual agricultural growth rate [16]. Foliar micronutrient correction is among the lowest-cost interventions for closing this yield gap, and donor-funded distribution programs by AGRA and the World Bank are already piloting foliar zinc spray kits for smallholder maize and rice farmers.


Foliar Spray Market Future Outlook

AI and Autonomous Spray Systems

By 2030, autonomous spray platforms — combining GPS-RTK guidance, LiDAR canopy mapping, and computer-vision weed–crop discrimination — are expected to handle more than 20% of global foliar application acreage [3]. These systems will compress spray windows, reduce operator exposure, and enable nighttime application when stomatal apertures favor foliar uptake. The Foliar Spray Market will shift from selling commodity liquids to selling data-integrated nutrient programs priced per hectare of treated canopy.

Nano- and Bio-Encapsulation Technologies

Nanoparticle carriers and biopolymer encapsulation are moving from pilot to commercial scale, with chitosan-zinc, carbon-dot iron, and lignin-coated urea formulations already registered in Brazil and the EU [4]. These technologies increase leaf retention time from minutes to hours and reduce the number of spray passes from three to one per growth stage. By 2035, encapsulated foliar products could capture 15–20% of Foliar Spray Market value, reshaping competitive dynamics in favor of R&D-intensive formulators.

Sustainability Reporting and Carbon-Credit Integration

Corporate agri-food buyers — Nestlé, Unilever, PepsiCo — are embedding Scope 3 emission targets into supply-chain procurement, requiring growers to document input efficiency [18]. Foliar feeding, which delivers nutrients at lower total application rates than broadcast soil methods, can generate measurable per-hectare emission reductions that qualify for insetting credits under protocols like the Verra VM0042 methodology. This ESG linkage creates a new value layer for the Foliar Spray Market beyond yield improvement alone.

Climate Adaptation and Stress-Responsive Foliar Nutrition

Rising heat-stress events and erratic monsoon patterns are increasing the frequency of nutrient lockout in root zones, making foliar delivery a climate-resilience tool rather than a convenience input. The IPCC's Sixth Assessment projects that heat-related yield losses in South Asia could reach 10–25% by 2050 without adaptive interventions [11]. Foliar potassium and silicon sprays have demonstrated measurable heat-tolerance benefits in rice and wheat, positioning the Foliar Spray Market as a critical component of national climate-adaptation strategies.


Foliar Spray Market Segmentation

By Chemical Type

Segment Key Metric Primary Demand Driver
Nitrogenous ~37% share (2025) Urea-based foliar top-dressing in cereals
Phosphatic 5.40% CAGR (2026–2035) Early-season root-priming sprays in row crops
Potassic USD 1.22 Billion (2025) Fruit quality and drought-stress mitigation
Calcium ~9% share (2025) Bitter-pit prevention in apples; fruit firmness
Micronutrients 6.05% CAGR (2026–2035) Zinc, boron, iron deficiency correction
Others USD 0.41 Billion (2025) Sulfur, magnesium, and specialty chelates


Nitrogenous foliar feeds remain the backbone of the Foliar Spray Market because urea — the most common active — is inexpensive, highly soluble, and compatible with most tank-mix partners. However, micronutrients are closing the gap in growth rate as soil-test awareness programs reveal widespread zinc and boron deficiency across South Asian, Latin American, and African cropping systems. Zinc-EDTA and boron-ethanolamine chelates are the preferred formulations for high-value horticultural crops, where even marginal nutrient corrections translate into premium pricing at the pack-house.

By Product Form

Segment Key Metric Primary Demand Driver
Liquid ~79% share (2025) Ready-to-use convenience; drone and boom compatibility
Powder 5.75% CAGR (2026–2035) Lower transport cost; longer shelf life in tropical climates


Liquids dominate the Foliar Spray Market because they eliminate the dissolution step, reduce clogging risk in fine-nozzle systems, and facilitate precise dose metering. Powder formulations, while smaller in revenue share, are gaining traction in tropical developing markets where cold-chain logistics are limited, and the lower per-unit shipping weight translates into meaningful cost savings for last-mile distributors. Soluble-powder micronutrient sachets targeted at smallholders represent a growing niche within this segment.

By Source

Segment Key Metric Primary Demand Driver
Synthetic ~84% share (2025) Cost efficiency; broad-spectrum nutrient range
Bio-based / Organic 5.88% CAGR (2026–2035) Organic certification; EU regulatory preference


Synthetic formulations still command the vast majority of Foliar Spray Market sales because they offer predictable nutrient content, wide crop-label registrations, and lower cost per unit of active ingredient. Bio-based products — seaweed extracts, amino-acid complexes, and humic-acid blends — are growing faster because organic-certified acreage is expanding at roughly 10% per annum globally, and premium retail pricing for organic produce absorbs the higher input cost [14].

By Application

Segment Key Metric Primary Demand Driver
Horticulture Crops ~47% share (2025) High-value vegetables and flowers; quality premiums
Agriculture Crops USD 2.79 Billion (2025) Cereal and oilseed foliar top-dressing
Orchard Crops 6.0% CAGR (2026–2035) Fruit quality, shelf life, and export standards
Others ~5% share (2025) Turf, ornamentals, and forestry nurseries


Horticulture crops lead the Foliar Spray Market because vegetable and flower growers operate on tight quality margins where even small improvements in color, firmness, or nutrient density justify multiple foliar passes per season. Orchard crops — citrus, apples, stone fruit, and avocados — represent the fastest-growing application segment as global fresh-fruit trade volumes expand and importing countries tighten maximum-residue-limit (MRL) standards, favoring foliar nutrient sprays over soil-applied chemicals that carry higher environmental-persistence risk.


Regional Market Share Analysis

Region Key Metric Primary Investment Themes
Asia-Pacific ~42% revenue share (2025) Rice and vegetable foliar programs; drone spraying
North America ~22% revenue share (2025) Specialty crops; variable-rate technology
Europe USD 1.70 Billion (2025) Organic compliance; bio-based formulations
South America 6.25% CAGR (2026–2035) Soybean and coffee nutrient management
Middle East & Africa USD 0.48 Billion (2025) Protected agriculture; food-security programs
Total USD 8.72 Billion (2025)

The Foliar Spray Market exhibits a clear geographic hierarchy, with Asia-Pacific commanding the largest revenue share and South America registering the steepest growth curve. Regional dynamics are shaped by crop-mix composition, government subsidy structures, and the pace of precision-agriculture adoption.


North America

Country Key Metric Key Driver
US ~72% of regional revenue Specialty crop quality mandates in CA, FL
Canada 5.45% CAGR (2026–2035) Canola and pulse foliar programs on the Prairies
Mexico USD 0.19 Billion (2025) Expanding greenhouse horticulture in Sinaloa and Jalisco


US demand is anchored in high-value fruit, nut, and vegetable acreage where foliar calcium and boron applications directly improve pack-out rates and reduce post-harvest losses. The USDA's Environmental Quality Incentives Program (EQIP) reimburses growers for nutrient-management plans that include foliar components, channeling over USD 1.8 billion annually into conservation-practice adoption [2].

Europe

Country Key Metric Key Driver
Germany ~21% of regional revenue Arable-crop and sugar-beet foliar programs
UK 5.50% CAGR (2026–2035) Post-Brexit ELMS incentives for precision inputs
France USD 0.26 Billion (2025) Vineyard and cereal foliar nutrition
Italy ~14% of regional revenue Olive and citrus micronutrient management
Spain 5.65% CAGR (2026–2035) Intensive greenhouse horticulture in Almería
Nordic Countries USD 0.09 Billion (2025) Short growing season drives high-efficiency foliar feeds
Russia ~8% of regional revenue Wheat and sunflower acreage expansion
Rest of Europe 5.30% CAGR (2026–2035) EU Common Agricultural Policy incentive alignment


The EU's Farm to Fork strategy is the single most influential policy lever for the European Foliar Spray Market. By requiring measurable reductions in overall fertilizer use, the strategy incentivizes concentrated, high-efficiency foliar products that deliver more nutrient per unit of active ingredient. Spain's Almería greenhouse cluster — the largest concentration of protected horticulture in Europe — runs almost entirely on foliar and fertigation nutrition programs, and continued expansion of greenhouse acreage is pulling specialty foliar product demand upward [5].

Asia-Pacific

Country Key Metric Key Driver
China ~38% of regional revenue Rice, vegetable, and fruit foliar programs; drone adoption
India 6.10% CAGR (2026–2035) Soil Health Card–driven micronutrient foliar use
Japan USD 0.31 Billion (2025) Premium fruit production with targeted nutrient sprays
South Korea ~5% of regional revenue Smart-farm integration and high-value horticulture
ASEAN 5.95% CAGR (2026–2035) Palm oil, rice, and rubber foliar management
Rest of Asia-Pacific USD 0.18 Billion (2025) Emerging markets and smallholder intensification


Asia-Pacific's dominance in the Foliar Spray Market is structural: the region cultivates more than half of global rice acreage and a disproportionate share of vegetables, both crops where foliar zinc, iron, and boron sprays materially improve grain quality and vegetable shelf life. China's agricultural drone fleet — the world's largest — is converting traditional knapsack-sprayed foliar programs into mechanized, ultra-low-volume applications, dramatically reducing labor costs and enabling coverage of hilly terrain that ground rigs cannot serve [9].

South America

Country Key Metric Key Driver
Brazil ~62% of regional revenue Soybean, coffee, and sugarcane foliar programs
Argentina 6.15% CAGR (2026–2035) Wheat and soybean foliar supplementation
Rest of South America USD 0.10 Billion (2025) Expanding fruit and vegetable acreage


Brazil's status as the world's largest soybean and coffee producer positions it as the growth engine for the South American Foliar Spray Market. Embrapa research has demonstrated that foliar manganese and molybdenum applications in soybean can lift yields by 8–12% on Cerrado soils with known deficiencies [17]. Argentine wheat growers increasingly adopt foliar nitrogen top-dressing to capitalize on short application windows during stem elongation, a practice that is also gaining traction in Uruguay and Paraguay.

Middle East & Africa

Country Key Metric Key Driver
Saudi Arabia ~28% of regional revenue NEOM and Vision 2030 agricultural projects
UAE 6.30% CAGR (2026–2035) Controlled-environment agriculture expansion
South Africa USD 0.07 Billion (2025) Citrus and wine-grape foliar nutrition
Egypt ~15% of regional revenue Nile Delta horticulture; government subsidy programs
Rest of MEA 5.80% CAGR (2026–2035) Donor-funded food-security interventions


The Middle East and Africa region is small in absolute terms but growing rapidly as governments invest in food self-sufficiency. The UAE's controlled-environment farms use foliar feeding as a primary nutrient-delivery mechanism, and Saudi Arabia's NEOM zone plans include large-scale hydroponic and aeroponic facilities that will require specialized foliar formulations [10]. In Sub-Saharan Africa, World Bank–funded programs are distributing foliar zinc spray kits to smallholders growing maize and rice, addressing micronutrient malnutrition in both crops and diets simultaneously [16].


Foliar Spray Market By Region, 2025-2035

Competitive Benchmarking

The Foliar Spray Market is moderately concentrated, with the top five companies holding an estimated 30–38% combined revenue share. The competitive field includes global fertilizer majors with dedicated foliar divisions alongside specialty formulators that compete on crop-specific efficacy data and regional distribution reach. Innovation in chelation chemistry, adjuvant technology, and digital agronomy platforms is increasingly differentiating market leaders from volume-driven commodity suppliers.

Company Est. Revenue Share Range Key Offerings for Foliar Spray Market Strategic Positioning
Yara International ~7–10% YaraVita micronutrient and calcium foliar lines Global distribution; digital agronomy integration via AtFarm
Nutrien Ltd. ~6–9% Loveland Products foliar fertilizers; crop-nutrition services Vertically integrated retail and wholesale channel
ICL Group ~5–7% ICL Specialty Fertilizers; Agroleaf Power range R&D focus on controlled-release foliar technologies
Haifa Group ~4–6% Haifa Bonus and Poly-Feed foliar grades Specialty-crop positioning; strong in greenhouse segment
Coromandel International ~3–5% Gromor and nano-fertilizer foliar products Leading position in Indian smallholder markets
The Mosaic Company ~3–5% MicroEssentials and specialty foliar blends Phosphate and potash integration; North American base
K+S AG ~2–4% EPSO foliar fertilizers (magnesium sulfate–based) European arable and specialty-crop focus
EuroChem Group ~2–4% Foliar NPK and micronutrient solutions CIS and emerging-market distribution networks
Valagro (Syngenta Group) ~2–3% Bio-stimulant and amino-acid foliar lines Bio-based innovation leader; global crop-trial network
COMPO Expert ~2–3% Basfoliar range; specialty turf and horticulture feeds Niche positioning in high-margin professional segments


Recent News & Developments


  • European Commission (July 2024): Published updated guidance under the Fertilising Products Regulation 2019/1009, simplifying the registration pathway for bio-based foliar products across EU member states [14].
  • DJI Agriculture (April 2024): Released the Agras T50 drone with an upgraded centrifugal atomization system optimized for foliar nutrient sprays, achieving 30% finer droplet uniformity than its predecessor [9].


  • Haifa Group (August 2023): Expanded its controlled-environment agriculture division, launching a tailored foliar nutrient line for vertical-farm lettuce and herb production in the Gulf Cooperation Council countries [10].


Foliar Spray Market Report Scope

Parameter Detail
Market Scope Global Foliar Spray Market — production, distribution, and end-use consumption of foliar nutrient products
Study Period 2021–2035
CAGR (Forecast) 5.70% (2026–2035)
Base Year Market Size USD 8.72 Billion (2025)
Forecast Endpoint USD 15.19 Billion (2035)
Fastest Growing Segment Micronutrients by chemical type; orchard crops by application
Companies Profiled 10 (Yara, Nutrien, ICL, Haifa, Coromandel, Mosaic, K+S, EuroChem, Valagro, COMPO Expert)
Valuation Currency USD Billion


FAQs

How do foliar spray products interact with crop-protection tank mixes, and what compatibility risks should buyers evaluate?
Most foliar nutrients are tank-compatible with common fungicides and insecticides, but pH clashes — particularly between calcium-based feeds and copper fungicides — can cause precipitation and nozzle clogging. Always conduct a jar test before mixing unfamiliar products.
What shelf-life considerations distinguish liquid foliar formulations from powder alternatives in tropical supply chains?
Liquid chelates typically carry 12–18 month shelf lives under controlled storage, whereas soluble powders can remain stable for 24–36 months without cold-chain requirements. Tropical distributors often prefer powders to reduce spoilage losses.
How are carbon-credit protocols beginning to value foliar feeding over broadcast soil application?
Protocols like Verra VM0042 credit measurable input-efficiency gains, and foliar delivery's lower total application rates generate per-hectare emission reductions. Early-adopter growers in Brazil have registered insetting credits under corporate Scope 3 programs [18].
What minimum order volumes and lead times should procurement teams expect when sourcing specialty foliar chelates?
Specialty chelates — EDTA, DTPA, and amino-acid complexes — typically require 4–8 week lead times and minimum orders of 1–5 metric tonnes. Larger orders from integrated suppliers like ICL or Haifa can shorten lead times to 2–3 weeks.
How does the EU Fertilising Products Regulation 2019/1009 affect market entry for new bio-based foliar products?
The regulation created a harmonized CE-marking pathway that replaces 27 national registrations with a single filing. This cuts time-to-market from 3–5 years to roughly 18 months for compliant bio-based foliar formulations [14].
What role do adjuvant technologies play in differentiating premium foliar products from commodity grades?
Organosilicone and methylated-seed-oil adjuvants reduce surface tension and improve leaf wetting, increasing nutrient absorption by 20–40%. Premium foliar brands increasingly bundle proprietary adjuvant systems as a competitive differentiator.
Are there emerging use cases for foliar sprays in indoor vertical farming beyond traditional field agriculture?
Vertical farms use foliar calcium and silicon sprays to strengthen cell walls under artificial lighting, reducing tip-burn in lettuce and improving herb shelf life. This controlled-environment segment is a small but rapidly expanding niche for the Foliar Spray Market [10].    
Author
Author
Author Profile
Snehal Singh LinkedIn
Manager - Research
High acumen in analyzing complex macro & micro markets with more than 6 years of work experience in the field of market research. By implementing her analytical skills in forecasting and estimation into market research reports, she has expertise in Packaging, Construction, and Equipment domains. She handles a team size of 20-25 resources and ensures smooth running of the projects, associated marketing activities, and client servicing.
Co-Author
Co-Author Profile
Sakshi Gupta LinkedIn
Team Lead - Research
Currently a Team Lead in consumer goods, FMCG, and F&B, she translates rigorous research into decisive strategy. She develops GTM roadmaps, pricing architectures, and competitive benchmarks for companies across Europe, the US, and APAC. She synthesize insights, align cross-functional teams, and drive execution from brief to measurable outcomes. She leads end-to-end engagements with crisp analysis, compelling storytelling, and a strong command of Power BI, Tableau, SQL, and advanced research platforms.
Share::
Request Free Sample

Research Approach


Secondary Research

The secondary research process involved comprehensive analysis of agricultural regulatory databases, peer-reviewed agronomy journals, fertilizer industry publications, and authoritative agricultural organizations. Key sources included the US Department of Agriculture (USDA) National Agricultural Statistics Service (NASS), Environmental Protection Agency (EPA) Office of Chemical Safety and Pollution Prevention, European Food Safety Authority (EFSA) Plant Health Panel, EU Fertilizing Products Regulation (FPR 2019/1009) database, Food and Agriculture Organization (FAO) FAOSTAT Fertilizers by Nutrient database, International Fertilizer Association (IFA) Supply & Consumption Database, Indian Council of Agricultural Research (ICAR) Fertilizer Statistics, Indian Department of Fertilizers Annual Reports, National Organic Program (NOP) Section 205.601/602 regulations, US Geological Survey (USGS) Mineral Commodity Summaries, European Biostimulants Industry Council (EBIC) regulatory database, China Ministry of Agriculture and Rural Affairs (MARA) fertilizer registration database, Agriculture and Agri-Food Canada (AAFC) nutrient management guidelines, and national agricultural ministry reports from Brazil (MAPA), Australia (DAWE), and key producing regions. These sources were used to collect fertilizer consumption statistics, regulatory approval data for foliar formulations, crop yield studies, micronutrient deficiency regional mapping, and market landscape analysis for nitrogenous, phosphatic, potassic, micronutrient, and biostimulant foliar formulations.


Primary Research

During the primary research process, both supply-side and demand-side stakeholders were interviewed to gather qualitative and quantitative data. Supply-side sources included CEOs, VPs of Product Development, heads of Agronomy & Field Development, regulatory affairs managers, and commercial directors from foliar fertilizer manufacturers, specialty nutrient companies, and agricultural inputs OEMs. Certified agronomists, crop consultants, precision agriculture specialists, greenhouse operators, procurement leads from agricultural cooperatives, large-scale commercial farm managers, and category managers from agri-retail distributors were all examples of demand-side sources. Primary research confirmed market segmentation for liquid, powder, and soluble granule formulations, confirmed product development timelines for chelated micronutrients and bio-based stimulants, and gathered information on how people use ground spraying and aerial application technologies, how prices change when raw materials are volatile, and how subsidies work in important agricultural markets.

Primary Respondent Breakdown:

By Designation: C-level Primaries (32%), Director Level (30%), Others (38%)

By Region: North America (33%), Europe (29%), Asia-Pacific (32%), Rest of World (6%)

*Note: Tier 1 = >USD 10B revenue; Tier 2 = USD 1B-10B; Tier

Share::
Request Free Sample
Download Free Sample

Kindly complete the form below to receive a free sample of this Report

Share::
Request Free Sample
Download PDF ×

We do not share your information with anyone. However, we may send you emails based on your report interest from time to time. You may contact us at any time to opt-out.
















