Food Preservatives Market (2026 - 2035)

Food Preservatives Market Size, Share, Industry Trend & Analysis Research Report By Product Type (Synthetic, Natural), By Function (Antimicrobials, Antioxidants), By Form (Dry/Granular, Liquid), By Application (Bakery & Confectionery, Meat & Poultry, Ready Meals, Beverages, Dairy, Others), By Geography (North America, Europe, Asia-Pacific, South America, Middle East & Africa) - Forecast to 2035
ID: MRFR/FnB/0858-CR
200 Pages
Varsha More
Last Updated: July 15, 2026
Food Preservatives Market
Market Size
Forecast Period2026-2035
CAGR (2026-2035)5.42%
2025 Market SizeUSD 3.88 billion
2035 Market SizeUSD 6.56 billion
Key Players
Cargill, Inc.
Kerry Group plc
BASF SE
Corbion N.V.
Kemin Industries
Tate & Lyle plc
Opportunities
  • Biopreservation and Bacteriocin Commercialization
  • Intelligent Packaging Integration
  • Emerging Market Urbanization

Food Preservatives Market Summary

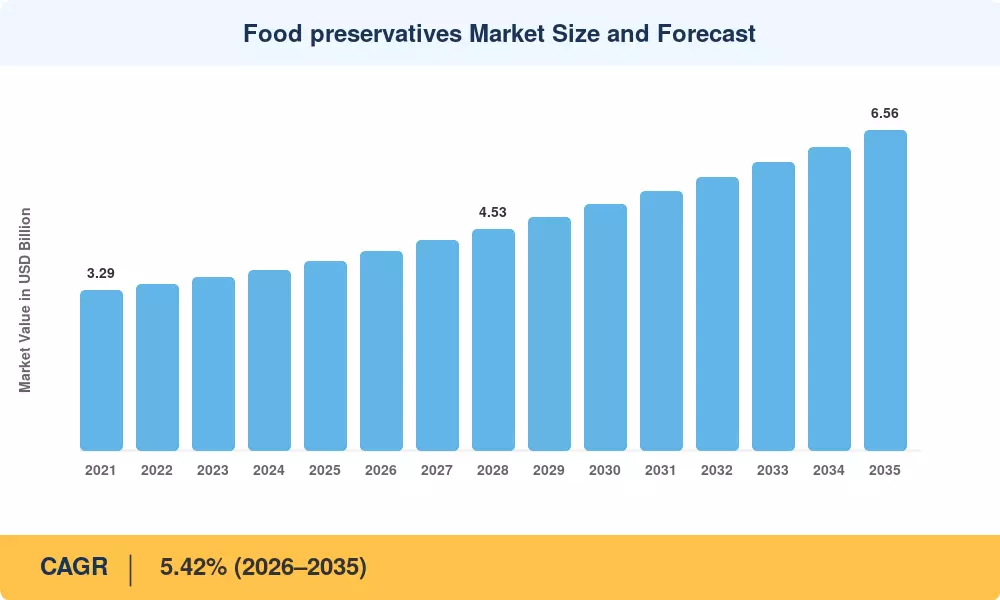
The Food Preservatives Market reached USD 3.88 billion in 2025 and is projected to grow from USD 4.08 billion in 2026 to USD 6.56 billion by 2035, registering a CAGR of 5.42% during the forecast period. This expansion tracks closely with tightening food safety mandates across the EU, the United States, and major Asia-Pacific economies. The European Commission's Farm-to-Fork Strategy, which targets a 50% reduction in hazardous chemical pesticides by 2030, has created significant ripple effects in how food manufacturers approach preservation — with clean-label reformulations drawing an estimated USD 4.2 billion in cumulative R&D investment between 2022 and 2025 [1].

A modest but profound revolution is taking place in the Food Preservatives Market at the ingredient level. Plant-derived and fermentation-based alternatives are supplementing – and in some product categories replacing – legacy synthetic formulations based on BHA, BHT and TBHQ. This technique has been growing in usage by an average of 18% each year from 2020 to 2024, allowing producers to use lower levels of chemical additives while still meeting the Food Safety Modernization Act (FSMA) of the Food and Drug Administration (FDA) microbiological safety goals [2].


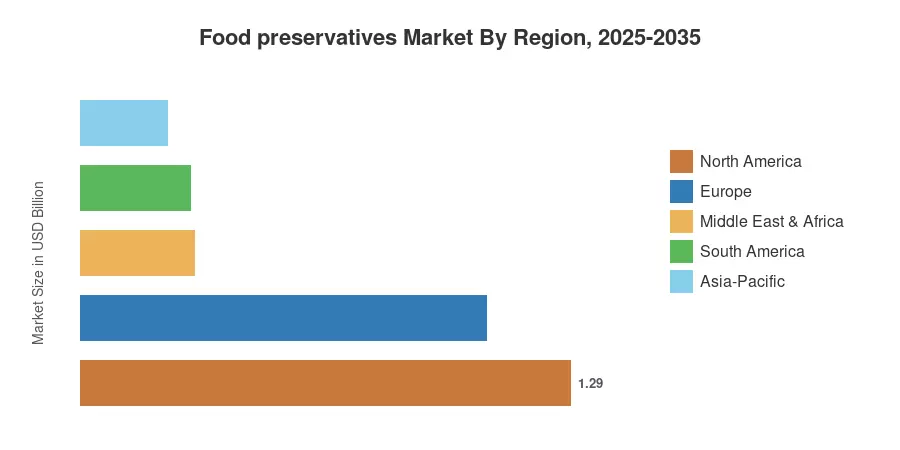
North America is expected to dominate the Food Preservatives Market on the regional level with a share of 33.2% in 2025, owing to the large-scale processed food manufacturing and robust regulatory framework. The Middle East & Africa region is predicted to be the fastest expanding, with a projected CAGR of 7.75% through 2035, powered by increased urbanization and gaps in cold-chain infrastructure that make extending shelf life a business imperative. Europe maintains the second-highest proportion of over 27.5% due to strict labeling provisions under Regulation (EU) No 1169/2011. In the next decade, the Food Preservatives Market is expected to revolve around biopreservation and intelligent packaging technologies that supplement classic additive tactics.


Key Report Takeaways

• By Product Type

  • Synthetic preservatives accounted for 54.6% of the Food Preservatives Market in 2025, reflecting continued reliance on cost-effective, broad-spectrum compounds across mass-market food manufacturing.
  • The natural preservatives segment is projected to expand at a 7.95% CAGR through 2035, driven by clean-label consumer preferences and regulatory incentives favoring plant-based ingredients.

• By Function

  • Antimicrobials represented 53.5% of the Food Preservatives Market share in 2025, underscoring the priority food producers place on microbial control across ambient and chilled supply chains.
  • Antioxidant-based preservatives are set to grow at a 6.75% CAGR, supported by rising demand for lipid oxidation control in snack foods, oils, and processed meats.

• By Application

  • Bakery and confectionery captured approximately 29.0% of the Food Preservatives Market in 2025, making it the single largest end-use category by volume.
  • Ready meals are advancing at a 7.95% CAGR through 2035, the fastest among application segments, as dual-income households and urban convenience culture reshape meal preparation habits worldwide.

• By Geography

  • North America retained a 33.2% share of the Food Preservatives Market in 2025.
  • The Middle East & Africa region is forecast to rise at a 7.75% CAGR, the fastest regional growth rate through 2035.


Food Preservatives Market Size and Forecast (2021–2035)

Market Research Future (MRFR) employs a hybrid technique to estimate the market size, which is a combination of bottom-up revenue and top-down validation using trade data from FAOSTAT and national customs databases. Historical characters (2021-2024) are tuned with published business revenues and validated import/export volumes. Forecast numbers (2026-2035) are derived from a compound annual growth path based on examination of the regulatory pipeline, surveys of consumer trends and macroeconomic data from the World Bank and IMF.
Food preservatives Market Size and Forecast
Our Impact
Enabled $4.3B Revenue Impact for Fortune 500 and Leading Multinationals
Partnering with 2000+ Global Organizations Each Year
30K+ Citations by Top-Tier Firms in the Industry

Driver Impact Analysis

Driver ~% Impact on CAGR Geographic Relevance Impact Timeline
Processed and convenience food demand growth ~22% Global Short-term (≤2 yr)
Clean-label and natural preservative transition ~20% North America, Europe Medium-term (2–4 yr)
Food safety regulation tightening (FSMA, EU) ~18% North America, Europe Short-term (≤2 yr)
Cold-chain infrastructure gaps in emerging economies ~15% MEA, South America, Asia-Pacific Long-term (≥4 yr)
Ready-to-eat meal category expansion ~12% Asia-Pacific, North America Medium-term (2–4 yr)
Biopreservation and fermentation technology advances ~8% Europe, North America Long-term (≥4 yr)
E-commerce food distribution growth ~5% Global Medium-term (2–4 yr)


Processed and Convenience Food Demand

Global processed food sales exceeded USD 4.1 Trillion in 2024, according to estimates, with ready-to-eat and shelf-stable categories growing at roughly twice the rate of fresh food retail. Urbanization — the UN projects 68% of the world's population will live in cities by 2050 — compresses meal preparation time and shifts consumption toward packaged foods that depend on preservative systems for safety and shelf life. In India alone, the packaged food sector expanded at 14.2% annually between 2020 and 2024, creating significant new addressable volume for the Food Preservatives Market [10].

Clean-Label Regulatory Momentum

The European Commission's proposed revision of Regulation (EC) No 1333/2008 on food additives includes stricter re-evaluation timelines for synthetic preservatives, with EFSA completing reassessments of sorbic acid, benzoic acid, and nitrites by 2027 [7]. In the United States, California's AB 418 (signed October 2023) banned four synthetic food additives — setting a legislative precedent that multiple states are now replicating. These regulatory actions are accelerating reformulation budgets, with the top 20 global food manufacturers collectively spending an estimated USD 1.8 billion on clean-label R&D in 2024 alone [1].

Food Safety Regulation and FSMA Compliance

The FDA's FSMA Preventive Controls for Human Food rule requires all registered food facilities to implement hazard analysis and risk-based preventive controls, directly driving demand for validated preservative systems. Compliance costs averaged USD 13,000 per small facility and over USD 200,000 per large manufacturing plant between 2021 and 2024 [6]. This regulatory layer creates a structural floor under the Food Preservatives Market, as manufacturers cannot economically distribute products without demonstrated microbial control protocols.

Cold-Chain Deficits in Emerging Economies

The Global Cold Chain Alliance estimates that sub-Saharan Africa loses approximately 37% of perishable food production post-harvest due to inadequate refrigeration infrastructure [9]. In Southeast Asian markets, cold-chain coverage reaches only 10–15% of what comparable demand levels require in developed economies. These gaps create outsized demand for chemical and natural preservative solutions capable of extending ambient shelf life — positioning the Food Preservatives Market for disproportionate growth in these regions through 2035.


Restraints Impact Analysis

The negative impact percentages below are directional estimates and should not be subtracted from the CAGR figure. They reflect structural headwinds that moderate growth velocity in the Food Preservatives Market.

Restraint ~% Negative Impact on CAGR Geographic Relevance Impact Timeline
Consumer backlash against synthetic additives ~−25% North America, Europe Short-term (≤2 yr)
Regulatory bans on specific preservatives ~−22% Europe, Asia-Pacific Medium-term (2–4 yr)
Cost premium of natural preservatives ~−20% Global Short-term (≤2 yr)
Raw material supply volatility (sorbates, benzoates) ~−18% Global Medium-term (2–4 yr)
Performance limitations of plant-based alternatives ~−15% Global Long-term (≥4 yr)


Consumer Resistance to Synthetic Additives

A 2024 International Food Information Council (IFIC) survey found that 58% of U.S. consumers actively avoid products listing artificial preservatives on the label, up from 43% in 2019 [13]. This perception gap between regulatory safety assessments and consumer sentiment creates a challenging dynamic for the Food Preservatives Market: approved synthetic preservatives that are toxicologically validated face commercial rejection based on label optics. The trend is most acute in premium and organic-adjacent categories, where "no artificial preservatives" has become a baseline positioning requirement.

Regulatory Restrictions on Specific Compounds

Beyond California's AB 418, the European Parliament has tightened acceptable daily intake (ADI) limits for nitrites and nitrates in processed meats, effective 2025, reducing maximum permitted concentrations by approximately 20% [7]. Japan's Ministry of Health revised its food additive positive list in 2024, removing three synthetic preservatives from approved use. Each regulatory restriction narrows the formulation toolkit available to manufacturers and increases reformulation costs — a structural headwind that will continue to constrain segments of the Food Preservatives Market throughout the forecast period.

Natural Preservative Cost Premiums

Plant-derived and fermentation-based preservatives typically cost 2.5× to 4× more per kilogram than their synthetic equivalents, creating significant adoption barriers in cost-sensitive product categories and price-competitive emerging markets. While this premium is expected to narrow as production scales, the cost differential remains the single largest obstacle to faster natural-segment penetration within the Food Preservatives Market.


Food Preservatives Market Opportunities

Biopreservation and Bacteriocin Commercialization

Bacteriocins — antimicrobial peptides produced by lactic acid bacteria — represent a USD 280 million addressable opportunity within the Food Preservatives Market by 2030, according to industry consortium estimates [11]. Nisin, the most commercially established bacteriocin, has an approved regulatory pathway in over 60 countries, and next-generation variants targeting Listeria and Clostridium species are entering pilot-scale production. Companies that secure early IP positions in bacteriocin engineering stand to capture premium margins in the natural antimicrobial segment.

Intelligent Packaging Integration

Active and intelligent packaging systems — incorporating oxygen scavengers, ethylene absorbers, and time-temperature indicators — create a complementary technology layer that reduces preservative loading while maintaining shelf-life targets. The global active packaging market is projected to reach USD 28 billion by 2030, and preservative manufacturers that develop co-optimized systems (packaging plus ingredient) can capture value beyond the traditional additive sale. This integration trend is particularly relevant for the ready meals and fresh-cut produce categories within the Food Preservatives Market.

Emerging Market Urbanization

Sub-Saharan Africa's urban population is forecast to double between 2025 and 2050, creating approximately 900 million new urban consumers who will increasingly depend on packaged and processed foods [9]. South and Southeast Asia follow similar trajectories. For the Food Preservatives Market, this demographic shift represents a structural demand tailwind that is largely independent of regulatory or consumer preference cycles in developed economies.

Clean-Label Data Monetization and Certification Services

The proliferation of clean-label certification programs — including Non-GMO Project Verified, Clean Label Project, and retailer-specific standards — creates an opportunity for preservative suppliers to offer formulation consulting, compliance documentation, and certification support as value-added services. This services layer can generate recurring revenue streams beyond ingredient sales, with gross margins estimated at 45–60% compared to 20–30% for commodity preservative ingredients.

Fermentation-Derived Preservative Platforms

Precision fermentation enables the production of nature-identical preservative compounds at an industrial scale with significantly lower agricultural footprint than plant extraction. Companies like Corbion and Galactic are investing in fermentation capacity expansion, targeting cost parity with synthetic alternatives by 2028–2030 [11]. This technology pathway could reshape the competitive structure of the Food Preservatives Market by collapsing the cost-performance gap between natural and synthetic segments.


Food Preservatives Market Future Outlook

Precision Fermentation and Synthetic Biology

Synthetic biology platforms are expected to deliver a new generation of nature-identical preservative compounds at cost parity with petrochemical-derived alternatives by 2029–2031. The U.S. Department of Energy's National Biotechnology and Biomanufacturing Initiative has committed USD 2 billion to scale bio-based chemical production, with food-grade preservative intermediates explicitly included in the program's scope [19]. This technology shift will blur the line between "natural" and "synthetic" classifications within the Food Preservatives Market, potentially requiring new regulatory frameworks.

AI-Driven Formulation Optimization

Machine learning models are transforming preservative system design by predicting antimicrobial efficacy, oxidation kinetics, and organoleptic impact across complex food matrices. Companies, including Kerry Group and dsm-firmenich have deployed AI formulation platforms that reduce development cycles from 12–18 months to 3–5 months [20]. Over the next decade, AI-driven optimization will become a competitive differentiator in the Food Preservatives Market, enabling rapid customization for regional taste profiles and regulatory requirements.

Circular Economy and Upcycled Preservatives

The extraction of bioactive preservative compounds from food processing waste streams — grape pomace polyphenols, citrus peel extracts, olive mill wastewater antioxidants — aligns with circular economy mandates and ESG reporting requirements. The FAO estimates that approximately 1.3 billion tonnes of food are wasted globally each year, and valorization of this waste into functional ingredients represents a multi-billion dollar opportunity adjacent to the Food Preservatives Market [21]. Regulatory pathways for upcycled ingredients are maturing, with the EU Novel Food Regulation providing a clear approval route.

Blockchain-Enabled Traceability and Preservative Transparency

Consumer demand for ingredient traceability is driving blockchain adoption across food supply chains, with direct implications for preservative sourcing documentation. IBM Food Trust and similar platforms now track preservative ingredient provenance from raw material origin through final product application. By 2030, an estimated 35% of global food retail will require digital traceability documentation for all additive ingredients — creating new compliance infrastructure requirements for participants in the Food Preservatives Market [22].


Food Preservatives Market Segmentation

By Product Type

Segment Key Metric Primary Demand Driver
Synthetic 54.6% share (2025) Cost-efficiency in mass production
Natural 7.95% CAGR (2026–2035) Clean-label consumer demand


Synthetic preservatives continue to dominate the Food Preservatives Market by value, anchored by decades of regulatory approval, established supply chains, and cost advantages that natural alternatives have not yet matched. Benzoic acid derivatives, sorbic acid salts, and sulfite compounds remain the workhorses of ambient-stable food preservation. The segment's share is gradually declining, however, as reformulation activity shifts volume toward natural alternatives — particularly in premium and organic product tiers where label perception drives purchase decisions.

Natural preservatives represent the high-growth frontier. Rosemary extract, green tea catechins, and citrus-derived compounds are gaining commercial traction as drop-in replacements for synthetic antioxidants, while nisin and natamycin address antimicrobial applications. The cost gap remains the primary adoption barrier for the natural segment within the Food Preservatives Market, but fermentation-based production is closing this differential at an estimated 8–12% annual rate.

By Function

Segment Key Metric Primary Demand Driver
Antimicrobials USD 2.08 billion (2025) Microbial safety compliance
Antioxidants 6.75% CAGR (2026–2035) Lipid oxidation control in processed foods


Antimicrobials command the largest functional category in the Food Preservatives Market because microbial contamination presents the most acute food safety risk — Salmonella, Listeria, and E. coli outbreaks carry regulatory, legal, and reputational consequences that make antimicrobial preservation non-negotiable for most manufacturers. Sorbates, benzoates, and propionates are the most widely deployed antimicrobial preservatives by volume globally.

Antioxidants are growing faster as processed food manufacturers address oxidative rancidity in lipid-rich products — snack foods, cooking oils, processed meats, and nut butters. Synthetic antioxidants like BHA and BHT face increasing consumer resistance, opening space for tocopherols, ascorbic acid, and plant-derived polyphenols to capture incremental volume in the Food Preservatives Market.

By Form

Segment Key Metric Primary Demand Driver
Dry/Granular 56.0% share (2025) Handling ease, dosing precision
Liquid 6.95% CAGR (2026–2035) Beverage and sauce applications


Dry and granular preservative formats dominate the Food Preservatives Market due to superior stability during storage, precise dosing characteristics, and compatibility with powder-blending operations common in bakery, confectionery, and snack manufacturing. Liquid systems are gaining share in beverage, dairy, and sauce applications where dissolution speed and uniform dispersion are critical processing requirements.

By Application

Segment Key Metric Primary Demand Driver
Bakery and Confectionery 29.0% share (2025) Mold and staling prevention
Meat and Poultry USD 0.83 billion (2025) Microbial safety, color retention
Ready Meals 7.95% CAGR (2026–2035) Convenience culture acceleration
Beverages 5.20% CAGR (2026–2035) Ambient distribution requirements
Dairy USD 0.35 billion (2025) Fermentation control, shelf extension
Others 4.85% CAGR (2026–2035) Diversifying the application base


Bakery and confectionery is the largest application segment in the Food Preservatives Market, as these products face constant mold spoilage risk during ambient storage and distribution. Propionates and sorbates are the primary antimicrobial agents in this category, while antioxidants protect fat-containing fillings and coatings from rancidity. The segment's dominance reflects both the category's large production volumes and the technical difficulty of preserving high-moisture, nutrient-rich bakery products without chemical intervention.

Ready meals represent the fastest-growing application, propelled by lifestyle shifts in dual-income households and single-person households globally. The complexity of multi-component meal systems — which combine proteins, carbohydrates, sauces, and vegetables with different spoilage profiles — demands sophisticated preservative blends that address multiple degradation pathways simultaneously. This complexity premium supports a higher per-unit preservative value within the Food Preservatives Market.


Regional Market Share Analysis

Region Key Metric Primary Investment Themes
North America 33.2% share (2025) Clean-label reformulation, FSMA compliance
Europe USD 1.07 billion (2025) EU additive regulation, natural transition
Asia-Pacific 5.85% CAGR (2026–2035) Processed food growth, cold-chain investment
South America USD 0.29 billion (2025) Meat export preservation, urbanization
Middle East & Africa 7.75% CAGR (2026–2035) Food import reliance, shelf-life needs
Total USD 3.88 billion (2025)

The Food Preservatives Market displays a geographically concentrated structure, with three regions — North America, Europe, and Asia-Pacific — accounting for over 85% of global value. Growth dynamics differ sharply: mature markets are driven by reformulation and regulatory compliance, while emerging regions are propelled by first-time preservative adoption in expanding processed food sectors.


North America

Country Key Metric Key Driver
US 78.5% of regional share FSMA enforcement, clean-label demand
Canada 5.62% CAGR Health Canada additive modernization
Mexico USD 0.09 billion Processed food export growth


The United States dominates North America's position in the Food Preservatives Market, with FSMA compliance requirements creating sustained baseline demand. California's AB 418 has triggered a nationwide reformulation cycle, with major CPG brands including General Mills, Kellogg's, and Conagra publicly committing to remove banned additives across their full product portfolios by 2026. Canada's regulatory modernization under the Safe Food for Canadians Act has harmonized preservative approval pathways, reducing time-to-market for novel natural compounds [6].

Europe

Country Key Metric Key Driver
Germany 5.18% CAGR Processed meat reformulation
UK 19.2% of regional share Post-Brexit additive framework
France USD 0.14 billion Clean-label consumer leadership
Italy 4.95% CAGR Cured meat and dairy tradition
Spain USD 0.09 billion Mediterranean diet preservation
Nordic Countries 5.55% CAGR Sustainability-driven reformulation
Russia USD 0.07 billion Import substitution processing
Rest of Europe 4.80% CAGR Regulatory alignment with EU standards


Europe's contribution to the Food Preservatives Market is shaped by the world's most prescriptive additive regulatory framework. EFSA's ongoing re-evaluation of all approved food additives under Regulation (EU) No 257/2010 has created sustained demand for reformulation expertise and alternative preservative technologies. The UK's departure from the EU regulatory umbrella initially created uncertainty but has since resulted in a parallel approval pathway under the Food Standards Agency that allows faster commercialization of novel preservative ingredients [7].

Asia-Pacific

Country Key Metric Key Driver
China 34.8% of regional share Scale manufacturing, export standards
India 8.15% CAGR Packaged food penetration growth
Japan USD 0.12 billion Premium food quality standards
South Korea 5.70% CAGR K-food export expansion
ASEAN USD 0.11 billion Tropical climate shelf-life challenges
Rest of Asia-Pacific 6.10% CAGR Emerging processing capacity


Asia-Pacific is the growth engine of the Food Preservatives Market, combining massive population bases with rapidly expanding processed food consumption. China's National Food Safety Standard GB 2760-2024 revision harmonized preservative maximum use levels with Codex Alimentarius guidelines, facilitating cross-border trade compliance [16]. India's Food Safety and Standards Authority (FSSAI) approved 12 new natural preservative compounds between 2022 and 2024, opening formulation pathways previously restricted to synthetic options.

South America

Country Key Metric Key Driver
Brazil 62.5% of regional share Meat export preservation systems
Argentina 5.40% CAGR Agricultural processing expansion
Rest of South America USD 0.04 billion Urbanization-driven demand


Brazil's dominant position in the South American Food Preservatives Market reflects its status as the world's largest beef and poultry exporter. Brazilian meat processors must comply with preservative standards from importing nations — including the EU, China, and the Middle East — creating demand for multi-standard preservative systems that satisfy diverse regulatory requirements simultaneously. Argentina's growing soybean and grain processing sector is adding new application categories for antioxidant preservatives [17].

Middle East & Africa

Country Key Metric Key Driver
Saudi Arabia 28.5% of regional share Vision 2030 food security investment
UAE 6.95% CAGR Food re-export hub demand
South Africa USD 0.04 billion Regional manufacturing leadership
Egypt 7.20% CAGR Population-driven consumption growth
Rest of MEA USD 0.08 billion Import-dependent preservation needs


The Middle East & Africa region offers the highest growth trajectory in the Food Preservatives Market, driven by a structural dependence on food imports that makes shelf-life extension a strategic priority. Saudi Arabia's National Food Security Strategy under Vision 2030 has allocated SAR 10 billion (approximately USD 2.7 billion) toward domestic food processing capacity, directly increasing preservative demand [18]. The UAE serves as a critical food re-export hub for the broader GCC, with Dubai's food trade zone handling over 30 million tonnes of food products annually.


Food preservatives Market By Region, 2025-2035

Competitive Benchmarking

The Food Preservatives Market is moderately concentrated, with the top five players projected to account for an estimated 32–38% of global revenue. The Herfindahl-Hirschman Index (HHI) is between 800 and 1,200, suggesting a fragmented to moderately concentrated market. The competition is separated by preservative type, with big chemical producers often having higher concentrations of synthetic preservatives. The natural category is more fragmented, with specialized biotech and ingredient firms vying against diversified players.

Company Est. Revenue Share Range Key Offerings Strategic Positioning
Cargill, Inc. ~7–10% Antimicrobial blends, citric acid systems Vertically integrated supply chain
Kerry Group plc ~6–9% Clean-label preservative systems, taste solutions Formulation-led innovation
BASF SE ~5–8% Synthetic antioxidants, sorbic acid derivatives Chemical scale and global reach
Corbion N.V. ~4–7% Lactic acid-based preservation, natural mold inhibitors Fermentation technology leader
Kemin Industries ~4–6% Plant-derived antioxidants, liquid preservative systems Natural-first positioning
Tate & Lyle plc ~3–5% Specialty food protection solutions Clean-label reformulation partner
dsm-firmenich ~3–5% Natamycin, nisin, fermentation-based antimicrobials Biopreservation R&D depth
Galactic S.A. ~2–4% Lactic acid, antimicrobial blends Fermentation specialist
Jungbunzlauer Suisse AG ~2–4% Citric acid, gluconates, xanthan gum Biodegradable preservation ingredients
Nouryon ~2–3% Chelating agents, specialty organic acids Industrial-scale specialty chemicals


Recent News & Developments


  • European Food Safety Authority (EFSA) (September 2024): Published revised safety assessments for potassium sorbate and sodium benzoate, confirming current ADI levels but recommending enhanced monitoring of cumulative dietary exposure in children [7].


  • Food Safety and Standards Authority of India (FSSAI) (November 2023): Approved the use of nisin as a preservative in an expanded range of dairy and bakery products, widening the addressable market for biopreservation ingredients in India [16].


Food Preservatives Market Report Scope

Parameter Detail
Market Scope Global Food Preservatives Market — production, trade, and consumption of synthetic and natural food preservation ingredients
Study Period 2021–2035
CAGR (Forecast Period) 5.42% (2026–2035)
Market Size — Base Year (2025) USD 3.88 billion
Market Size — Forecast Endpoint (2035) USD 6.56 billion
Fastest Growing Segment Ready Meals (by application); Natural (by product type); Middle East & Africa (by region)
Companies Profiled Cargill, Kerry Group, BASF, Corbion, Kemin Industries, Tate & Lyle, DSM-Firmenich, Galactic, Jungbunzlauer, Nouryon
Valuation Currency USD billion


FAQs

How do preservative reformulation costs compare between small and large food manufacturers?
Small manufacturers typically spend USD 50,000–150,000 per SKU on reformulation, while large CPG firms average USD 15,000–30,000 per SKU due to economies of scale in testing and regulatory compliance.
Which preservative testing certifications do global retailers most commonly require?
Most major retailers require BRC Global Standards or SQF certification for preservative-containing products. Walmart and Costco additionally mandate third-party shelf-life validation studies.
How does tropical climate distribution affect preservative selection versus temperate regions?
Tropical supply chains demand 30–50% higher antimicrobial concentrations due to accelerated microbial growth at elevated temperatures and humidity levels throughout distribution.
What role do encapsulation technologies play in improving preservative effectiveness?
Encapsulation enables controlled release of active compounds over extended periods, improving efficacy by 25–40% while reducing off-flavors associated with high initial preservative concentrations [11].
How are halal and kosher certification requirements shaping preservative sourcing decisions?
Manufacturers serving halal and kosher channels must source preservatives with documented production-chain compliance, often limiting supplier options and increasing procurement costs by 10–15%.
What insurance or liability considerations exist for manufacturers switching from synthetic to natural preservatives?
Product liability insurers typically require 12–18 months of accelerated shelf-life testing data before adjusting coverage terms for reformulated products using novel natural preservative systems.
How do private-label brands approach preservative strategy differently from national brands?
Private-label producers prioritize cost-optimized synthetic systems for baseline products, while selectively adopting natural preservatives only in premium tiers where retailer brand positioning demands clean-label credentials.    
Author
Author
Author Profile
Varsha More LinkedIn
Senior Research Analyst
Experienced business professional with a demonstrated history of working in the CFnB industry. Skilled in market research, and market estimation. Strong professional with a Masters focused in marketing management.

Research Approach


Secondary Research

The secondary research process involved comprehensive analysis of regulatory databases, peer-reviewed food science journals, industry publications, and authoritative food safety organizations. Key sources included the U.S. Food & Drug Administration (FDA), European Food Safety Authority (EFSA), U.S. Department of Agriculture (USDA), Food Safety and Inspection Service (FSIS), Health Canada, Food Safety and Standards Authority of India (FSSAI), National Health Commission of the People's Republic of China (NHC), Joint FAO/WHO Expert Committee on Food Additives (JECFA), Codex Alimentarius Commission, European Commission Directorate-General for Health and Food Safety (DG SANTE), Food Standards Australia New Zealand (FSANZ), National Institute of Food and Agriculture (NIFA), Institute of Food Technologists (IFT), International Food Additives Council (IFAC), Food Additives & Ingredients Association (FAIA), and global food trade databases including ITC Trade Map and USDA Foreign Agricultural Service (FAS) reports.

Safety assessment studies, clean-label trend analysis, import/export dynamics across synthetic and natural preservative categories, and regulatory approval data for sorbates, benzoates, nitrites, and natural preservatives were all gathered using these sources.


Primary Research

Qualitative and quantitative insights were obtained by interviewing supply-side and demand-side stakeholders during the primary research process. Supply-side sources encompassed global heads of food protection and preservation, vice presidents of product innovation, regulatory compliance directors, and commercial leaders from preservative manufacturers, ingredient suppliers, and specialty chemical companies. Demand-side sources included procurement chiefs and R&D directors from global food and beverage manufacturers, bakery and confectionery producers, dairy processors, meat and poultry processors, and beverage formulators. The primary research validated market segmentation across antimicrobial and antioxidant functions, confirmed clean-label transition timelines, and garnered insights on formulation challenges, pricing volatility of raw materials, and regional regulatory harmonization efforts.

Primary Respondent Distribution:

• By Designation: C-level Primaries (32%), Director Level (35%), Others (33%)

• By Region: North America (32%), Europe (30%), Asia-Pacific (28%), Rest of World (10%)


Market Size Estimation

Revenue mapping and volume consumption analysis were implemented to determine global market valuation. The methodology comprised the following:

• Identification of over 50 key manufacturers and ingredient suppliers in North America, Europe, Asia-Pacific, and Latin America

• Product mapping with respect to synthetic preservatives (sorbates, benzoates, propionates, nitrites), natural preservatives (rosemary extract, cultured dextrose, vinegar), and emergent clean-label solutions

• Examination of the annual revenues that have been reported and modeled for the food preservative portfolios and food protection ingredient divisions

• In 2024, the coverage of manufacturers will account for 75-80% of the global market share.

• Segment-specific valuations for antimicrobial and antioxidant functions are derived through extrapolation using bottom-up (application volume × ASP by country across bakery, dairy, beverages, meat, and confectionery) and top-down (manufacturer revenue validation and trade data triangulation) approaches.

Download Free Sample

Kindly complete the form below to receive a free sample of this Report

Download PDF ×

We do not share your information with anyone. However, we may send you emails based on your report interest from time to time. You may contact us at any time to opt-out.
















