Food Preservatives Market (2026 - 2035)

ID: MRFR/FnB/0858-CR
200 Pages
Varsha More
Last Updated: July 15, 2026
Food Preservatives Market Size, Share, Industry Trend & Analysis Research Report By Product Type (Synthetic, Natural), By Function (Antimicrobials, Antioxidants), By Form (Dry/Granular, Liquid), By Application (Bakery & Confectionery, Meat & Poultry, Ready Meals, Beverages, Dairy, Others), By Geography (North America, Europe, Asia-Pacific, South America, Middle East & Africa) - Forecast to 2035
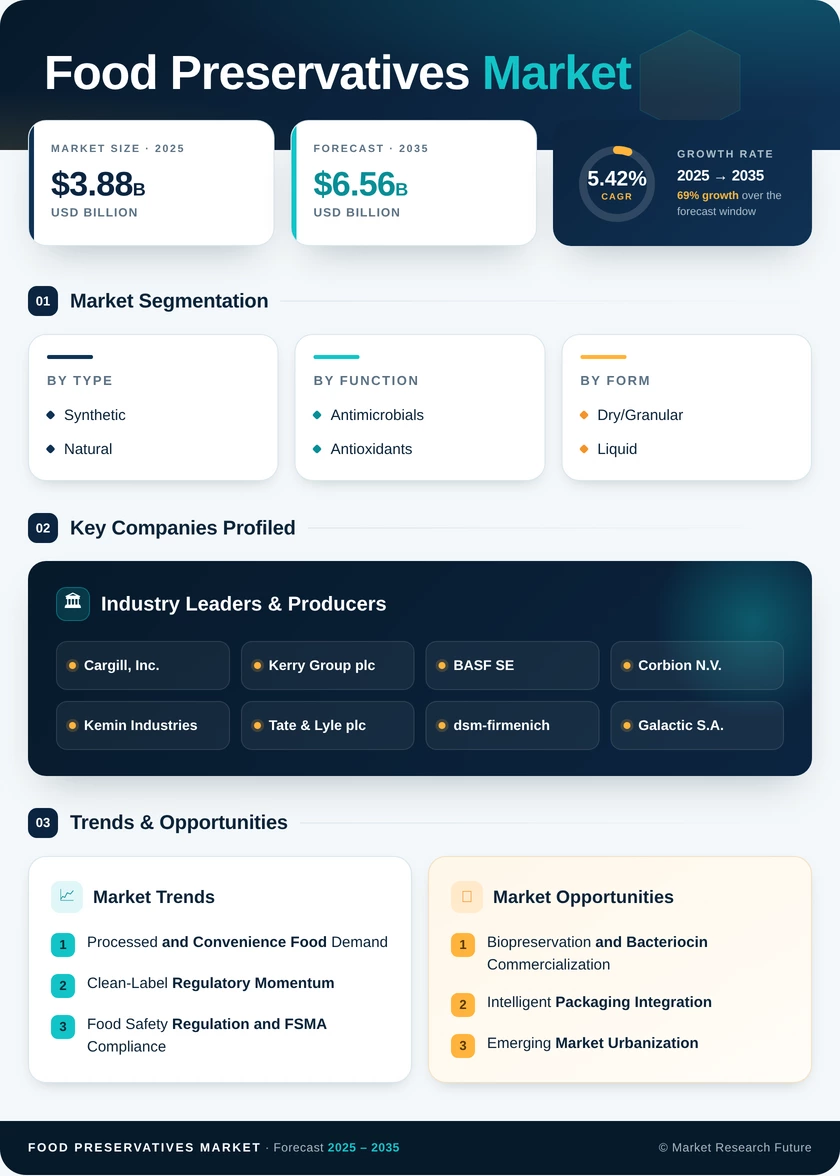
Food Preservatives Market
Market Size
Forecast Period2026-2035
CAGR (2026-2035)5.42%
2025 Market SizeUSD 3.88 billion
2035 Market SizeUSD 6.56 billion
Key Players
Cargill, Inc.
Kerry Group plc
BASF SE
Corbion N.V.
Kemin Industries
Tate & Lyle plc
Opportunities
  • Biopreservation and Bacteriocin Commercialization
  • Intelligent Packaging Integration
  • Emerging Market Urbanization
  1. 1 Market Overview |
    1. 1.1 Study Assumptions & Market Definition |
    2. 1.2 Scope of the Study |
    3. 1.3 Research Methodology
  2. 2 Market Summary & Key Takeaways
  3. 3 Market Dynamics |
    1. 3.1 Market Drivers Analysis | |
      1. 3.1.1 Processed and Convenience Food Demand Growth | |
      2. 3.1.2 Clean-Label and Natural Preservative Transition | |
      3. 3.1.3 Food Safety Regulation Tightening (FSMA, EU) | |
      4. 3.1.4 Cold-Chain Infrastructure Gaps in Emerging Economies | |
      5. 3.1.5 Ready-to-Eat Meal Category Expansion | |
      6. 3.1.6 Biopreservation and Fermentation Technology Advances | |
      7. 3.1.7 E-Commerce Food Distribution Growth |
    2. 3.2 Market Restraints Analysis | |
      1. 3.2.1 Consumer Backlash Against Synthetic Additives | |
      2. 3.2.2 Regulatory Bans on Specific Preservatives | |
      3. 3.2.3 Cost Premium of Natural Preservatives | |
      4. 3.2.4 Raw Material Supply Volatility (Sorbates, Benzoates) | |
      5. 3.2.5 Performance Limitations of Plant-Based Alternatives |
    3. 3.3 Market Opportunity Analysis | |
      1. 3.3.1 Biopreservation and Bacteriocin Commercialization | |
      2. 3.3.2 Intelligent Packaging Integration | |
      3. 3.3.3 Emerging Market Urbanization | |
      4. 3.3.4 Clean-Label Data Monetization and Certification Services | |
      5. 3.3.5 Fermentation-Derived Preservative Platforms |
    4. 3.4 Industry Value Chain Analysis |
    5. 3.5 Porter's Five Forces Analysis
  4. 4 Global Food Preservatives Market Size & Forecast (2021–2035) |
    1. 4.1 Historical Market Size (2021–2025) |
    2. 4.2 Current & Forecast Market Size (2026–2035) |
    3. 4.3 Market Size by Revenue (USD billion) |
    4. 4.4 Year-over-Year Growth Analysis
  5. 5 Segmentation Analysis |
    1. 5.1 By Product Type | |
      1. 5.1.1 Synthetic | |
      2. 5.1.2 Natural |
    2. 5.2 By Function | |
      1. 5.2.1 Antimicrobials | |
      2. 5.2.2 Antioxidants |
    3. 5.3 By Form | |
      1. 5.3.1 Dry/Granular | |
      2. 5.3.2 Liquid |
    4. 5.4 By Application | |
      1. 5.4.1 Bakery and Confectionery | |
      2. 5.4.2 Meat and Poultry | |
      3. 5.4.3 Ready Meals | |
      4. 5.4.4 Beverages | |
      5. 5.4.5 Dairy | |
      6. 5.4.6 Others
  6. 6 Regional Analysis |
    1. 6.1 North America | |
      1. 6.1.1 United States | |
      2. 6.1.2 Canada | |
      3. 6.1.3 Mexico |
    2. 6.2 Europe | |
      1. 6.2.1 Germany | |
      2. 6.2.2 United Kingdom | |
      3. 6.2.3 France | |
      4. 6.2.4 Italy | |
      5. 6.2.5 Spain | |
      6. 6.2.6 Nordic Countries | |
      7. 6.2.7 Russia | |
      8. 6.2.8 Rest of Europe |
    3. 6.3 Asia-Pacific | |
      1. 6.3.1 China | |
      2. 6.3.2 India | |
      3. 6.3.3 Japan | |
      4. 6.3.4 South Korea | |
      5. 6.3.5 ASEAN | |
      6. 6.3.6 Rest of Asia-Pacific |
    4. 6.4 South America | |
      1. 6.4.1 Brazil | |
      2. 6.4.2 Argentina | |
      3. 6.4.3 Rest of South America |
    5. 6.5 Middle East & Africa | |
      1. 6.5.1 Saudi Arabia | |
      2. 6.5.2 UAE | |
      3. 6.5.3 South Africa | |
      4. 6.5.4 Egypt | |
      5. 6.5.5 Rest of MEA
  7. 7 Competitive Landscape |
    1. 7.1 Market Share Analysis (2025) |
    2. 7.2 Competitive Benchmarking Matrix |
    3. 7.3 Company Profiles | |
      1. 7.3.1 Cargill, Inc. | |
      2. 7.3.2 Kerry Group plc | |
      3. 7.3.3 BASF SE | |
      4. 7.3.4 Corbion N.V. | |
      5. 7.3.5 Kemin Industries | |
      6. 7.3.6 Tate & Lyle plc | |
      7. 7.3.7 dsm-firmenich | |
      8. 7.3.8 Galactic S.A. | |
      9. 7.3.9 Jungbunzlauer Suisse AG | |
      10. 7.3.10 Nouryon
  8. 8 Future Outlook & Strategic Recommendations (2026–2035) |
    1. 8.1 Precision Fermentation and Synthetic Biology |
    2. 8.2 AI-Driven Formulation Optimization |
    3. 8.3 Circular Economy and Upcycled Preservatives |
    4. 8.4 Blockchain-Enabled Traceability and Preservative Transparency
  9. 9 Recent Developments & News
  10. 10 Frequently Asked Questions (FAQs)
  11. 11 Report Scope & Methodology |
    1. 11.1 Study Period & Base Year |
    2. 11.2 Data Sources & Citations |
    3. 11.3 Abbreviations
  12. 12 LIST OF TABLES |
  13. TABLE 1 Global Food Preservatives Market Size & Forecast, by Revenue (USD billion), 2021–2035 |
  14. TABLE 2 Global Food Preservatives Market – Year-over-Year Growth Analysis, 2021–2035 |
  15. TABLE 3 Global Food Preservatives Market – Driver Impact Analysis |
  16. TABLE 4 Global Food Preservatives Market – Restraint Impact Analysis |
  17. TABLE 5 Global Food Preservatives Market Size, by Product Type, 2021–2035 (USD billion) |
  18. TABLE 6 Global Food Preservatives Market Size, by Function, 2021–2035 (USD billion) |
  19. TABLE 7 Global Food Preservatives Market Size, by Form, 2021–2035 (USD billion) |
  20. TABLE 8 Global Food Preservatives Market Size, by Application, 2021–2035 (USD billion) |
  21. TABLE 9 Global Food Preservatives Market Size, by Region, 2021–2035 (USD billion) |
  22. TABLE 10 North America Food Preservatives Market Size, by Country, 2021–2035 (USD billion) |
  23. TABLE 11 Europe Food Preservatives Market Size, by Country, 2021–2035 (USD billion) |
  24. TABLE 12 Asia-Pacific Food Preservatives Market Size, by Country, 2021–2035 (USD billion) |
  25. TABLE 13 South America Food Preservatives Market Size, by Country, 2021–2035 (USD billion) |
  26. TABLE 14 Middle East & Africa Food Preservatives Market Size, by Country, 2021–2035 (USD billion) |
  27. TABLE 15 North America Food Preservatives Market Size, by Product Type, 2021–2035 (USD billion) |
  28. TABLE 16 North America Food Preservatives Market Size, by Function, 2021–2035 (USD billion) |
  29. TABLE 17 North America Food Preservatives Market Size, by Form, 2021–2035 (USD billion) |
  30. TABLE 18 North America Food Preservatives Market Size, by Application, 2021–2035 (USD billion) |
  31. TABLE 19 Europe Food Preservatives Market Size, by Product Type, 2021–2035 (USD billion) |
  32. TABLE 20 Europe Food Preservatives Market Size, by Function, 2021–2035 (USD billion) |
  33. TABLE 21 Europe Food Preservatives Market Size, by Form, 2021–2035 (USD billion) |
  34. TABLE 22 Europe Food Preservatives Market Size, by Application, 2021–2035 (USD billion) |
  35. TABLE 23 Asia-Pacific Food Preservatives Market Size, by Product Type, 2021–2035 (USD billion) |
  36. TABLE 24 Asia-Pacific Food Preservatives Market Size, by Function, 2021–2035 (USD billion) |
  37. TABLE 25 Asia-Pacific Food Preservatives Market Size, by Form, 2021–2035 (USD billion) |
  38. TABLE 26 Asia-Pacific Food Preservatives Market Size, by Application, 2021–2035 (USD billion) |
  39. TABLE 27 South America Food Preservatives Market Size, by Product Type, 2021–2035 (USD billion) |
  40. TABLE 28 South America Food Preservatives Market Size, by Function, 2021–2035 (USD billion) |
  41. TABLE 29 South America Food Preservatives Market Size, by Form, 2021–2035 (USD billion) |
  42. TABLE 30 South America Food Preservatives Market Size, by Application, 2021–2035 (USD billion) |
  43. TABLE 31 Middle East & Africa Food Preservatives Market Size, by Product Type, 2021–2035 (USD billion) |
  44. TABLE 32 Middle East & Africa Food Preservatives Market Size, by Function, 2021–2035 (USD billion) |
  45. TABLE 33 Middle East & Africa Food Preservatives Market Size, by Form, 2021–2035 (USD billion) |
  46. TABLE 34 Middle East & Africa Food Preservatives Market Size, by Application, 2021–2035 (USD billion) |
  47. TABLE 35 Competitive Benchmarking Matrix – Global Food Preservatives Market, 2025 |
  48. TABLE 36 Company Profiles – Key Players, Global Food Preservatives Market |
  49. TABLE 37 Recent Developments & Strategic Announcements, 2023–2025 |
  50. TABLE 38 Report Scope & Methodology Summary |
  51. TABLE 39 Detailed Sources and Citations
  52. 13 LIST OF FIGURES |
  53. FIGURE 1 Global Food Preservatives Market Dynamics (Drivers, Restraints, Opportunities) |
  54. FIGURE 2 Industry Value Chain Analysis – Food Preservatives Market |
  55. FIGURE 3 Porter's Five Forces Analysis – Food Preservatives Market |
  56. FIGURE 4 Global Food Preservatives Market Size Trend (USD billion), 2021–2035 |
  57. FIGURE 5 Food Preservatives Market Share, by Product Type (%), 2025 |
  58. FIGURE 6 Food Preservatives Market Share, by Function (%), 2025 |
  59. FIGURE 7 Food Preservatives Market Share, by Form (%), 2025 |
  60. FIGURE 8 Food Preservatives Market Share, by Application (%), 2025 |
  61. FIGURE 9 Food Preservatives Market Share, by Region (%), 2025 |
  62. FIGURE 10 North America Food Preservatives Market Size Trend, 2021–2035 |
  63. FIGURE 11 Europe Food Preservatives Market Size Trend, 2021–2035 |
  64. FIGURE 12 Asia-Pacific Food Preservatives Market Size Trend, 2021–2035 |
  65. FIGURE 13 South America Food Preservatives Market Size Trend, 2021–2035 |
  66. FIGURE 14 Middle East & Africa Food Preservatives Market Size Trend, 2021–2035 |
  67. FIGURE 15 Competitive Landscape – Market Share Analysis, 2025

SEGMENTATION QUICK REFERENCE

DimensionSub-SegmentsDominant SegmentFastest Growing Segment
By Product TypeSynthetic, NaturalSynthetic (54.6% share, 2025)Natural (7.95% CAGR)
By FunctionAntimicrobials, AntioxidantsAntimicrobials (USD 2.08B, 2025)Antioxidants (6.75% CAGR)
By FormDry/Granular, LiquidDry/Granular (56.0% share, 2025)Liquid (6.95% CAGR)
By ApplicationBakery & Confectionery, Meat & Poultry, Ready Meals, Beverages, Dairy, OthersBakery & Confectionery (29.0% share, 2025)Ready Meals (7.95% CAGR)
By GeographyNorth America, Europe, Asia-Pacific, South America, Middle East & AfricaNorth America (33.2% share, 2025)Middle East & Africa (7.75% CAGR)


MARKET SEGMENTATION OVERVIEW

By Product Type

Sub-SegmentKey Trend
SyntheticRegulatory re-evaluations narrowing approved compound portfolio; cost advantage sustains volume leadership.
NaturalClean-label consumer demand and fermentation technology advances are driving rapid adoption in premium categories.


Synthetic preservatives retain the majority share due to well-established efficacy profiles and lower per-kilogram costs. Natural preservatives are gaining momentum as precision fermentation closes the cost gap and regulatory frameworks increasingly favor plant-derived and bio-based alternatives.

By Function

Sub-SegmentKey Trend
AntimicrobialsFSMA and EU food safety mandates drive non-discretionary demand for microbial control agents
AntioxidantsRising processed snack and oil consumption expands oxidation control requirements.


Antimicrobial preservation remains the core functional requirement across most food categories due to the severity of microbial contamination risks. Antioxidant demand is accelerating alongside the global expansion of lipid-rich processed food categories.

By Form

Sub-SegmentKey Trend
Dry/GranularPreferred for bakery, confectionery, and dry-mix applications requiring precise dosing
LiquidGrowing in beverages, dairy, and sauce applications where rapid dissolution is essential


Dry formats dominate due to stability advantages and compatibility with existing powder-blending manufacturing equipment. Liquid systems are expanding as beverage and dairy applications require homogeneous dispersion without particulate residue.

By Application

Sub-SegmentKey Trend
Bakery and ConfectioneryLargest volume consumer; mold prevention and staling control drive consistent demand
Meat and PoultryExport compliance standards require multi-regulatory preservative systems.
Ready MealsFastest-growing segment; convenience lifestyle trends accelerate across all regions
BeveragesAmbient distribution requirements sustain antimicrobial and antioxidant usage.
DairyFermentation control and extended shelf life for yogurt and cheese applications
OthersIncludes sauces, condiments, snacks, and emerging plant-based protein categories


Bakery and confectionery lead by volume, given the category's inherent spoilage susceptibility and large global production scale. Ready meals are the primary growth driver as urbanization and changing household structures reshape food consumption patterns worldwide.

By Geography

Sub-SegmentKey Trend
North AmericaClean-label regulatory leadership and FSMA compliance create premium demand.
EuropeStrictest additive regulation globally; reformulation activity drives the natural segment
Asia-PacificRapid processed food consumption growth and cold-chain investment
South AmericaMeat export preservation requirements anchor regional demand
Middle East & AfricaFood import dependence and urbanization drive the fastest regional growth


North America and Europe together account for over 60% of global value, reflecting mature food manufacturing infrastructure and rigorous regulatory standards. Asia-Pacific and MEA represent the highest growth trajectories as processed food adoption accelerates in urbanizing populations.


 

Download PDF ×

We do not share your information with anyone. However, we may send you emails based on your report interest from time to time. You may contact us at any time to opt-out.