Food Traceability Market

Key Players: IBM (Food Trust), SAP SE, Oracle Corporation, Honeywell International, Zebra Technologies, Trustwell (FoodLogiQ), TraceLink, Infor

Food Traceability Market

Food Traceability Market Size, Share, Industry Trend & Analysis Research Report By Offering (Hardware, Software, Services), By Technology (Barcodes and QR Codes, RFID, GPS and GNSS, Blockchain, Other), By Deployment Mode (On-Premise, Cloud-Based), By Application (Fresh Produce, Meat and Poultry, Seafood, Dairy, Beverages, Others), By End-Use Stage (Food Manufacturers and Processors, Retailers and E-Commerce, Distributors and Wholesalers, Foodservice, Others) - Forecast to 2035
ID: MRFR/FnB/31410-HCR
128 Pages
Varsha More
Last Updated: June 16, 2026

Food Traceability Market Summary

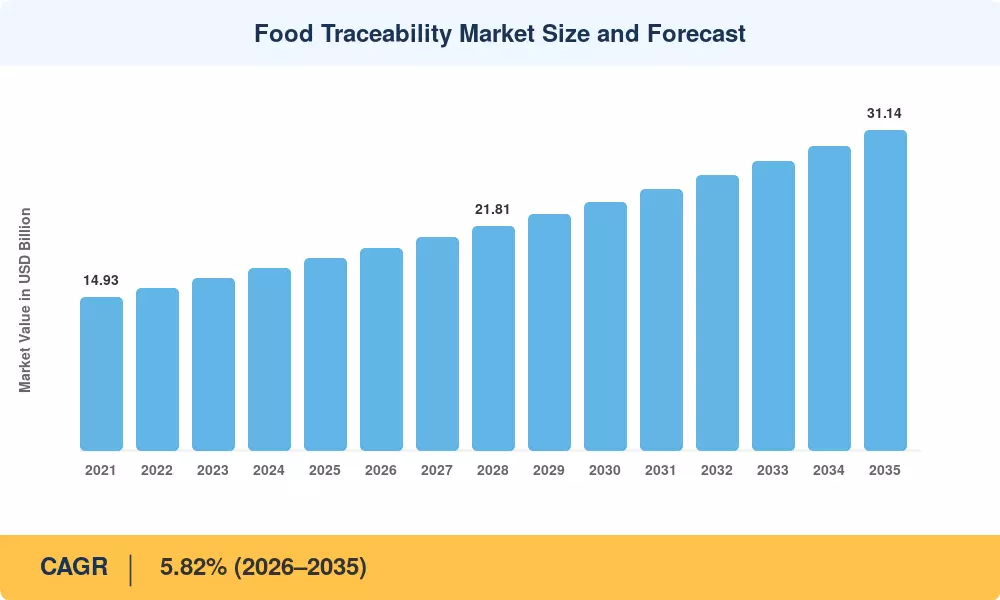
The food traceability market was valued at USD 18.72 billion in 2025 and is projected to reach USD 19.84 billion in 2026, expanding to USD 31.14 billion by 2035 at a CAGR of 5.82% over the 2026–2035 forecast period. Two catalysts are driving this acceleration: the U.S. FDA's Food Safety Modernization Act (FSMA) Section 204 traceability rule — which requires lot-level recordkeeping for high-risk foods by January 2026 — and the EU's General Food Law Regulation (EC 178/2002) enforcement tightening, both compelling manufacturers and retailers to invest in digital supply chain transparency technology. The food traceability market is no longer a compliance checkbox; it is a commercial differentiator

Legacy paper-based lot logs and standalone barcode scanners are being replaced by integrated technologies that blend RFID and barcode food tracking, cloud analytics and consumer-facing QR portals. The trend may be seen in IBM Food Trust’s blockchain-powered network that’s onboarding more than 300 food enterprises. Walmart and other retailers have required blockchain for food safety verification from their leafy greens suppliers, triggering an upstream investment cascade across the farm-to-fork supply chain tracking ecosystem. Buyers are expecting analytics, not just data acquisition, and the spend on software and services is outstripping hardware


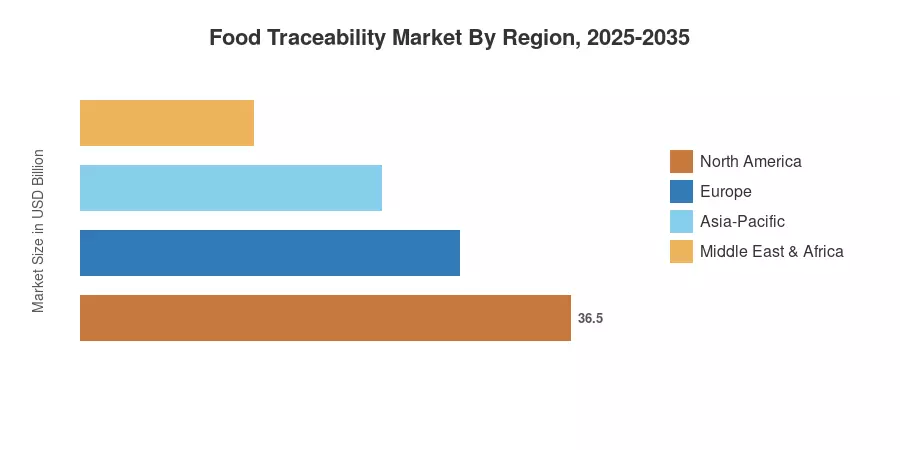
North America has the biggest regional share of around 29.6% of 2025 revenues, driven by robust regulatory infrastructure and mandates from major retailers. Asia Pacific is the fastest-growing market with a CAGR of 6.53% through 2035, owing to the maturing food safety law framework in China and the rising cold-chain logistics sector in India. Europe has the second greatest share at around 26.1%, due to the farm-to-fork supply chain tracking duties under the European Green Deal’s Farm to Fork Strategy. The food-traceability market is approaching a decade of platform convergence and AI-assisted recall management


Key Report Takeaways

• By Technology

  • Barcodes and QR codes held approximately 31.8% revenue share of the food traceability market in 2025, retaining dominance due to low deployment cost and universal retail infrastructure.
  • Blockchain in food safety is the fastest-growing technology segment, forecast at an 8.83% CAGR through 2035, as multi-stakeholder consortia demand tamper-proof audit trails.
  • RFID and barcode food tracking collectively represent the workhorse infrastructure layer, with RFID gaining share in cold-chain and pharmaceutical-adjacent food applications.

• By Sector

  • Fresh produce accounted for roughly 26.3% of food traceability market revenues in 2025, driven by high recall frequency and consumer sensitivity to contamination events.
  • The seafood segment is set to grow at a 8.12% CAGR through 2035, underpinned by EU IUU fishing regulations and U.S. SIMP traceability mandates.


• By Geography

  • North America contributed approximately 29.6% of the 2025 food traceability market revenues, anchored by FSMA compliance spend.
  • Asia Pacific is the fastest-growing region at 6.53% CAGR (2026–2035), with China and India leading greenfield deployments.
  • Europe's farm-to-fork supply chain tracking mandate under the Farm to Fork Strategy sustains steady mid-single-digit growth.


Market Size and Forecast (2021–2035)

Market Research Future (MRFR) projections are derived from a triangulation process that includes primary interviews with supply chain executives, secondary data from regulatory filing databases, and bottom-up segment modeling calibrated against publicly revealed technology procurement figures. Historical data are real documented periods. 2026-2035 values represent Market Research Future (MRFR)’s key scenario.

Food Traceability Market Size and Forecast
Our Impact
Enabled $4.3B Revenue Impact for Fortune 500 and Leading Multinationals
Partnering with 2000+ Global Organizations Each Year
30K+ Citations by Top-Tier Firms in the Industry

Driver Impact Analysis

Driver ~% Impact on CAGR Geographic Relevance Impact Timeline
FSMA Section 204 Compliance Mandates 1.4% North America Short-term (≤2 yr)
EU Farm to Fork Strategy Traceability Obligations 1.1% Europe Short-term (≤2 yr)
Retailer-Led Blockchain in Food Safety Mandates 0.9% Global Medium-term (2–4 yr)
Rising Consumer Demand for Supply Chain Transparency Technology 0.7% North America, Europe, APAC Medium-term (2–4 yr)
Cold-Chain Expansion and RFID and Barcode Food Tracking Upgrades 0.6% Asia Pacific, MEA Long-term (≥4 yr)
Food Recall Management Systems Investment Post-Outbreak Events 0.5% Global Short-to-medium
Cloud Platform Adoption Reducing Integration Costs 0.4% SME-heavy markets Long-term (≥4 yr)


FSMA Section 204 and Regulatory Compliance Pressure

The FDA's FSMA Section 204 rule, which took effect in January 2026, mandates electronic lot-level traceability records for 16 categories of high-risk foods, including leafy greens, shell eggs, and nut butters. Compliance is estimated to require average per-facility IT investments of USD 250,000–USD 850,000, depending on scale [1]. This is generating immediate demand across the food traceability market as processors scramble to connect legacy ERP systems with digital farm-to-fork supply chain tracking platforms.

EU Farm to Fork Strategy

The European Commission's Farm to Fork Strategy, part of the European Green Deal, sets legally binding traceability and sustainability disclosure requirements affecting an estimated 900,000 food operators across the EU by 2027 [2]. Member states are channeling over EUR 1.2 billion in digitalization grants through Common Agricultural Policy (CAP) funds to help smaller producers adopt supply chain transparency technology. This is a multi-year demand catalyst for European vendors and integrators.

Retailer-Driven Blockchain in Food Safety Mandates

Walmart's 2019 leafy-greens mandate — requiring Tier 1 suppliers to upload blockchain in food safety data via IBM Food Trust — has since expanded to over 100 product categories, influencing an estimated USD 80 billion in annual supplier spend [3]. Similar mandates from Carrefour, Tesco, and JD.com are replicating this model across Europe and Asia, creating a cascading compliance obligation that drives adoption further down the supply chain.

Food Recall Management Systems Investment

The FDA's average cost estimate for a single food recall exceeds USD 10 million in direct costs, excluding reputational damage [6]. High-profile outbreaks — including the 2024 Boar's Head listeria event affecting 15 states — reinforce executive-level investment in food recall management systems. Real-time traceability cuts average recall response time from 7 days to under 2 hours in documented deployments, a quantifiable ROI that accelerates procurement decisions.


Restraints Impact Analysis

The negative impact percentages below are directional indicators only and reflect estimated drag on achievable CAGR rather than additive offsets.

Restraint ~% Drag on CAGR Geographic Relevance Impact Timeline
High Implementation Costs for SMEs -0.8% Emerging Markets, SME Segment Short-to-medium
Data Standardization and Interoperability Gaps -0.6% Global Medium-term
Cybersecurity and Data Privacy Concerns -0.5% Europe, North America Medium-to-long
Complexity of Legacy System Integration -0.4% Mature Markets Short-term
Low Regulatory Urgency in Developing Economies -0.3% MEA, Parts of South America Long-term


SME Cost Barriers

Small and mid-sized food producers represent roughly 78% of the global food industry by establishment count but account for only 30–35% of food traceability market revenues [8]. Initial hardware plus software deployment costs of USD 150,000–USD 500,000 remain prohibitive for operations generating under USD 5 million in annual revenue. Cloud-based SaaS models are reducing this barrier, but connectivity limitations in rural agricultural zones continue to restrict adoption.

Interoperability and Data Standardization

The global traceability market is increasingly coalescing around the GS1 EPCIS 2.0 (ISO/IEC 19987:2024) standard. While early fragmented approaches resulted in data silos across proprietary platforms (e.g., legacy ERP integrations), the industry has moved beyond the "absence of standards" phase. The current challenge is the migration of legacy data architectures to support the event-based visibility required by EPCIS 2.0. Large enterprises are increasingly prioritizing vendors that provide "out-of-the-box" compatibility with GS1 standards to avoid the pitfalls of closed-loop proprietary ecosystems that complicate multi-tier supply chain visibility.


Cybersecurity Exposure in Connected Supply Chains

The digitalization of the food supply chain has significantly expanded the corporate attack surface. According to the IBM Cost of a Data Breach Report 2024, the global average cost of a data breach has reached USD 4.88 million. While this figure represents a cross-industry average, the food and beverage sector is increasingly targeted due to the critical nature of supply chain uptime and the sensitivity of shared data. Compliance with evolving privacy regulations (such as GDPR in the EU) and the necessity of protecting proprietary traceability data against ransomware are now critical drivers for procurement, as risk-averse enterprise buyers increasingly mandate robust cybersecurity audits as a prerequisite for supply chain integration.


Food Traceability Market Opportunities

Blockchain-as-a-Service for Mid-Market Processors

While initial blockchain-in-food-safety deployments focused on large enterprises, the mid-market—processors with annual revenues between USD 10 million and USD 500 million—is now a core focus for software vendors. Rather than full-scale infrastructure replacements, the market is shifting toward interoperable SaaS connectors that integrate blockchain-based traceability directly into existing ERP environments (e.g., SAP, Microsoft Dynamics). This allows mid-market firms to achieve compliance and supply chain transparency as an operational extension of their current workflows, avoiding the capital-intensive barriers of earlier proprietary models.


Consumer-Facing QR Traceability as a Retail Differentiator

Retailers and brands are increasingly leveraging QR-code-based transparency as a differentiator to build consumer trust. While consumer willingness to pay (WTP) a premium varies by product category and region, research consistently demonstrates that a significant portion of consumers are more loyal to—and willing to pay a premium (often 2–10%) for—brands that provide verifiable, end-to-end provenance data. Traceability is evolving from a back-end compliance requirement to a front-end marketing asset that drives brand equity and customer retention.


Emerging Market Cold-Chain Infrastructure Buildout

Emerging markets in Asia, Africa, and Latin America are undergoing a period of rapid cold-chain expansion. This growth is characterized by the integration of digital tracking technologies (RFID and barcode systems) into new refrigerated trucks and warehouse nodes. Rather than replicating the legacy systems of mature markets, these regions are adopting "digital-first" cold-chain architectures, creating significant demand for hardware-software integrated platforms that ensure quality and minimize spoilage from farm to retail.


AI-Powered Predictive Food Recall Management Systems

Moving from reactive to predictive food recall management systems represents the next frontier. Platforms embedding machine learning to flag anomalous temperature or contamination signals before a recall event can reduce exposure by an estimated 60% [7]. Vendors offering predictive analytics layers on top of standard traceability data will command significant pricing premiums over compliance-only solutions.

Data Monetization and Supply Chain Intelligence Services

Traceability data is increasingly recognized as a strategic asset with commercial value beyond compliance. Aggregated, anonymized data sets concerning transit times, temperature excursion frequencies, and spoilage rates are becoming valuable inputs for insurers, commodity traders, and sustainability-focused investors. As supply chain visibility improves, leading platform providers are exploring new service models where aggregated supply chain intelligence creates additional revenue streams, transforming traceability systems into data-driven decision-making platforms.


Food Traceability Market Future Outlook

AI and Machine Learning Integration in Traceability Platforms

Artificial intelligence is moving from pilot to production within food recall management systems, with platforms like Trustwell (FoodLogiQ) and TraceLink deploying predictive contamination models trained on historical outbreak data and real-time sensor feeds. The World Economic Forum estimates AI-enhanced supply chain transparency technology could reduce global food waste by 12–15% annually — a USD 120 billion productivity gain [7]. By 2030, AI-flagging capabilities will be table-stakes in enterprise RFP requirements.

Platform Consolidation and Ecosystem Economics

The food traceability market is entering a consolidation phase. Fragmented point solutions — standalone RFID and barcode food tracking readers, isolated blockchain nodes, siloed cold-chain sensors — are being absorbed into end-to-end platforms. Expect 15–20 significant M&A transactions between 2026 and 2030 as cloud hyperscalers (AWS, Microsoft Azure, Google Cloud) deepen vertical integrations with traceability ISVs. Platform economics will reward vendors who lock in multi-tier supplier networks rather than single-enterprise deployments

Sustainability Reporting and ESG-Linked Traceability

Supply chain transparency technology is becoming inseparable from corporate ESG reporting. The SEC's climate disclosure rules (effective 2026 for large accelerated filers) and ISSB's IFRS S2 standard require Scope 3 emissions data that can only be sourced from granular farm-to-fork supply chain tracking records. This dual compliance function — food safety plus carbon accounting — elevates traceability platforms from operational tools to strategic infrastructure, expanding addressable budgets beyond food safety teams to CFO offices.

Interoperable Standards and Open-Network Traceability

GS1's EPCIS 2.0 and the Open Packaging Network (OPN) initiative are laying the groundwork for interoperable traceability data exchange across competing platforms. Once achieved, open-network traceability will unlock cross-industry use cases — pharmaceutical co-packing facilities, pet food, and nutraceuticals — expanding the food traceability market's total addressable market by an estimated USD 4–6 billion by 2035 [9]. Governments in the EU and Singapore are actively co-funding interoperability pilots through 2027.


Food Traceability Market Segmentation

By Offering

Segment Key Metric Primary Demand Driver
Hardware ~42.5% revenue share (2025) Sensor, RFID reader, and scanner infrastructure deployment
Software CAGR 6.4% (2026–2035) Analytics, recall management, and ERP integration platforms
Services CAGR 7.1% (2026–2035) System integration, consulting, and managed traceability services


The food traceability market's offering mix is shifting decisively toward software and services. Hardware held roughly 42.5% of 2025 revenues — a dominant but declining share — as most large retailers and processors have completed basic sensor infrastructure rollouts. Software is where the growth story concentrates: cloud-native platforms combining blockchain in food safety ledgers, AI-driven anomaly detection, and consumer-facing QR portals are commanding SaaS contract values 3–5× higher than legacy on-premise licenses. Services vendors are expanding fastest as mid-market clients lack in-house integration expertise for complex multi-ERP environments

By Technology

Segment Key Metric Primary Demand Driver
Barcodes and QR Codes ~31.8% revenue share (2025) Universal retail infrastructure, low per-unit cost
RFID CAGR 6.2% (2026–2035) Cold-chain automation, high-volume pallet tracking
GPS and GNSS CAGR 5.9% (2026–2035) Farm-of-origin verification, transport monitoring
Blockchain CAGR 8.83% (2026–2035) Multi-stakeholder audit trail, anti-fraud verification
Other (sensors, IoT) CAGR 6.7% (2026–2035) Temperature, humidity, and environmental monitoring


Barcodes and QR codes remain the volume workhorse of the food traceability market, commanding roughly 31.8% of 2025 revenues due to negligible per-label cost and universal scanner compatibility. RFID and barcode food tracking together capture the largest hardware budget lines. Blockchain in food safety is the standout growth segment at an 8.83% CAGR — driven not by speculative adoption but by documented ROI in multi-party supply chains where dispute resolution costs have historically been high. Walmart's internal estimate of a 94% reduction in supplier trace time following its IBM Food Trust rollout remains the most-cited proof point [3].

By Application

Segment Key Metric Primary Demand Driver
Fresh Produce ~26.3% revenue share (2025) High recall frequency, FSMA high-risk food list
Meat and Poultry CAGR 5.6% (2026–2035) USDA FSIS requirements, export market access
Seafood CAGR 8.12% (2026–2035) SIMP regulations, IUU fishing compliance, EU import rules
Dairy ~11.4% revenue share (2025) Cold-chain integrity, allergen management
Beverages CAGR 5.4% (2026–2035) Authenticity verification, counterfeit prevention
Others CAGR 5.1% (2026–2035) Specialty foods, nutraceuticals and pet food adjacency


Fresh produce leads the food traceability market by application, with approximately 26.3% of 2025 revenues — a direct consequence of leafy greens appearing on the FDA's FSMA 204 high-risk food list. Seafood is the fastest-growing application segment at an 8.12% CAGR, driven by the U.S. Seafood Import Monitoring Program (SIMP) and the EU's IUU fishing regulation, which collectively cover imports from over 85 countries. GPS and GNSS vessel tracking integrated with port-of-entry RFID and barcode food tracking is creating a hardware-software hybrid demand pattern unique to this segment.

By Deployment Mode

Segment Key Metric Primary Demand Driver
On-Premise ~56.7% revenue share (2025) Data sovereignty, legacy system integration
Cloud-Based CAGR 8.58% (2026–2035) Lower TCO, multi-tenant supplier network access


On-premise deployments still account for the majority of the food traceability market by revenue, reflecting the installed base of large food manufacturers who built proprietary systems in the 2015–2022 period. Cloud-based supply chain transparency technology is growing at nearly 8.58% CAGR — nearly double the market average — as newer entrants and upgrading SMEs select SaaS over capital-intensive on-premise stacks. The shift is accelerating: Market Research Future (MRFR) projects cloud will exceed on-premise revenues by 2031

By End-Use Stage

Segment Key Metric Primary Demand Driver
Food Manufacturers and Processors ~35.6% revenue share (2025) FSMA, EU food law, food recall management systems
Retailers and E-Commerce CAGR 7.44% (2026–2035) Consumer transparency demands, supplier audit tools
Distributors and Wholesalers CAGR 5.8% (2026–2035) Hub-and-spoke traceability, cold-chain handoff
Foodservice CAGR 5.2% (2026–2035) Menu labeling, allergen management
Others CAGR 4.7% (2026–2035) Importers, exporters and customs verification


Food manufacturers and processors hold the largest end-use share at approximately 35.6%, as they face the most direct regulatory obligations. Retail and e-commerce are the fastest-growing end-use segments at a 7.44% CAGR — a significant shift from the historical pattern where retailers received traceability data rather than generating it. Platforms enabling retailers to run independent supplier audits and consumer-facing transparency portals are creating new revenue lines for traceability vendors beyond the manufacturing layer.


Regional Market Share Analysis

Region 2025 Revenue Share (%) Primary Investment Themes
North America 29.6% FSMA compliance, retailer blockchain mandates and food recall management systems
Europe 26.1% Farm to Fork Strategy, EU traceability regulations and sustainability reporting
Asia Pacific 23.4% Cold-chain buildout, China food safety law, India digital agriculture
South America 11.8% Agri-export traceability, soy and beef chain compliance
Middle East & Africa 9.1% GCC food security policy, halal certification, traceability
Total 100%  


North America

Country Key Metric Key Driver
United States ~22.4% of global 2025 revenue FSMA Section 204, Walmart blockchain mandate
Canada CAGR 5.1% (2026–2035) CFIA Safe Food for Canadians Regulations
Mexico CAGR 6.2% (2026–2035) USMCA agricultural traceability provisions


North America's food traceability market is anchored by the United States, where the FDA's FSMA Section 204 rule catalyzes an estimated USD 2.1 billion in aggregate compliance spending through 2027. Canada's Canadian Food Inspection Agency (CFIA) requirements under the Safe Food for Canadians Regulations are pushing smaller processors toward cloud-based farm-to-fork supply chain tracking platforms. Mexico is emerging as a fast-follower market, driven by USMCA rules of origin requirements for fresh produce exporters [1].

Europe

Country Key Metric Key Driver
Germany ~5.8% of global 2025 revenue Strong food processing industry, DIN standards
United Kingdom CAGR 4.9% (2026–2035) Post-Brexit FSA traceability guidance
France ~4.2% of global 2025 revenue Farm to Fork national action plan
Italy CAGR 5.3% (2026–2035) PDO/PGI product authentication demand
Spain CAGR 5.1% (2026–2035) Agri-export compliance, olive oil traceability
Nordic Countries CAGR 5.6% (2026–2035) Retailer sustainability mandates, high digitalization
Russia CAGR 3.2% (2026–2035) Limited regulatory enforcement, constrained investment
Rest of Europe CAGR 4.8% (2026–2035) EU harmonization obligations


Europe's regulatory environment is the most mature globally, with the EU General Food Law requiring end-to-end traceability for all food products. The Farm to Fork Strategy's 2030 targets are channeling EUR 1.2 billion in CAP digitalization funds into supply chain transparency technology across member states. Germany's large food processing sector — with over 6,000 manufacturers — represents the largest single national market in the region [2].

Asia Pacific

Country Key Metric Key Driver
China ~9.8% of global 2025 revenue China Food Safety Law 2021 amendments
India CAGR 7.4% (2026–2035) FSSAI traceability standards, cold-chain buildout
Japan ~3.6% of global 2025 revenue JAS traceability requirements, the beef traceability law
South Korea CAGR 6.1% (2026–2035) K-FSMS digital traceability rollout
ASEAN CAGR 7.1% (2026–2035) Export compliance, seafood RFID and barcode food tracking
Rest of Asia-Pacific CAGR 5.8% (2026–2035) Emerging regulatory frameworks


Asia Pacific is the food traceability market's fastest-growing region at a 6.53% CAGR through 2035. China's 2021 amendments to the Food Safety Law mandate electronic traceability for 12 high-risk product categories, compelling an estimated 180,000 domestic food enterprises to upgrade systems. India's FSSAI is piloting a national food traceability portal targeting 50,000 licensed manufacturers by 2026, creating a large greenfield deployment wave for both domestic and international vendors [5].

South America

Country Key Metric Key Driver
Brazil ~7.9% of global 2025 revenue Beef and soy export traceability (EU deforestation regulation)
Argentina CAGR 5.4% (2026–2035) Wine and grain export compliance
Rest of South America CAGR 4.6% (2026–2035) Seafood and fresh produce export traceability


Brazil's food traceability market is being reshaped by the EU Deforestation Regulation (EUDR), effective December 2024, which requires verifiable farm-of-origin data for beef, soy, and cocoa exported to Europe. Brazilian agri-businesses are investing in GPS and GNSS-based farm mapping integrated with farm-to-fork supply chain tracking platforms to maintain market access. The Brazilian government's SISBOV cattle traceability system — covering 28 million head — is being modernized with digital ear-tag RFID technology [12].

Middle East & Africa

Country Key Metric Key Driver
Saudi Arabia CAGR 6.8% (2026–2035) Saudi Vision 2030 food security, halal traceability
UAE ~2.8% of global 2025 revenue Dubai Food Safety Department mandates the HORECA sector
South Africa CAGR 5.2% (2026–2035) Citrus and wine export compliance
Egypt CAGR 4.9% (2026–2035) National food safety authority digitalization
Rest of MEA CAGR 4.3% (2026–2035) GCC harmonization, donor-funded agriculture programs


The Gulf Cooperation Council is the most active investment hub within MEA, with Saudi Arabia's Ministry of Environment, Water and Agriculture allocating SAR 900 million (~USD 240 million) to national food security digitalization through 2027. Halal certification integrity — a USD 2.4 trillion global market — increasingly depends on blockchain in food safety audit trails, creating a unique regional demand driver absent elsewhere [13].


Food Traceability Market By Region, 2025-2035

Competitive Benchmarking

The food traceability market is moderately concentrated, with the top five companies projected to account for 35-42% of global revenues. Based on the available market positions, an estimate of the Herfindahl-Hirschman Index (HHI) indicates a moderate degree of market fragmentation (estimated HHI: 650–800), well below the criteria of a monopolistic structure. This highlights the multi-dimensionality of traceability – hardware suppliers, pure-play software players, ERP behemoths and blockchain experts fight on distinct layers of the value stack rather than head-to-head.

Company Est. Revenue Share Range Key Offerings for the Food Traceability Market Strategic Positioning
IBM (Food Trust) ~8–11% Blockchain in food safety platform, supplier network management Enterprise blockchain ecosystem leader; Walmart and Carrefour anchor clients
SAP SE ~7–10% SAP Logistics Business Network, ERP-embedded traceability ERP integration depth: targets the large processor and retailer segment
Oracle Corporation ~6–9% Oracle SCM Cloud, Demantra traceability modules Cloud ERP traceability is strong in North American food manufacturing
Honeywell International ~5–7% RFID and barcode food tracking hardware, Intelligrated systems Hardware-software convergence; cold-chain and warehouse automation
Zebra Technologies ~4–7% RFID readers, mobile scanning, Savanna platform RFID and barcode food tracking infrastructure; strong in retail and distribution
Trustwell (FoodLogiQ) ~3–5% Connect supplier management, Track traceability SaaS Pure-play SaaS; FSMA 204 compliance tooling
TraceLink ~3–5% Digital network platform, multi-tier traceability Pharma-to-food crossover; network-of-networks model
Infor ~3–5% Infor CloudSuite Food & Beverage, lot traceability Industry-specific ERP; strong in meat, dairy, and beverage verticals
Rfxcel (Antares Vision Group) ~2–4% Farm-to-fork supply chain tracking, serialization Serialization expertise from pharma applied to food; growing EU presence
Intertek Group ~2–4% Testing, inspection and food recall management systems Third-party assurance layer; compliance verification services


Recent News & Developments

  • FDA (January 2026): FSMA Section 204 traceability rule became enforceable for large food manufacturers, triggering an estimated USD 800 million in immediate compliance procurement across the U.S. food industry. This was the single largest regulatory catalyst for the food traceability market in the 2024–2026 cycle. [1]


  • Antares Vision Group (2021): Acquired UK-based rfXcel, consolidating farm-to-fork supply chain tracking capabilities across serialization, cold-chain monitoring, and consumer-facing QR portal technologies. The deal, valued at approximately EUR 195 million, strengthens Antares' position in European food markets ahead of EU DPP (Digital Product Passport) requirements. [14]


  • GS1 (July 2022): Released the EPCIS 2.0 standard with mandatory JSON-LD support, enabling real-time IoT sensor data integration with traceability ledgers. Major food manufacturers, including Nestlé, Unilever, and JBS, committed to EPCIS 2.0 adoption by 2025, creating a de facto interoperability standard for blockchain in food safety implementations. [9]
  • USDA (2018): Published its National Bioengineered Food Disclosure Standard compliance guidance, confirming that QR code-based disclosure qualifies as an approved disclosure method — effectively mandating supply chain transparency technology QR infrastructure for over 3,000 product categories sold in the U.S. [16]


Food Traceability Market Report Scope

Parameter Details
Market Scope Global food traceability market across offering, technology, deployment mode, application, end-use stage, and geography
Study Period 2021–2035 (Historical: 2021–2024; Base Year: 2025; Forecast: 2026–2035)
CAGR Window 2026–2035; Market Research Future (MRFR) calibrated rate: 5.82%
Market Size Checkpoints 2025: USD 18.72B; 2026: USD 19.84B; 2031: USD 26.44B; 2035: USD 31.14B
Fastest Growing Segments Services (offering); Blockchain (technology); Seafood (application); Cloud (deployment); Retail & E-Commerce (end-use)
Fastest Growing Region Asia Pacific (6.53% CAGR, 2026–2035)
Companies Profiled 10+, including IBM, SAP, Oracle, Honeywell, Zebra, Trustwell, TraceLink, Infor, Rfxcel, Intertek
Valuation Currency USD Billion (all values)
Data Sources Primary interviews, regulatory filings, company annual reports, industry databases, Market Research Future (MRFR) proprietary models


FAQs

What total budget should a mid-sized food processor expect to allocate for full FSMA 204 compliance using a cloud traceability platform?

Mid-sized processors (USD 50M–USD 500M revenue) typically spend USD 200,000–USD 600,000 in year-one implementation, including software licensing, ERP integration, and staff training. Ongoing SaaS fees generally run USD 80,000–USD 180,000 annually, depending on user count and supplier network size. [24]

How does blockchain in food safety differ practically from a standard cloud traceability database for a procurement buyer?

Blockchain creates an immutable, multi-party ledger that no single participant can alter retroactively, making it superior for high-dispute environments like seafood provenance or organic certification. Standard cloud databases offer faster query performance and lower cost for single-enterprise deployments where data sovereignty isn't contested. [3]

Which food traceability market segments offer the best ROI timeline for a first-time deployer?

QR-code-based consumer transparency portals typically deliver measurable ROI within 12–18 months through reduced recall scope and premium pricing uplift. RFID and barcode food tracking in warehouse automation offers 18–30-month payback via labor savings and inventory accuracy gains. [21]

How are food traceability market vendors handling the transition from on-premise to cloud without disrupting active production environments?

Leading vendors offer hybrid bridge architectures — maintaining on-premise databases for real-time production queries while syncing batch records to the cloud for analytics and regulatory reporting. This two-tier model avoids production downtime risk and allows phased migration over 18–36 months. [7]

What procurement criteria most differentiate top-tier food traceability market vendors from second-tier alternatives?

Top-tier vendors offer pre-certified GS1 EPCIS 2.0 connectors, documented sub-2-hour recall response SLAs, and multi-tier supplier onboarding tools. Second-tier vendors frequently lack self-service supplier portals, requiring costly custom integration projects for each new supply chain partner. [9]

How is the food traceability market adapting to the EU Digital Product Passport (DPP) requirements expected by 2027?

DPP requires a machine-readable identifier linked to a verified product data record covering origin, composition, and environmental footprint — essentially a regulatory mandate for supply chain transparency technology. Vendors like Antares Vision and TraceLink are already embedding DPP-compatible data schemas into their 2025 platform releases. [14]

What integration challenges most commonly delay food traceability market deployments for large food manufacturers with multi-ERP environments?

Inconsistent lot-numbering conventions across acquired ERP instances are the leading cause of integration delays, often adding 6–9 months to expected timelines. Vendors with pre-built harmonization middleware for SAP-Oracle-Dynamics hybrid environments resolve this 40–60% faster than custom integration approaches.


Author
Author
Author Profile
Varsha More LinkedIn
Senior Research Analyst
Experienced business professional with a demonstrated history of working in the CFnB industry. Skilled in market research, and market estimation. Strong professional with a Masters focused in marketing management.

Research Approach


Secondary Research

The secondary research process involved comprehensive analysis of regulatory databases, peer-reviewed journals, industry publications, and authoritative food safety organizations. Key sources included the US Food & Drug Administration (FDA), US Department of Agriculture (USDA), European Food Safety Authority (EFSA), Food and Agriculture Organization of the United Nations (FAO), World Health Organization (WHO) Food Safety Programme, Codex Alimentarius Commission, International Organization for Standardization (ISO) Technical Committee 34 (Food Products), GS1 Global Office, International Food Protection Training Institute (IFPTI), European Commission Directorate-General for Health and Food Safety (DG SANTE), Food Standards Agency (UK), Food Safety and Inspection Service (FSIS), Centers for Disease Control and Prevention (CDC) Food Safety Office, National Institute of Food and Agriculture (NIFA), EU Rapid Alert System for Food and Feed (RASFF), Blockchain in Transport Alliance (BiTA), International Association for Food Protection (IAFP), and national food safety authorities from key markets including China National Center for Food Safety Risk Assessment (CFSA), Food Safety and Standards Authority of India (FSSAI), and Health Canada. These sources were used to collect regulatory compliance data, technology adoption statistics, foodborne illness outbreak tracking, supply chain transparency mandates, and market landscape analysis for blockchain, RFID, QR codes, IoT solutions, and centralized database technologies across meat and poultry, fruits and vegetables, dairy products, and grains and cereals applications.


Primary Research

In order to gather both qualitative and quantitative insights, supply-side and demand-side stakeholders were interviewed during the primary research process. CEOs, CTOs, VPs of Product Development, heads of regulatory affairs, and commercial directors from food traceability solution providers, technology suppliers, and system integrators were examples of supply-side sources. Chief supply chain officers, quality assurance directors, food safety managers, procurement leaders from food manufacturers, retail operations heads, food service compliance officers, and government food inspection officials from regulatory agencies were examples of demand-side suppliers.

Primary research verified product development schedules and implementation roadmaps, validated market segmentation across technology types (blockchain, RFID, QR codes, IoT solutions, centralized databases), and acquired information on technology adoption trends, integration difficulties, pricing models, regulatory compliance costs, and return on investment metrics for traceability implementations.

Primary Respondent Breakdown:

By Designation: C-level Primaries (28%), Director Level (32%), Others (40%)

By Region: North America (38%), Europe (25%), Asia-Pacific (28%), Rest of World (9%)


Market Size Estimation

Global market valuation was derived through revenue mapping and technology deployment analysis. The methodology included:

Identification of 50+ key technology providers and solution vendors across North America, Europe, Asia-Pacific, Latin America, and Middle East & Africa

Technology mapping across blockchain platforms, RFID systems, QR code solutions, IoT sensor networks, and centralized database architectures

Solution type analysis covering software platforms, hardware devices (scanners, sensors, tags), and professional services (consulting, implementation, maintenance)

End-use segmentation across food manufacturers, retailers, food service providers, and government regulatory agencies

Application coverage across meat and poultry, fruits and vegetables, dairy products, and grains and cereals supply chains

Analysis of reported and modeled annual revenues specific to food traceability portfolios

Coverage of technology providers representing 75-80% of global market share in 2024

Extrapolation using bottom-up (deployment volume × ASP by technology and region) and top-down (vendor revenue validation) approaches to derive segment-specific valuations

Cross-validation against food industry IT spending patterns and regulatory compliance budget allocations

This methodology maintains the same rigorous structure as your dermal fillers example while adapting to the specific nuances of the food traceability market, including the relevant regulatory bodies, technology categories, and industry stakeholders specific to food supply chain transparency and safety.

Download Free Sample

Kindly complete the form below to receive a free sample of this Report

Download PDF ×

We do not share your information with anyone. However, we may send you emails based on your report interest from time to time. You may contact us at any time to opt-out.