Segmentation Quick Reference
| Dimension | Sub-Segments | Dominant Segment | Fastest Growing Segment |
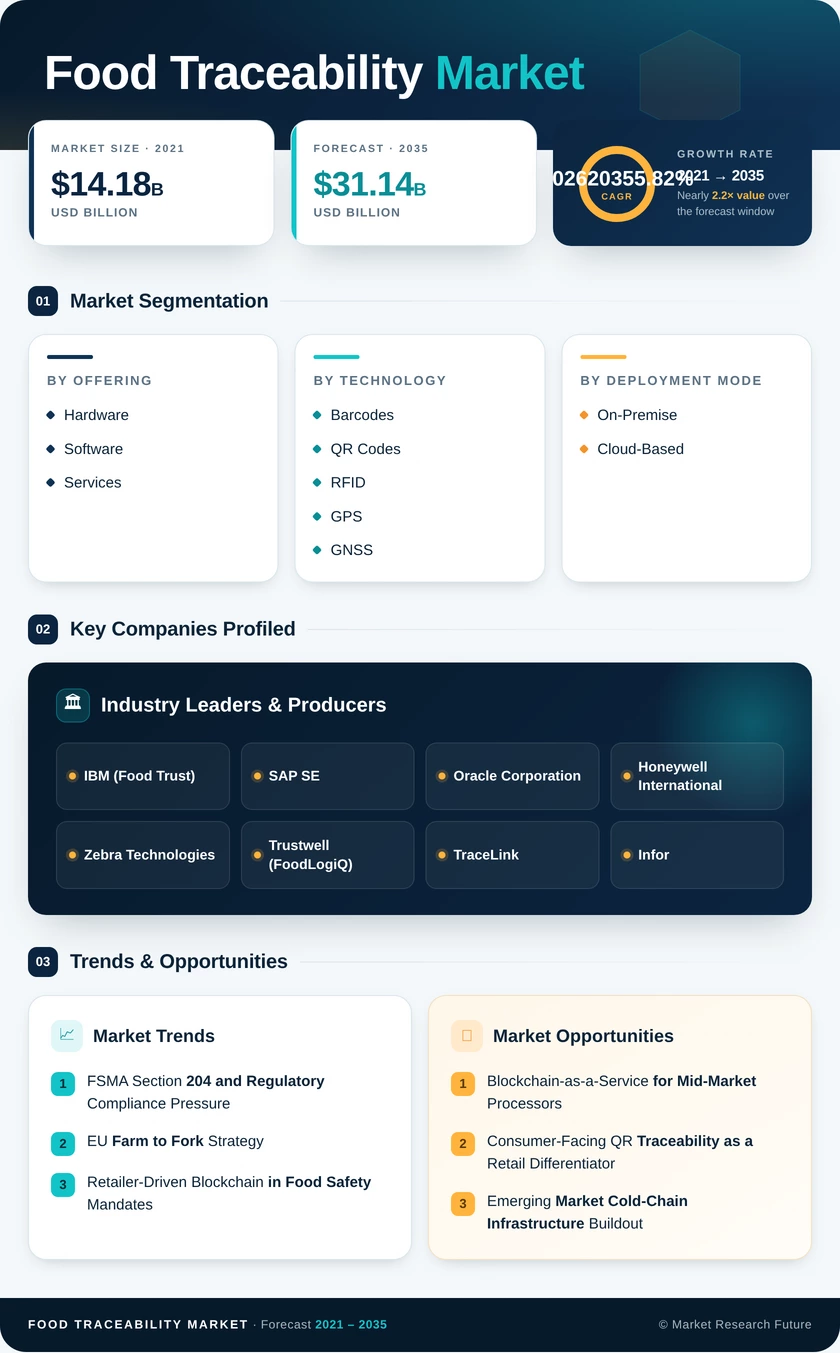
| By Offering | Hardware; Software; Services | Hardware (~42.5% share, 2025) | Services (7.1% CAGR) |
| By Food Traceability Market | Barcodes and QR Codes; RFID; GPS and GNSS; Blockchain; Other | Barcodes and QR Codes (~31.8% share) | Blockchain (8.83% CAGR) |
| By Deployment Mode | On-Premise; Cloud-Based | On-Premise (~56.7% share) | Cloud-Based (8.58% CAGR) |
| By Application | Fresh Produce; Meat and Poultry; Seafood; Dairy; Beverages; Others | Fresh Produce (~26.3% share) | Seafood (8.12% CAGR) |
| By End-Use Stage | Food Manufacturers and Processors; Retailers and E-Commerce; Distributors and Wholesalers; Foodservice; Others | Food Manufacturers and Processors (~35.6% share) | Retailers and E-Commerce (7.44% CAGR) |
Market Segmentation Overview
By Offering
| Sub-Segment | Key Trend |
| Hardware | Maturing infrastructure layer; growth shifting to smart sensors and RFID readers with embedded analytics |
| Software | Fastest-rising spend category: SaaS and cloud-native platforms replacing on-premise licenses |
| Services | Managed traceability and system integration services are expanding as mid-market adoption accelerates. |
Hardware was the revenue-dominant offering in 2025, but is ceding growth momentum to software and services as the food traceability market matures. Cloud-native platforms with pre-built ERP connectors are compressing integration timelines from months to weeks, enabling faster supplier onboarding and reducing the services component for standard deployments, even as complex multi-ERP environments continue to require significant professional services engagements.
By Food Traceability Market
| Sub-Segment | Key Trend |
| Barcodes and QR Codes | Ubiquitous low-cost infrastructure; consumer-facing QR use cases expanding beyond compliance |
| RFID | Growing in cold-chain automation and pharmaceutical-adjacent food environments |
| GPS and GNSS | Critical for farm-of-origin verification; seafood vessel tracking integration expanding. |
| Blockchain | Highest CAGR; multi-party network deployments creating defensible competitive moats for vendors |
| Other (Sensors, IoT) | Temperature and humidity monitoring converging with traceability platforms for end-to-end cold-chain visibility. |
Barcodes and QR codes retain volume dominance because every smartphone doubles as a scanner, and label costs are fractions of a cent. Blockchain in food safety is growing fastest not because it replaces other technologies but because it provides the trust layer that ties disparate data sources — RFID scans, GPS pings, sensor readings — into a single tamper-evident audit trail valued by regulators and insurance underwriters alike.
By Deployment Mode
| Sub-Segment | Key Trend |
| On-Premise | Incumbent base; migration to cloud hybrid increasingly common |
| Cloud-Based | Fastest-growing mode; multi-tenant supplier networks and real-time analytics driving preference |
The deployment mode balance is shifting faster than most enterprise software markets. Cloud's 8.58% CAGR versus on-premise's low-single-digit trajectory reflects not just cost economics but network effects: a cloud platform with 400 onboarded suppliers is exponentially more valuable than a siloed on-premise system, regardless of feature parity.
By Application
| Sub-Segment | Key Trend |
| Fresh Produce | FSMA 204 compliance primary driver; leafy greens blockchain mandate precedent-setting |
| Meat and Poultry | USDA FSIS and export certification requirements are driving digital lot tracking |
| Seafood | SIMP and IUU regulations are creating the fastest-growing application demand |
| Dairy | Cold-chain integrity and allergen management primary use cases |
| Beverages | Anti-counterfeiting and authenticity verification are growing in premium spirits and wine. |
| Others | Specialty, nutraceutical, and pet food adjacency is expanding the total addressable base. |
Each application segment has a distinct regulatory trigger and technology preference. Fresh produce favors QR-code-based consumer portals. Seafood demands GPS and GNSS vessel integration. Meat relies on RFID and barcode food tracking lot systems. This fragmentation by sub-vertical means no single traceability platform dominates all applications, creating durable market share for specialized vendors alongside generalist ERP players.
By End-Use Stage
| Sub-Segment | Key Trend |
| Food Manufacturers and Processors | Largest spend base; FSMA and EU food law primary compliance drivers |
| Retailers and E-Commerce | Fastest growth; moving from data consumers to active traceability network orchestrators |
| Distributors and Wholesalers | Hub-and-spoke cold-chain handoff monitoring; lot reconciliation tools in demand |
| Foodservice | Allergen management and menu labeling transparency are driving adoption. |
| Others | Importers, exporters, and customs brokers are integrating with national regulatory portals. |
Retailers are the most dynamic end-use stage in the current cycle. Historically passive recipients of supplier-generated traceability data, major retail chains are now building proprietary supplier audit platforms — effectively becoming traceability network operators rather than subscribers. This inversion creates both competitive pressure on standalone traceability vendors and new channel partnership opportunities for those willing to co-develop retailer-branded platforms.