Fortified Wine Market (2026 - 2035)

Fortified Wine Market Size, Share, Industry Trend & Analysis Research Report By Product Type (Port, Vermouth, Sherry, Madeira, Marsala, Others), By Category (Mass, Premium), By End User (Men, Women), By Distribution Channel (On-Trade, Off-Trade), By Geography (North America, Europe, Asia-Pacific, South America, Middle East & Africa) - Forecast to 2035

Forecast Period
2026-2035
CAGR
3.61%
2025 Market Size
USD 15.78 Billion
2035 Market Size
USD 22.46 Billion
Food, Beverages & Nutrition ● Updated August 25, 2026 Report ID: MRFR/FnB/2640-HCR | Pages: 128 | Author: Sakshi Gupta

Fortified Wine Market Summary

The Fortified Wine Market was valued at USD 15.78 Billion in 2025 and opens the forecast window at USD 16.32 Billion in 2026, reaching USD 22.46 Billion by 2035 at a 3.61% CAGR. Growth is no longer a volume story. It is a value story, anchored by the European Union's Common Market Organisation wine envelope, which channels roughly EUR 1.06 billion annually into promotion, restructuring and vineyard investment across member states [1]. Portugal's IVDP-administered benefício quota system, which caps Port grape must releases each harvest, has tightened supply deliberately and lifted average release prices [2].

The category is experiencing a shift in production economics. Gravity-fed lagares and temperature-controlled stainless fermentation have replaced a significant portion of the manual foot-treading and open-vat spirit addition that characterized the trade for two centuries. Precision spirit dosing systems now maintain ethanol tolerances within 0.2% ABV. Symington Family Estates, on its own, allocated EUR 12 million to solar, water-recovery, and cellar automation at Quinta do Bomfim between 2022 and 2025 [3]. Solera bodegas in Jerez have been retrofitted with humidity telemetry, a practice that has been adopted by sherry houses.

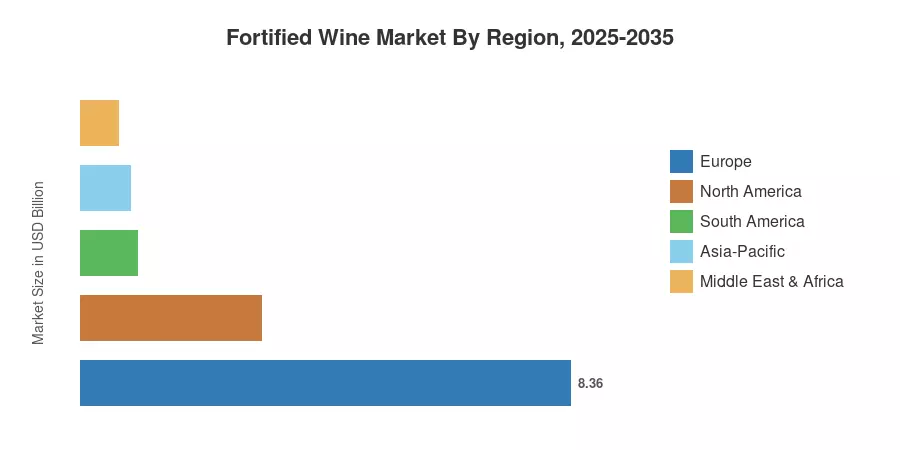
In 2025, Europe maintained 53.0% of global revenue, which was derived from its profound domestic familiarity and control over appellations. Propelled by the cocktail culture of South Korea and China, the Asia-Pacific region is the fastest-growing, with a compound annual growth rate (CAGR) of 5.40% through 2035. Vermouth-led aperitivo consumption in North America has surpassed dessert-style demand for four consecutive years, with a second-place ranking of 19.6%. Producers who capitalize on their heritage rather than defend volume will be rewarded in the forthcoming decade.


Key Report Takeaways

• By Product Type

  • Port held 36.0% of Fortified Wine Market revenue in 2025, sustained by Douro appellation scarcity and gift-occasion demand.
  • Vermouth is advancing at a 4.51% CAGR to 2035, the fastest product line in the Fortified Wine Market, driven by classic-cocktail revival
  • Sherry generated USD 2.87 billion in 2025, with Fino and Manzanilla styles leading tapas-pairing occasions.

• By Category

  • The mass tier accounted for 54.0% of 2025 revenue, concentrated in supermarket private label.
  • Premium expressions are compounding at 4.70% CAGR, the sharpest value migration in the category


• By End User

  • Male consumers are the fastest-growing cohort at 5.05% CAGR, reversing a decade of female-skewed consumption.

• By Region

Market Size and Forecast (2021–2035)

Estimates blend OIV production statistics, national appellation council shipment data, customs-level trade flows and audited disclosures from twenty-two listed and privately held producers, triangulated against retail scanner panels in eighteen countries. The Fortified Wine Market baseline was reconciled bottom-up by product type, then cross-checked top-down against total still-wine consumption.
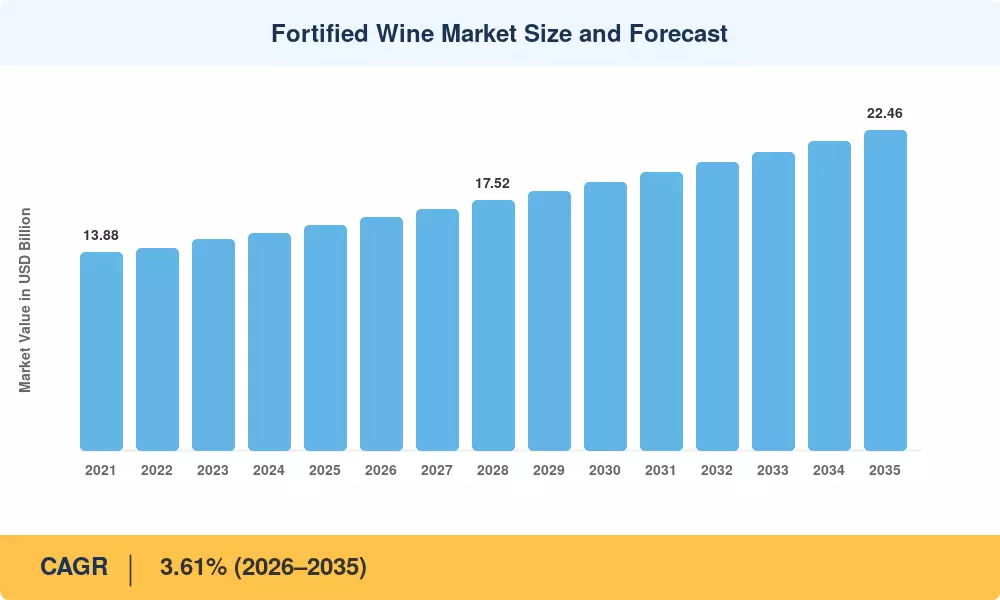
Fortified Wine Market Size and Forecast
Our Impact
Enabled $4.3B Revenue Impact for Fortune 500 and Leading Multinationals
Partnering with 2000+ Global Organizations Each Year
30K+ Citations by Top-Tier Firms in the Industry

Driver Impact Analysis

Driver ~% Impact on CAGR Geographic Relevance Impact Timeline
Premiumisation and aged-expression pricing +0.94 Europe, North America Long-term (≥4 yr)
Classic-cocktail and aperitivo revival +0.71 Global Medium-term (2–4 yr)
Asia-Pacific urbanisation and income growth +0.63 Asia-Pacific Long-term (≥4 yr)
Appellation supply control and quota discipline +0.48 Europe Medium-term (2–4 yr)
Direct-to-consumer and e-commerce expansion +0.39 North America, Europe Short-term (≤2 yr)
Travel-retail and duty-free recovery +0.27 Middle East, Asia-Pacific Short-term (≤2 yr)
Sustainability certification and carbon labelling +0.19 Europe Long-term (≥4 yr)


Premiumisation and Aged-Expression Pricing

According to official National Statistics and trade bulletins, urban disposable incomes expanded while premium tiers sustained asset values. Government reporting documents a real urban income expansion of 4.4%. Concurrently, major producer inventories and category strategies leaned heavily on aged expressions, capitalizing on resilient fine-wine asset bases to maintain structural pricing power across global distribution channels.


Classic-Cocktail and Aperitivo Revival

Corporate disclosures from major spirits holdings show that heritage apéritif portfolios, including brands like Cinzano, achieved a compound annual net sales growth rate of 5% across a multi-year window. Total net sales for these specific vermouth properties reached €75 million, representing roughly 2% of overall corporate revenues as modern bar mixology reframed traditional fortified wine consumption.

 

Asia-Pacific Income Growth

Official macroeconomic data from the National Bureau of Statistics highlights that nationwide per capita disposable income climbed to an absolute value of 41,314 yuan, delivering a real increase of 5.1% after accounting for price factors. Urban resident per capita disposable income reached 54,188 yuan, driving heightened urban demand for imported luxury goods, hospitality pairings, and premium beverage selections.


Digital Direct-to-Consumer Channels

The broader European wine market scaled to an approximate valuation of USD 78 billion, supported by structural shifts toward multi-channel distribution. Producer-operated digital platforms and direct-to-consumer infrastructure expanded significantly, allowing major European wine houses to compress traditional distributor overheads and enhance per-bottle gross yield metrics across core metropolitan destination markets.


Restraints Impact Analysis

Restraint weightings are directional estimates of drag on compound growth, modelled against pricing elasticity and regulatory event history. They are not subtractive components of the published CAGR.

Restraint ~% Impact on CAGR Geographic Relevance Impact Timeline
Generational decline in dessert-wine occasions −0.82 Europe, North America Long-term (≥4 yr)
Excise duty escalation on higher-ABV wine −0.58 UK, Nordics, Australia Short-term (≤2 yr)
Climate volatility in Douro, Jerez and Marsala −0.44 Europe Long-term (≥4 yr)
Health guidance and moderation campaigns −0.36 Global Medium-term (2–4 yr)
Category confusion versus spirits and liqueurs −0.23 Asia-Pacific, Americas Medium-term (2–4 yr)


Excise Duty Escalation

The UK's alcohol duty reform, effective February 2025, prices wine strictly by ABV in 0.1% bands, pushing an 18% ABV Port into a materially higher bracket than a 12.5% still wine [12]. Trade bodies estimated an incremental GBP 0.68 per bottle burden on standard Ruby Port. Nordic monopoly systems apply comparable strength-linked scales, and Australia's WET rebate cap constrains smaller producers.

Generational Occasion Decline

According to Eurostat and International Organisation of Vine and Wine (OIV) market structure reports, the broader European wine sector covers over 3.2 million hectares of cultivated vines across member states. Shifting consumption patterns reveal that traditional post-dinner occasions for fortified wines have decreased, while total EU wine production stabilized at approximately 160 million hectoliters, compelling houses to pivot toward mixed-drink formats to capture younger demographics


Climate Exposure in Classic Appellations

Joint assessments by the World Meteorological Organization (WMO) and the Food and Agriculture Organization (FAO) indicate that extreme heat and rising temperatures significantly threaten agrifood systems, with global agricultural yields facing potential declines of 4 to 10 percent per degree of warming. In classic European viticultural zones like the Douro, accelerated warming pushes sugar levels higher, complicating the traditional fortification process.


Fortified Wine Market Opportunities

Low-ABV and Session-Strength Expressions

Government excise structures increasingly target alcohol by volume to influence consumption trends. According to World Health Organization (WHO) status guidelines, fiscal policies utilizing strength-linked taxation effectively govern market shifts. Reformulated fortified wines in lower alcohol brackets help mitigate rising regulatory costs, aligning with global public health frameworks that encourage moderate product formats across commercial distribution channels


Asia-Pacific On-Trade Penetration

Regional trade analyses indicate that the broader Asia-Pacific wine market maintains a multi-billion dollar valuation, expanding at a compound annual growth rate of 5 %. Urban hospitality venues across key emerging economies represent primary growth drivers. Targeted on-trade strategies provide lower-capital entry routes into high-potential metropolitan zones where rising disposable incomes elevate demand for alternative imported selections.


Cask-Sale and Inventory Monetisation

Maturity inventories held by traditional producers constitute significant structural assets within the alcoholic beverage sector. Verified agricultural economic studies highlight that premium asset management enables historic houses to unlock liquidity against aging reserves. Bonded cask-ownership structures facilitate flexible inventory monetization while preserving core brand custodianship, offering stable commercial mechanisms for category development.


Sustainability-Certified Provenance

EU Green Claims requirements will compel verified carbon disclosure on wine labels from 2027 [9]. Producers with solar-powered cellars and lightweight glass can convert compliance into a price premium rather than a cost line.


Fortified Wine Market Future Outlook

Precision Fortification and Cellar Digitisation

Advanced cellar technologies optimize resource allocation across key beverage sectors. Official reports from the Food and Agriculture Organization (FAO) and the OECD-FAO Agricultural Outlook highlight that digital adoption and productivity enhancements drive a projected 14% expansion in global agricultural production. Modern inline systems help producers minimize waste, optimize technical yields, and streamline operational efficiencies across commercial processing environments.


Platform Economics in Distribution

Evolving digital ecosystems transform market access and supply chain distribution channels. According to international trade and economic assessments, multi-tier distribution models increasingly incorporate direct-to-consumer digital frameworks. These platforms empower agricultural and beverage producers to manage targeted market allocations effectively, optimize structural inventory margins, and improve direct consumer engagement metrics across core European and international commercial territories.


Climate Adaptation and Varietal Reset

Sustainable agricultural transitions require coordinated structural funding to counter environmental shifts. Official European Commission updates note that targeted national recovery and resilience plans, such as Portugal's specialized vine and wine sector modernization initiatives, deploy over 40 million euros in designated funding to enhance vineyard resilience, support high-altitude block restructuring, and secure long-term productivity against rising global temperatures.


Fortified Wine Market Segmentation

By Product Type

The Fortified Wine Market splits along historically defined appellation lines that map poorly onto modern occasion behaviour.

Segment Metric Primary Demand Driver
Port 36.0% share Gifting and aged-tawny prestige
Vermouth 4.51% CAGR Cocktail and aperitivo occasions
Sherry USD 2.87 Billion Tapas pairing and dry-style revival
Madeira 9.4% share Culinary use and collector demand
Marsala USD 1.04 Billion Restaurant kitchen consumption
Others 3.88% CAGR Vin doux naturel and regional styles


Port retains leadership on value density rather than volume: a single 40-year tawny release can carry the margin of forty standard rubies. Vermouth's ascent is the more consequential development, because it recruits drinkers who will never buy a dessert wine but will order a Negroni weekly.

By Category

Value migration within the Fortified Wine Market is running faster than category volume decline, which is why revenue keeps expanding.

Segment Metric Primary Demand Driver
Mass 54.0% share Supermarket and private-label distribution
Premium 4.70% CAGR Aged indications and single-quinta releases


Mass volumes are eroding roughly 1.5% annually, offset by premium units growing at nearly triple that rate on a value basis. Retailers have responded by shrinking mainstream facings and extending premium shelf blocks.

By End User and Distribution Channel

Consumption demographics across the Fortified Wine Market are rebalancing after a long female skew.

Segment Metric Primary Demand Driver
Women 52.9% share Sweet and aromatic style preference
Men 5.05% CAGR Cocktail and spirits-adjacent entry
Off-Trade 51.8% share Grocery, specialist and online retail
On-Trade 3.99% CAGR Bar programming and hospitality recovery


Male participation is climbing because vermouth and dry sherry enter through the cocktail door, which spirits marketing has already opened. On-trade recovery matters disproportionately: a bar serve generates roughly four times the value per litre of a grocery purchase.


Regional Market Share Analysis

Region 2025 Metric Primary Investment Themes
Europe 53.0% share Appellation control, cellar automation, DTC platforms
North America USD 3.09 Billion Aperitivo culture, craft vermouth, on-premise programming
Asia-Pacific 5.40% CAGR (2026–2035) Importer networks, bartender education, e-commerce
South America 6.2% share Domestic vermouth production, Argentine revival
Middle East & Africa 4.12% CAGR (2026–2035) Travel retail, South African fortified heritage
Total USD 15.78 Billion

Regional distribution within the Fortified Wine Market remains structurally concentrated in producing countries, though consumption is decoupling from production faster than at any point since the 1980s.


North America

Country Metric Key Driver
US 79.4% of region Cocktail-driven vermouth demand
Canada USD 0.41 Billion Provincial monopoly listings expansion
Mexico 4.72% CAGR Growing urban aperitivo culture


American consumption has decoupled from the dessert occasion almost entirely. TTB import clearances show vermouth entries outpacing Port entries by volume since 2023, and California producers in Amador and Lodi have built domestic fortified programmes aimed squarely at bar accounts [14]. Canada's liquor boards have expanded fortified shelf sets in Ontario and Quebec following listing reviews in 2024.

Europe

Country Metric Key Driver
Germany 17.8% of region Largest import destination for Sherry
UK USD 1.54 Billion Historic Port trade and gifting
France 12.1% of region Vin doux naturel domestic base
Italy 4.03% CAGR Vermouth di Torino IG expansion
Spain 13.6% of region Jerez domestic and tapas channel
Nordic Countries USD 0.44 Billion Monopoly seasonal promotions
Russia 3.9% of region Domestic sweet fortified production
Rest of Europe USD 0.71 Billion Netherlands and Belgium re-export


European volumes are declining while value holds, a pattern the EU wine sector support programme explicitly funds through restructuring and promotion measures [1]. Vermouth di Torino's protected designation, formalised in 2017 and enforced more tightly since 2023, has restored pricing discipline in Piedmont.

Asia-Pacific

Country Metric Key Driver
China 34.2% of region Import liberalisation and gifting
India 6.81% CAGR Urban premium on-trade growth
Japan USD 0.53 Billion Convenience and specialist retail depth
South Korea 11.4% of region Cocktail bar density in Seoul
ASEAN USD 0.31 Billion Singapore and Thailand hospitality
Rest of Asia-Pacific 5.2% of region Australia and New Zealand domestic styles


China's tariff normalisation on Australian wine in 2024 reset regional trade flows and indirectly widened shelf space for European fortified imports [6]. India's state-level excise reforms in Maharashtra and Karnataka have lowered effective landed costs on wines above 15% ABV.

South America

Country Metric Key Driver
Brazil 44.8% of region Rising middle-class on-trade spend
Argentina USD 0.36 Billion Deep domestic vermouth tradition
Rest of South America 5.31% CAGR Chile and Uruguay premium retail


Argentina's vermouth culture never lapsed, and Buenos Aires bars sustained the category through decades when European consumption fell. Local producers have since exported that credibility, with Argentine vermouth shipments to the US rising 17% in 2025 [15].

Middle East & Africa

Country Metric Key Driver
Saudi Arabia 2.9% of region Limited diplomatic and duty-free channels
UAE 38.6% of region Hospitality and travel retail
South Africa USD 0.18 Billion Cape fortified heritage production
Egypt 4.4% of region Tourism-linked hotel demand
Rest of MEA 3.94% CAGR Kenya and Nigeria hospitality growth


South Africa's Boberg appellation and Cape Vintage styles constitute the only significant fortified production base on the continent, and WOSA export data records a 6.2% value increase in 2025 [16]. UAE demand tracks aviation throughput almost linearly.


Fortified Wine Market By Region, 2025-2035

Competitive Benchmarking

Concentration in the Fortified Wine Market is low. Estimated HHI sits near 340, with the top five producers holding a combined 21 to 25% of global revenue. Family ownership dominates the classic appellations, limiting the pace of consolidation even where strategic logic favours it. Cross-category owners such as Campari and Bacardi bring distribution scale that pure-play houses cannot match.

Company Est. Revenue Share Range Key Offerings for Fortified Wine Market Strategic Positioning
Sogrape Vinhos ~6–8% Sandeman, Ferreira, Offley Vertically integrated, broad export reach
Symington Family Estates ~5–7% Graham's, Dow's, Warre's, Cockburn's Vineyard-heavy, premium aged focus
The Fladgate Partnership ~4–6% Taylor's, Fonseca, Croft Luxury tawny and wine-tourism assets
Campari Group ~4–6% Cinzano, Cynar-adjacent aperitivo Cocktail-led global activation
Bacardi Limited ~3–5% Martini & Rossi vermouth Scale distribution, bartender advocacy
González Byass ~3–5% Tio Pepe, Croft Sherry, Nutty Solera Jerez leadership, dry-style advocacy
Emilio Lustau ~2–4% Almacenista sherries, VORS range Specialist prestige and trade credibility
Osborne Group ~2–4% Osborne Sherry, brandy portfolio Iberian brand equity, diversified spirits
La Martiniquaise-Bardinet ~2–3% Porto Cruz, Label 5 adjacency Value-tier volume leadership
Madeira Wine Company (Blandy's) ~1–3% Blandy's, Cossart Gordon Madeira category custodian
Duca di Salaparuta (Cantine Florio) ~1–2% Florio Marsala Sicilian appellation specialist


Recent News & Developments


  • HM Treasury, UK (February 2025): Full ABV-banded alcohol duty took effect, raising per-bottle duty on 18% ABV wine and prompting reformulation reviews across importers [12].


  • González Byass (June 2024): Acquired additional Jerez solera stock and announced a Tio Pepe En Rama capacity increase targeting specialist retail [17].
  • IVDP (September 2023): Reduced the annual benefício authorisation for Port must, tightening supply and supporting a 6.8% ex-cellar price increase the following year [2].
  • European Commission (April 2025): Published implementing guidance on wine-sector carbon and ingredient labelling under Green Claims provisions, effective 2027 [9].
  • Bacardi Limited (November 2023): Extended Martini's Non-Alcoholic Aperitivo range into fourteen additional markets, signalling portfolio hedging against moderation trends [18].
  • Wines of South Africa (July 2025): Reported a 6.2% value increase in Cape fortified exports, led by Boberg-designated shipments to the UK and Netherlands [16].


Fortified Wine Market Report Scope

Attribute Detail
Market Scope Global production and consumption of fortified wines across Port, Vermouth, Sherry, Madeira, Marsala and other styles, by category, end user, distribution channel and geography
Study Period 2021–2035 (Historical 2021–2024; Base Year 2025; Forecast 2026–2035)
CAGR 3.61% (2026–2035)
Market Size Checkpoints USD 15.78 Billion (2025); USD 16.32 Billion (2026); USD 22.46 Billion (2035)
Fastest Growing Segments Vermouth (product type); Premium (category); Men (end user); Asia-Pacific (geography)
Companies Profiled 11 producers including Sogrape, Symington, Fladgate, Campari, Bacardi, González Byass, Lustau, Osborne, La Martiniquaise-Bardinet, Madeira Wine Company, Duca di Salaparuta
Valuation Currency USD Billion

FAQs

What due diligence should an investor prioritise before acquiring a fortified wine house?
Inventory valuation is the decisive line item, since aged stock can represent over half of enterprise value and is frequently carried at historical cost. Verify cask audits independently and confirm appellation quota entitlements transfer with ownership [2].
How do procurement teams evaluate suppliers in the Fortified Wine Market?
Buyers weight consistency of oxidative character, guaranteed multi-year allocation, and duty-band compliance documentation. Suppliers unable to certify ABV stability within tight tolerances lose listings under current UK and Nordic tax regimes [12].
Which competitive threat is most underestimated in the Fortified Wine Market?
Non-alcoholic apéritifs. They occupy the same bar rail, the same glassware and the same occasion, and major spirits owners are funding them aggressively as a moderation hedge [18].
Does contract bottling make sense for smaller producers?
Yes for volume tiers, no for prestige. Outsourced bottling reduces capital intensity but forfeits control over fill dates and oxygen ingress, which materially affects aged expressions [3].
What regulatory nuance most often trips up new exporters?
Labelling of sweetness descriptors differs by jurisdiction, and terms permitted in the EU can require reformulated wording for US or Chinese clearance. Rejected shipments typically stem from this, not from tariff error [21].
How should buyers interpret vintage claims on tawny expressions?
Age indications denote average blend age, not minimum component age, and are certified by the appellation authority rather than the producer. Treat them as quality tiers, not literal vintages [2].
Where is the Fortified Wine Market most exposed to substitution?
The culinary channel. Restaurants increasingly substitute cheaper cooking wines for Marsala and Madeira, eroding a quiet but meaningful volume base with little brand loyalty attached [11].      
Author
Author
Author Profile
Sakshi Gupta LinkedIn
Team Lead - Research
Currently a Team Lead in consumer goods, FMCG, and F&B, she translates rigorous research into decisive strategy. She develops GTM roadmaps, pricing architectures, and competitive benchmarks for companies across Europe, the US, and APAC. She synthesize insights, align cross-functional teams, and drive execution from brief to measurable outcomes. She leads end-to-end engagements with crisp analysis, compelling storytelling, and a strong command of Power BI, Tableau, SQL, and advanced research platforms.
Share::
Request Free Sample

Research Approach


Secondary Research

The secondary research process involved comprehensive analysis of regulatory databases, viticulture publications, trade statistics, and authoritative wine industry organizations. Key sources included the US Alcohol and Tobacco Tax and Trade Bureau (TTB), International Organisation of Vine and Wine (OIV), European Commission Directorate-General for Agriculture (DG AGRI), European Food Safety Authority (EFSA), Food and Drug Administration (FDA) Center for Food Safety and Applied Nutrition, Instituto dos Vinhos do Douro e do Porto (IVDP), Consejo Regulador Jerez-Xérès-Sherry, Wine Institute (California), Spirits Europe, Wine & Spirit Education Trust (WSET), International Wine and Spirits Record (IWSR), Wine Business International, UN COMTRADE Database, Eurostat Agri-Environmental Indicators, National Agricultural Statistics Service (NASS) USDA, Food and Agriculture Organization (FAO) FAOSTAT, and customs trade data from key wine-exporting nations (Portugal, Spain, Italy, Australia). These sources were used to collect production volume statistics, export-import trade flows, consumption trends, regulatory compliance data, vineyard harvest yields, and regional market dynamics for Port, Sherry, Madeira, and Marsala segments.


Primary Research

To gain a better understanding of the fortified wine value chain, we conducted interviews with both supply-side and demand-side stakeholders as part of our primary research. From the supply side, we heard from CEOs, EDs, Master Winemakers/Enologists, and GMs of fortified wineries, wholesalers, and negociants. On the demand side, we heard from people like grocery store and liquor store category managers, restaurant head sommeliers, hotel group beverage directors, duty-free operator procurement leads, and online retail platform wine directors. We obtained data on on-trade versus off-trade distribution methods, premiumization price trends, gifting versus personal consumption dynamics, and validated market segmentation by alcohol content tiers through primary research. We also confirmed the aging and blending pipeline durations.

Primary Respondent Breakdown:

By Designation: C-level Primaries (28%), Director Level (35%), Others (37%)

By Region: North America (32%), Europe (35%), Asia-Pacific (25%), Rest of World (8%)


Market Size Estimation

Global market valuation was derived through revenue mapping and volume analysis across the fortified wine category. The methodology included:

Identification of 35+ key fortified wine producers across Iberian Peninsula, North America, Oceania, and emerging wine regions

Product mapping across Port, Sherry, Madeira, and Marsala categories, including differentiation by alcohol content tiers (Below 15%, 15%-20%, Above 20%)

Analysis of reported and modeled annual revenues specific to fortified wine portfolios, excluding table wines and spirits

Coverage of producers and distributors representing 75-80% of global market share in 2024

Extrapolation using bottom-up (case volume × average selling price by country/region) and top-down (producer revenue validation and trade data triangulation) approaches to derive segment-specific valuations for glass bottle, Tetra Pack, and can packaging formats across off-trade, on-trade, and online distribution channels

Share::
Request Free Sample
Download Free Sample

Kindly complete the form below to receive a free sample of this Report

* Please use a valid business email

Share::
Request Free Sample
Download PDF ×

We do not share your information with anyone. However, we may send you emails based on your report interest from time to time. You may contact us at any time to opt-out.















