Fresh Cherries Market

Key Players: Stemilt Growers, CMI Orchards, Exportadora Subsole, Grupo Garces, Dalian Shengshida Trading, Zirkle Fruit, Gebbers Farms, T&G Global

Fresh Cherries Market

Fresh Cherries Market Size, Share, Industry Trend & Analysis Research Report By Type (Sweet Cherries, Sour/Tart Cherries), By Distribution Channel (Supermarkets/Hypermarkets, Specialty Stores, Online Retail, Others), By End Use (Fresh Consumption, Food Processing, Foodservice), By Region (North America, Europe, Asia-Pacific, South America, MEA) - Forecast to 2035.
ID: MRFR/FnB/9556-HCR
128 Pages
Tejas Chaudhary
Last Updated: June 11, 2026
 

Fresh Cherries Market Summary

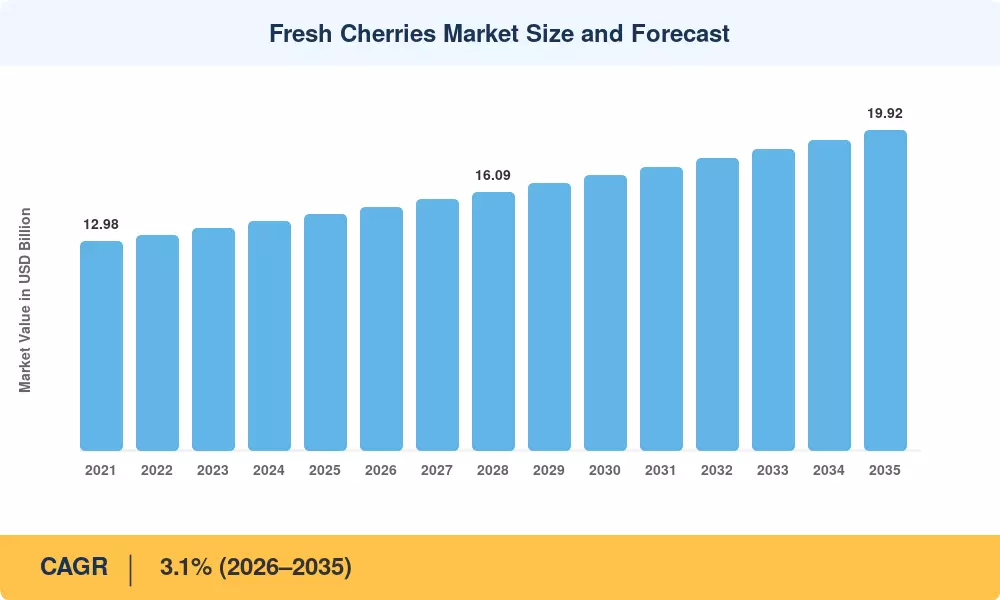
The fresh cherries market reached a valuation of USD 14.68 billion in 2025 and is projected to grow from USD 15.14 billion in 2026 to USD 19.92 billion by 2035, registering a CAGR of 3.1% during the forecast period. Rising consumer preference for nutrient-rich stone fruits, combined with government-backed cold-chain infrastructure programs across major producing nations, continues to fuel this upward trajectory. Fresh cherry export and import volumes expanded by over 8% between 2022 and 2024 alone, driven largely by bilateral trade agreements between Chile, China, and the United States [2].

A technology-led transformation is reshaping how cherry stone fruit harvesting takes place across commercial orchards. Traditional hand-picking operations—still dominant in parts of Europe and Turkey—are giving way to high-density trellised orchard systems paired with mechanical harvesters and AI-enabled optical sorters. The USDA's Specialty Crop Block Grant Program allocated USD 72.9 million in 2024 toward post-harvest innovation, a significant portion of which targeted controlled-atmosphere storage and modified-atmosphere packaging for sweet and sour cherry varieties [3].

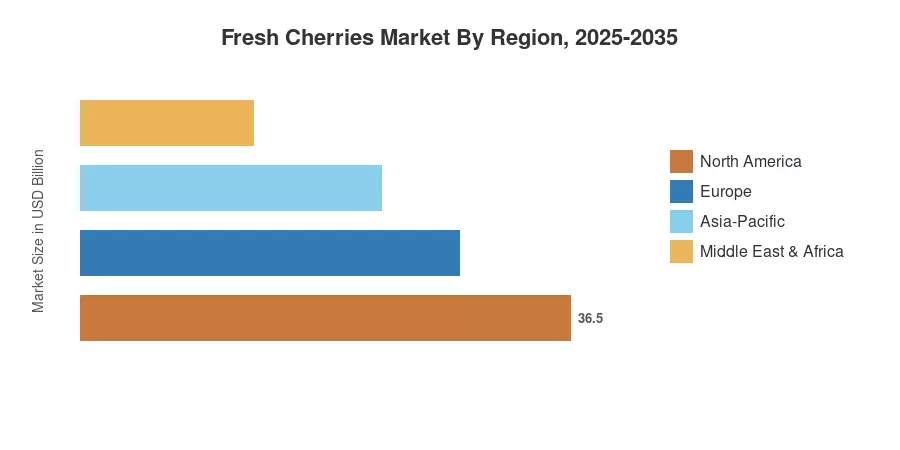
Asia-Pacific commands the largest share of the fresh cherries market at approximately 30.5% of global value, led by China's massive domestic consumption base. South America is the fastest-growing region, expanding at a 2.7% CAGR through 2035 as Chilean and Argentine exporters invest in counter-seasonal supply chains. Europe holds roughly 26% of the global fresh cherries market, anchored by Turkey, Spain, and Italy—three nations where Bing and Rainier cherry types are cultivated at scale for both domestic and export channels [4]. The decade ahead will be shaped by precision agriculture adoption and evolving consumer expectations around traceability and cherry antioxidant properties.


Key Report Takeaways

• By Type

  • Sweet cherries accounted for approximately 68% of the fresh cherries market in 2025, reflecting consumer demand for premium dessert-grade fruit across North America and Asia-Pacific
  • Sour/tart cherry varieties are expanding at a 3.6% CAGR, fueled by growing use in functional beverages, dietary supplements, and baked goods

• By Distribution Channel

  • Supermarkets and hypermarkets generated an estimated USD 6.45 billion in fresh cherry sales in 2025, reinforcing their dominance as the primary retail touchpoint for the fresh cherries market
  • Online retail channels are registering the fastest growth at 4.8% CAGR, supported by direct-to-consumer farm box subscriptions and cold-chain last-mile logistics

• By Region

  • Asia-Pacific held 30.5% of the fresh cherries market share in 2025, driven by China's domestic production exceeding 4.5 million metric tons annually
  • South America is projected to record a 2.7% CAGR through 2035, with Chilean exporters capitalizing on counter-seasonal demand windows
  • North America contributed approximately USD 3.52 billion to the fresh cherries market in 2025


Fresh Cherries Market Size and Forecast (2021–2035)

MRFR's market sizing methodology combines top-down revenue estimation with bottom-up production volume analysis across 42 cherry-producing countries. Historical data draws on FAO production statistics, UN Comtrade bilateral trade records, and proprietary grower surveys. Forecast projections apply econometric modeling adjusted for climate variability, orchard expansion rates, and per-capita consumption trends in key import markets[5].

Fresh Cherries Market Size and Forecast
Our Impact
Enabled $4.3B Revenue Impact for Fortune 500 and Leading Multinationals
Partnering with 2000+ Global Organizations Each Year
30K+ Citations by Top-Tier Firms in the Industry
 

Driver Impact Analysis

Driver ~% Impact on CAGR Geographic Relevance Impact Timeline
Rising health-conscious consumption & cherry antioxidant properties +0.6% Global Short-term (≤2 yr)
Cold-chain infrastructure expansion +0.5% Asia-Pacific, South America Medium-term (2–4 yr)
High-density orchard systems & precision agriculture +0.4% North America, Europe Medium-term (2–4 yr)
Growing fresh cherry export and import corridors +0.4% Chile, China, US Short-term (≤2 yr)
E-commerce and DTC fresh fruit platforms +0.3% North America, Asia-Pacific Long-term (≥4 yr)
Government specialty crop grants & subsidies +0.3% US, EU, Turkey Medium-term (2–4 yr)
Premiumization of sweet and sour cherry varieties +0.2% Europe, Japan Long-term (≥4 yr)


Health-Conscious Demand and Cherry Antioxidant Properties

Consumer awareness of cherry antioxidant properties has surged over the past five years, with anthocyanin and melatonin content positioning cherries as a functional superfruit. This research has been amplified by social media wellness trends, pushing fresh cherry retail premiums 12–15% above comparable stone fruits in the US market. The fresh cherries market benefits directly as health-driven buyers shift spending from processed snacks to whole-fruit alternatives.

Cold-Chain Infrastructure Expansion

Controlled environment logistics is the biggest enabler of extending cherry shelf life from 14 days to more than 45 days during long-haul ocean transit. The 14th Five-Year Plan includes an allocation of USD 4.2 billion from China’s State Council to construct a nationwide cold chain, beginning with the renovation of stone fruit corridors in Shandong and Liaoning provinces [8]. From 2023 to 2025, Chile’s ProChile agency co-financed the construction of 23 new cold-storage facilities, increasing the country’s capacity to export by 38,000 metric tons per year [4]. These initiatives directly assist the increasing volume of fresh cherry export and import cargoes across the Pacific basin.


Precision Agriculture and Cherry Stone Fruit Harvesting Innovation

The transition from labor-intensive hand-picking to mechanized cherry stone fruit harvesting is reshaping orchard economics. Washington State—responsible for over 60% of US sweet cherry output—saw mechanical harvester adoption rise from 8% of commercial acreage in 2020 to an estimated 22% by 2025 [3]. High-density trellised systems, using the Upright Fruiting Offshoots (UFO) architecture, reduce per-acre labor costs by roughly 35% while boosting marketable yield by 20%.

E-Commerce and Direct-to-Consumer Channels

US online grocery penetration for fresh produce topped 14% by late 2024, and premium cherries are among the top-five fresh fruit categories by online revenue per unit [11]. Driscoll’s Direct and farm-box aggregators send sweet and sour cherry types in temperature-controlled packaging within 48 hours after the harvest, commanding price premiums of 25–30% over retail. In China, cherry sales for the 2024 import season were predicted at USD 680 million, boosted by livestream commerce on Douyin and Pinduoduo [10].


Restraints Impact Analysis

The restraint percentages below are directional estimates of headwind intensity and should not be summed against the drivers to derive net CAGR impact on the fresh cherries market.

Restraint ~% Impact on CAGR Geographic Relevance Impact Timeline
Climate volatility and frost damage –0.5% Pacific NW US, Central Europe Short-term (≤2 yr)
Perishability and post-harvest losses –0.4% Africa, South/Southeast Asia Medium-term (2–4 yr)
Labor shortages in key producing regions –0.3% US, EU, Australia Medium-term (2–4 yr)
Phytosanitary and trade compliance barriers –0.2% Global export corridors Long-term (≥4 yr)
High orchard establishment costs –0.2% Emerging markets Long-term (≥4 yr)


Climate Volatility and Frost Events

Cherry orchards require 800–1,200 chill hours below 7°C to set fruit properly, making them acutely sensitive to warming winters and late-spring frost events. In 2023, weather anomalies severely disrupted market timing as a cold spring delayed California’s harvest, compressing it directly into Washington's peak shipping window. European producers in Germany's Altes Land and Spain's Valle del Jerte face similar exposure. Climate models project a 15% reduction in reliable chill-hour zones across the Northern Hemisphere by 2035, threatening the long-term viability of traditional growing regions within the fresh cherries market [13].

Perishability and Post-Harvest Losses

Fresh cherries are among the most perishable of the commercial fruits. Their shelf life under normal refrigeration is 7–14 days. In sub-Saharan Africa and some parts of Southeast Asia, post-harvest losses can be as high as 30–40% owing to poor cold-chain infrastructure [16]. In developed markets, bruising during cherry stone fruit harvesting and transit-related browning of stems diminish the percentage of fruit that reaches premium grade. The losses have put sustained pressure on margins for growers and exporters, limiting the growth in value in the fresh cherries market even as consumer demand climbs.

Fresh cherries are among the most perishable commercial fruits, with a shelf life of 7–14 days under standard refrigeration. Post-harvest losses in sub-Saharan Africa and parts of Southeast Asia can reach 30–40% due to inadequate cold-chain infrastructure [16]. Even in developed markets, bruising during cherry stone fruit harvesting and transit-related stem browning reduces the percentage of fruit reaching premium grade. These losses create persistent margin pressure for growers and exporters, constraining value growth in the fresh cherries market despite rising consumer demand.

Labor Shortages and Rising Wage Costs

Cherry orchards remain among the most labor-intensive horticultural operations, with hand-harvesting accounting for 50–60% of total production costs in the United States [17]. The H-2A visa program continues to break national utilization records during peak season across Washington, Oregon, and California. Australian growers report similar constraints under the Pacific Australia Labour Mobility scheme. These shortages inflate per-kilogram costs for sweet and sour cherry varieties, ultimately compressing margins for mid-tier producers in the fresh cherries market.


Fresh Cherries Market Opportunities

Counter-Seasonal Export Corridor Expansion

Chile, Argentina, and South Africa harvest cherries from November to February, which nicely fits Northern Hemisphere off-season demand periods. For example, in 2023/24, Chilean exports of cherries to China alone exceeded USD 2.1 billion [4]. Investment in refrigerated container fleets and dedicated cherry charter flights offers a multi-billion dollar expansion runway for the fresh cherries sector until 2035

Chile, Argentina, and South Africa harvest cherries from November through February, aligning perfectly with Northern Hemisphere off-season demand windows. Chilean cherry exports to China alone surpassed USD 2.1 billion in the 2023/24 season [4]. Investment in refrigerated container fleets and dedicated cherry charter flights presents a multi-billion-dollar expansion runway for the fresh cherries market through 2035

Functional Food and Nutraceutical Integration

The documented cherry antioxidant properties—particularly high anthocyanin and melatonin concentrations—position fresh cherries as a crossover ingredient for functional beverages, sleep-aid supplements, and anti-inflammatory formulations [14]. The Global tart cherry juice concentrate market already commands a USD 120 million in 2024, and fresh-format functional applications represent the next frontier. Brands that emphasize traceability and varietal specificity, particularly for Bing and Rainier cherry types, can capture premium positioning

AI-Enabled Grading and Traceability Platforms

Optical sorting technology powered by machine learning can classify cherries by size, color, firmness, and blemish presence at throughput rates exceeding 12 tons per hour [12]. When integrated with blockchain-based traceability, these systems create a digital provenance chain from orchard to shelf. Growers adopting such platforms report 8–12% higher pack-out rates for premium grades, directly supporting margin expansion in the fresh cherries market

Emerging Market Demand in India and Southeast Asia

India's organized fresh fruit retail sector is growing at 11% annually, yet per-capita cherry consumption remains below 50 grams [10]. As modern retail penetration deepens across tier-2 and tier-3 cities and cold-chain coverage improves through government programs like the Pradhan Mantri Kisan SAMPADA Yojana, India presents an outsized growth opportunity for fresh cherry export and import flows

Organic and Regenerative Cherry Cultivation

The EU’s Farm to Fork Strategy wants 25% of farmland to be organic by 2030, with cherry orchards in Austria, Switzerland, and portions of Germany as early adopters [9]. Organic-certified sweet and sour cherry varietals are sold at retail for 40-60% more than conventional fruit. Practices like cover farming and decreased tillage that regenerate soil also bolster the sustainability story and are consistent with ESG buying requirements from major European retailers.


Fresh Cherries Market Future Outlook

Precision Agriculture and Data-Driven Orchard Management

The next decade will see cherry growers increasingly adopt sensor-equipped, data-driven orchard management systems. Drone-based canopy imaging, soil moisture IoT sensors, and predictive bloom-timing algorithms will enable growers to optimize irrigation, nutrient delivery, and harvest scheduling. Washington State University's SmartOrchard initiative projects that precision tools could reduce water consumption by 25% and improve cherry stone fruit harvesting efficiency by 18% across participating orchards by 2030 [3][12].

Sustainability and Carbon-Neutral Supply Chains

ESG reporting mandates from major retailers—including Tesco, Carrefour, and Costco—are pushing cherry supply chains toward carbon-neutral certification by 2032. Scope 3 emissions tracking across orchard operations, processing, and logistics will become standard for top-tier suppliers in the fresh cherries market. The Science Based Targets initiative (SBTi) has already enrolled major fruit companies, and growers cultivating sweet and sour cherry varieties will face increasing pressure to document water footprint, pesticide reduction, and biodiversity metrics [9][19].

Varietal Innovation and Climate Adaptation

Public and private breeding programs are racing to develop cherry cultivars with lower chill-hour requirements, extended harvest windows, and enhanced cherry antioxidant properties. The International Society for Horticultural Science (ISHS) has identified 23 new cultivar releases since 2022, targeting heat tolerance and rain-crack resistance [13]. These varietal advances will expand viable growing zones southward in Europe and into new regions of South America, reshaping the production geography of the fresh cherries market over the coming decade.

Platform Economics and Digital Trade Infrastructure

Digital trade platforms—ranging from Alibaba's Tmall Fresh to US-based specialty aggregators—are compressing the intermediary chain between growers and end consumers. Blockchain-verified provenance, real-time quality monitoring during transit, and dynamic pricing algorithms will define the next generation of fresh cherry export and import infrastructure. The World Bank estimates that digitizing agricultural trade documentation could reduce transaction costs by 15–20% across perishable commodity supply chains by 2030 [20].


Fresh Cherries Market Segmentation

By Type

Segment Key Metric Primary Demand Driver
Sweet Cherries 68% market share (2025) Fresh consumption; premium retail and gifting
Sour/Tart Cherries 3.6% CAGR (2026–2035) Functional foods; baking; juice concentrate


Sweet cherries dominate the fresh cherries market by a wide margin, accounting for roughly two-thirds of total value. Varieties such as Bing, Rainier, Lapins, and Sweetheart command premium pricing across North American and Asian retail channels, where consumers prioritize size, crunch, and sugar content. The Bing and Rainier cherry types alone represent over 45% of US commercial sweet cherry production, with Rainier commanding a 30–40% retail premium due to its distinctive yellow-red skin and delicate flavor profile [6].

Sour cherry varieties—including Montmorency, Morello, and Balaton—are the fastest-growing segment within the fresh cherries market, driven by scientific validation of their cherry antioxidant properties and anti-inflammatory compounds. Michigan's Montmorency crop supplies approximately 75% of US tart cherry production, with over 60% directed toward processing for juice concentrate, dried snacks, and nutraceutical extracts [14]. Fresh-format sour cherry consumption is expanding in European markets, particularly in Germany, Poland, and Hungary, where culinary traditions support sweet and sour cherry varieties in baking and preserves.

By Distribution Channel

Segment Key Metric Primary Demand Driver
Supermarkets/Hypermarkets USD 6.45 Billion (2025) Broad consumer reach; promotional pricing
Specialty Stores 14% market share Curated varietal selection; organic emphasis
Online Retail 4.8% CAGR (2026–2035) Farm-box subscriptions; cold-chain last-mile
Others (Farmer Markets, Wholesale) USD 1.32 Billion (2025) Direct grower-consumer relationship


Supermarkets and hypermarkets remain the backbone of the fresh cherries market distribution system, leveraging centralized procurement and promotional pricing to drive volume during peak season windows. Chains like Kroger, Walmart, and Costco in the US, and Aldi, Lidl, and Carrefour in Europe, negotiate season-long supply contracts with major cherry cooperatives. Online retail is the fastest-growing channel, with platforms offering next-day delivery of premium Bing and Rainier cherry types packed within hours of cherry stone fruit harvesting.

By End Use

Segment Key Metric Primary Demand Driver
Fresh Consumption (Retail) 72% market share (2025) Health-trend snacking; gifting culture in Asia
Food Processing USD 2.64 Billion (2025) Juice, dried fruit, bakery ingredients
Foodservice (HoReCa) 3.4% CAGR (2026–2035) Fine dining; cocktail garnishing; dessert applications


Fresh retail consumption drives the majority of value in the fresh cherries market, with cherry antioxidant properties increasingly featured in consumer marketing campaigns. Food processing absorbs a substantial volume of both sweet and sour cherry varieties, particularly in North America and Eastern Europe, where juice concentrate and individually quick-frozen (IQF) cherry products serve year-round demand across bakeries and foodservice operators.


Regional Market Share Analysis

Region Key Metric Primary Investment Themes
Asia-Pacific 30.5% market share (2025) Domestic orchard expansion; cold-chain modernization
Europe USD 3.82 Billion (2025) Organic conversion; varietal diversification
North America 3.0% CAGR (2026–2035) Mechanical harvesting; DTC e-commerce
South America 2.7% CAGR (2026–2035) Export infrastructure; air-freight logistics
Middle East & Africa USD 1.10 Billion (2025) Import facilitation; retail modernization
Total USD 14.68 Billion (2025)

The fresh cherries market exhibits a geographically concentrated production base paired with an increasingly globalized consumption footprint. Asia-Pacific leads in both production volume and consumption value, while South America drives the fastest value growth through counter-seasonal exports of premium sweet and sour cherry varieties.


North America

Country Key Metric Key Driver
US 82% of regional share Washington, Oregon, California production clusters
Canada 2.8% CAGR British Columbia's Okanagan Valley expansion
Mexico USD 0.12 Billion Growing domestic consumption of imported sweet cherries


The United States dominates North America's fresh cherries market, with Washington State alone producing approximately 300,000 metric tons of sweet cherries annually. Investments in cherry stone fruit harvesting automation and controlled-atmosphere storage are accelerating, particularly as labor cost inflation pressures growers to adopt mechanical solutions. Canada's Okanagan Valley—home to roughly 1,200 commercial cherry orchards—has seen a 15% increase in planted acreage since 2021, with Bing and Rainier cherry types capturing premium export pricing to Asian markets [6].

Europe

Country Key Metric Key Driver
Germany USD 0.52 Billion Altes Land orchard region; organic premium demand
UK 3.4% CAGR Kent-region production growth and import diversification
France 9.8% of regional share Provence and Rhône Valley heritage cultivars
Italy USD 0.58 Billion Puglia and Veneto production; Ferrovia and Durone varieties
Spain 12.5% of regional share Valle del Jerte denomination of origin
Nordic Countries 2.2% CAGR Import-driven; premium organic segment
Russia USD 0.31 Billion Domestic production in Krasnodar Krai
Rest of Europe 18% of regional share Turkey (leading global producer), Austria, Switzerland


Europe's fresh cherries market reflects deep heritage cultivation traditions alongside aggressive organic conversion targets. Turkey—though categorized within the broader European region—remains the world's largest cherry producer by volume, exceeding 830,000 metric tons in 2024 [5]. The EU's Farm to Fork policy is driving conversion to organic-certified sweet and sour cherry varieties, particularly in Alpine regions where premium pricing offsets lower per-hectare yields.

Asia-Pacific

Country Key Metric Key Driver
China 62% of regional share Shandong, Liaoning domestic production; massive import appetite
India 4.1% CAGR Kashmir and Himachal Pradesh cultivation expansion
Japan USD 0.48 Billion Satonishiki and premium gifting culture
South Korea 3.2% CAGR Import growth from the US, Chile; health-trend consumption
ASEAN USD 0.22 Billion Import-driven premium positioning in Thailand, Vietnam
Rest of Asia-Pacific 5.8% of regional share Australia, New Zealand production


Asia-Pacific anchors the fresh cherries market through China's dual role as both the world's largest producer and consumer. Domestic cherry production from Shandong and Liaoning provinces exceeded 4.5 million metric tons in 2024, yet import demand—primarily from Chile and the US—continues to rise as consumers seek larger-caliber fruit with stronger cherry antioxidant properties [10]. Japan's gifting culture sustains ultra-premium pricing for domestically grown Satonishiki cherries, with single boxes exceeding USD 150 at department stores.

South America

Country Key Metric Key Driver
Brazil USD 0.08 Billion Nascent domestic market; temperate-zone trials in southern states
Argentina 3.1% CAGR Mendoza and Patagonia orchards; expanding export capacity
Rest of South America 45% of the regional share Chile dominates as the world's #1 cherry exporter by value


South America's growth story in the fresh cherries market is overwhelmingly a Chilean narrative. The country shipped over 450,000 metric tons of fresh cherries during the 2023/24 season, with approximately 90% destined for China [4]. Argentine producers in Mendoza and Neuquén are scaling Bing and Rainier cherry types to diversify the region's export portfolio beyond Chile's established corridors of fresh cherry export and import.

Middle East & Africa

Country Key Metric Key Driver
Saudi Arabia 28% of the regional share Import-driven; premium retail positioning
UAE 3.5% CAGR Dubai as a regional re-export hub
South Africa USD 0.15 Billion Western Cape production; growing domestic and export volumes
Egypt 2.0% CAGR Early-stage domestic cultivation in the Nile Delta
Rest of MEA 30% of regional share Turkey-sourced imports across the Levant and North Africa


The Middle East & Africa region contributes a smaller share to the global fresh cherries market, but growth dynamics are compelling. The UAE functions as a logistics hub for cherry redistribution across the Gulf states, with Dubai's free-zone cold-storage facilities handling cherry stone fruit harvesting season shipments from Turkey, Chile, and the US. South Africa's Western Cape orchards represent the continent's most commercially significant production zone, exporting primarily to the UK and EU markets.


Fresh Cherries Market By Region, 2025-2035
 

Competitive Benchmarking

The fresh cherries market is moderately fragmented, with the top five companies holding an estimated 18–24% combined revenue share. The industry structure reflects a mix of vertically integrated grower-shippers, cooperatives, and specialized exporters. The Herfindahl-Hirschman Index (HHI) for the global fresh cherry trade sits below 600, indicating low market concentration with no single entity controlling pricing across major corridors[21].

Company Est. Revenue Share Range Key Offerings for the Fresh Cherries Market Strategic Positioning
Stemilt Growers ~4–6% Premium sweet cherries (Bing, Rainier, Skylar Rae) Vertically integrated WA-based grower-packer-shipper
CMI Orchards ~3–5% Proprietary varieties; year-round supply via Southern Hemisphere partners Brand-led innovation; varietal licensing
Rainier Fruit Company ~3–5% Conventional and organic sweet cherries Sustainability leadership; organic pioneer
Exportadora Subsole ~2–4% Chilean counter-seasonal exports Scale exporter; China-focused logistics
Grupo Garces ~2–4% Chilean premium cherries Air-freight premium positioning
Dalian Shengshida Trading ~2–3% Chinese domestic and import distribution Cold-chain logistics; e-commerce integration
Zirkle Fruit ~2–3% WA-state sweet cherry production Co-op model; regional distribution strength
Gebbers Farms ~1–3% Large-acreage WA production Volume-oriented; mechanical harvesting adopter
T&G Global ~1–2% New Zealand and Australian cherries Southern Hemisphere quality positioning
Vignola/Cooperativa Ortofrutticola ~1–2% Italian Ferrovia and Durone varieties EU premium; denomination-of-origin branding


Recent News & Developments

  • Stemilt Growers (March 2025): Maximized premium position in the sweet cherry market by scaling high-elevation Moon Cherries program, utilizing specialized orchards located 2,500 feet above sea level to naturally extend the late-summer Pacific Northwest shipping window.
  • ProChile (January 2025): Collaborated with Frutas de Chile to maximize distribution efficiency for the historic winter campaign, resulting in record-shattering Chilean fresh cherry exports to China that officially surpassed a valuation of USD 3.0 billion.


  • Alibaba Group (September 2024): Partnered with Chilean Cherry Committee to integrate real-time quality tracking via Cainiao Smart Logistics for the 2024/25 import season, covering over 120,000 metric tons of cherry shipments to China [10].
  • European Commission (June 2024): Updated regular phytosanitary protective controls under plant health frameworks, mandating rigorous border screening protocols for invasive fruit pests to safeguard European stone fruit orchards from global supply-chain contamination.


Fresh Cherries Market Report Scope

Parameter Detail
Market Scope Global fresh cherries market covering production, consumption, trade, and pricing
Study Period 2021–2035
CAGR 3.1% (2026–2035)
Market Size (2025) USD 14.68 Billion
Market Size (2035) USD 19.92 Billion
Fastest Growing Segment Sour/Tart Cherries (by type); Online Retail (by channel); South America (by region)
Companies Profiled 10 major players, including Stemilt Growers, CMI Orchards, Rainier Fruit Company, Exportadora Subsole
Valuation Currency USD Billion


FAQs

What differentiates the fresh cherries market from the broader stone fruit category in terms of investment risk?

Cherries face higher climate sensitivity and shorter harvest windows than peaches or plums, concentrating revenue into 8–12 weeks annually. Frost insurance costs run 3–5× higher than other stone fruits, making orchard investment inherently riskier [6].

How do phytosanitary protocols affect fresh cherry export and import timelines between hemispheres?

Bilateral fumigation and cold-treatment requirements add 4–7 days to transit schedules, particularly for US-to-China and Chile-to-EU shipments. Harmonized electronic certification under IPPC ePhyto reduces administrative delays by roughly 30% [2].

Which sweet and sour cherry varieties offer the best shelf-life performance for long-distance shipping?

Lapins and Skeena lead in firmness retention over 30+ day ocean transits, outperforming Bing and Rainier cherry types. Tart varieties like Balaton maintain structural integrity better than Montmorency under extended cold storage [12].

How does the fresh cherries market accommodate blockchain-based traceability for premium retail buyers?

Grower-shippers assign QR-coded lot IDs at the pack line, linking harvest date, orchard GPS coordinates, and grading data to immutable ledger records. Retailers like Costco and Woolworths now require this for premium-tier placements [20].

What role do cherry antioxidant properties play in foodservice menu innovation?

Tart cherry concentrates appear in craft cocktails, functional smoothie bowls, and anti-inflammatory recovery menus at premium foodservice chains. The functional positioning commands 20–35% higher menu pricing versus standard fruit garnishes [14].

How are cooperative structures evolving in the fresh cherries market to address consolidation pressure?

Pacific Northwest cooperatives are merging marketing functions while retaining independent farming operations, achieving 10–15% procurement cost reductions.

What is the environmental footprint of air-freighted versus ocean-shipped cherry stone fruit harvesting output?

Air freight generates roughly 50× the CO₂ per kilogram compared to refrigerated ocean containers. Growers targeting net-zero commitments are shifting 60–70% of long-haul volume to controlled-atmosphere sea freight by 2028 [19][22].


FAQs

What is the current valuation of the Fresh Cherries Market as of 2024?

The Fresh Cherries Market was valued at 26.06 USD Billion in 2024.

What is the projected market valuation for the Fresh Cherries Market in 2035?

The market is projected to reach a valuation of 37.05 USD Billion by 2035.

What is the expected CAGR for the Fresh Cherries Market during the forecast period 2025 - 2035?

The expected CAGR for the Fresh Cherries Market during the forecast period 2025 - 2035 is 3.25%.

Which companies are considered key players in the Fresh Cherries Market?

Key players in the market include Stemilt Growers, Chilean Cherry Committee, Grimmway Farms, and others.

How does the Fresh Consumption segment perform in terms of market valuation?

The Fresh Consumption segment was valued at 10.0 USD Billion in 2024 and is expected to grow to 14.0 USD Billion by 2035.

What is the market valuation for the Processing segment of Fresh Cherries?

The Processing segment was valued at 8.0 USD Billion in 2024 and is projected to reach 11.0 USD Billion by 2035.

What are the projected values for the Online Retail distribution channel?

The Online Retail distribution channel was valued at 5.0 USD Billion in 2024 and is expected to grow to 8.0 USD Billion by 2035.

How do Sweet Cherries compare to Sour Cherries in market valuation?

Sweet Cherries were valued at 10.0 USD Billion in 2024, while Sour Cherries were valued at 5.0 USD Billion.

What is the expected growth for the Retail Packaging segment?

The Retail Packaging segment was valued at 10.0 USD Billion in 2024 and is projected to increase to 14.0 USD Billion by 2035.

What is the market valuation for the Food Service end-use segment?

The Food Service end-use segment was valued at 8.0 USD Billion in 2024 and is expected to reach 11.0 USD Billion by 2035.
Author
Author
Author Profile
Tejas Chaudhary
Research Analyst Level II
I have a degree in Engineering (Civil), with masters in Business Administration (Marketing). With more than 4 years of experience in market research and consulting, I am involved in end-to-end process of market research, proposals, project kickoffs and delivery. I have research knowledge and expertise in consumer goods/packaging domain. Also I have worked for various other domains like construction & equipment. Effectively managed and delivered more than 60 report studies for regional as well as global clientele.

Research Approach


Secondary Research

The secondary research process involved comprehensive analysis of agricultural databases, peer-reviewed horticultural journals, trade publications, and authoritative food and agriculture organizations. Key sources included the United States Department of Agriculture (USDA), Food and Agriculture Organization of the United Nations (FAO), International Society for Horticultural Science (ISHS), USDA National Agricultural Statistics Service (NASS), USDA Economic Research Service (ERS), European Commission Directorate-General for Agriculture and Rural Development (DG AGRI), Eurostat Agricultural Database, Organisation for Economic Co-operation and Development (OECD) Agricultural Outlook, International Trade Centre (ITC) Trade Map, World Trade Organization (WTO) Agricultural Trade Statistics, Centers for Disease Control and Prevention (CDC) Nutrition and Health Data, National Institutes of Health (NIH) Nutritional Studies, Cherry Marketing Institute (CMI), Northwest Horticultural Council (NHC), California Cherry Board, Chilean Fresh Fruit Exporters Association (ASOEX), Australian Bureau of Agricultural and Resource Economics and Sciences (ABARES), China Agricultural University Research Publications, and national agricultural ministry reports from key producing countries (Turkey, Iran, Spain, Italy, Argentina). These sources were used to collect production statistics, export/import trade data, cultivation area trends, phytosanitary regulations, nutritional research, consumption patterns, and competitive landscape analysis for sweet cherries, sour cherries, organic cherry varieties, and conventional cultivation methods.


Primary Research

In order to gather both qualitative and quantitative insights, supply-side and demand-side stakeholders were interviewed during the primary research process. CEOs, directors of agricultural operations, chiefs of export/import departments, and commercial managers from fresh fruit distributors, packing companies, cooperatives, and cherry farmers were examples of supply-side sources. Procurement managers from supermarket chains, specialty food stores, food service providers, industrial processors (beverage and confectionery makers), and suppliers of agricultural inputs (irrigation technologies, cold storage solutions, packaging providers) were examples of demand-side sources. In addition to gathering information on pricing volatility, cold chain logistics, varietal preferences, and organic certification trends, primary research verified harvest and export season dates and validated market segmentation.

Primary Respondent Breakdown:

By Designation: C-level Primaries (28%), Director Level (32%), Others (40%)

By Region: North America (32%), Europe (30%), Asia-Pacific (25%), Rest of World (13%)


Market Size Estimation

Global market valuation was derived through production volume mapping and trade flow analysis. The methodology included:

Identification of 60+ key growers and exporters across North America (Washington, California, Oregon), Europe (Spain, Italy, Turkey), Asia-Pacific (China, Australia, New Zealand), and Latin America (Chile, Argentina)

Product mapping across sweet cherries (Bing, Rainier, Lapins, Regina), sour cherries (Montmorency, Morello), organic certified varieties, and conventional segments

Analysis of reported and modeled annual revenues specific to fresh cherry operations, including export premiums and seasonal pricing differentials

Coverage of producers and exporters representing 75-80% of global commercial trade volume in 2024

Extrapolation using bottom-up (harvest volume × average export price by country/variety) and top-down (cooperative and export association revenue validation) approaches to derive segment-specific valuations across fresh consumption, processing applications, and industrial end-use categories

Download Free Sample

Kindly complete the form below to receive a free sample of this Report

Download PDF ×

We do not share your information with anyone. However, we may send you emails based on your report interest from time to time. You may contact us at any time to opt-out.