• Cat-intel
  • MedIntelliX
  • Resources
  • About Us
  • Hero Background
    English
    Chinese
    French
    Japanese
    Korean
    German
    Spanish

    Gallium Nitride Market Analysis

    ID: MRFR/CnM/4156-HCR
    200 Pages
    Chitranshi Jaiswal
    October 2025

    Gallium Nitride Market Research Report By Application (Power Devices, RF Devices, LEDs, Laser Diodes), By Type (GaN-on-Silicon, GaN-on-Sapphire, GaN-on-SiC), By End Use (Consumer Electronics, Telecommunications, Automotive, Aerospace), By Production Method (MOCVD, Hydride Vapor Phase Epitaxy, Liquid Phase Epitaxy) and By Regional (North America, Europe, South America, Asia Pacific, Middle East ...

    Share:
    Download PDF ×

    We do not share your information with anyone. However, we may send you emails based on your report interest from time to time. You may contact us at any time to opt-out.

    Gallium Nitride Market Infographic
    Purchase Options

    Market Analysis

    In-depth Analysis of Gallium Nitride Market Industry Landscape

    The market dynamics of the Gallium Nitride (GaN) market are shaped by a group of factors that governs or contributes to the ways of supply and demand a market. The wide-band semiconductor GaN has become a clear leader in the development of different applications, such as energy, as well in devices which need to be fast conducting low to high frequencies. The primary factor fostering a market growth is a way in that the demand for the electronic components distributed with high performance and final efficiency and power management ability is growing. One of The GaN's distinct advantages, the high electron transport and thermal stability permit GaN semiconductor to face directly with traditional semiconductor materials. a major contributor for market dynamic on the demand side is the growing ascent of the GaN in power electronics. Every day, the power electronics domain with applications for power supplies, inverters and converters is drawing on the ability of GaN devices to work at higher frequencies and temperatures upto required levels. It has been responsible for not only the increase in power efficiency but also the ability to carry more data, which is a main reason for the decision of GaN being a better choice both power industries as well as designs looking for energy efficiency and reduced power consumption.

    Beyond this, responsiveness of the telecommunications field to the growth of major market is also a factor that cause the GaN market dynamics to change. In the past few years, the need for high-speed and high-power devices has drastically increased for maintaining and launching wireless communication infrastructure in the 5G era. The use of gallium nitride (GaN) in high power applications is enabled by its ability to handle power at microwave frequency. This makes it a suitable choice for the material base station amplifiers and radar systems. With the progression of the telecommunications industry, in particular, there is a possibility that the GaN industry would keep on expanding and would remain a promising sector in the market.

    Supply-side behavioir just as significant is created by supply-side dynamics. Engineering developments in the process of manufacturing have promoted the improvement of production efficiency and reduction of cost, rendering GaN technology more affordable in the eyes of market place as whole. Moreover, the research and development labor act that concentrate on the enhancement of GaN material properties and emerging devices speeds up the neural network and market growth.

    Even though the market could be affected by insufficiency of raw materials and the fact that GaN fabrication processes is complex enough on the other hand, it is still a key growing element of the market. Besides, the global suppl y chain disruptions newly arising have made the price of GaN fluctuated and the delay in production. Indeed, when it comes to any advanced technology, achieving economies of scale and deal with manufacturing issue are important factors to maintain market growth for GaN.

    Author
    Chitranshi Jaiswal
    Research Analyst Level I

    In her 3 years of experience in the market research field, she has handled critical cross-domain projects. She has an in-depth knowledge of market estimation & analysis, problem-solving, primary as well as secondary research, and team management.She holds an engineering degree and is an MBA professional from a well-known university, capable of evaluating the market and competitive conditions. An exceptional strategist with excellent communication skills and a passion for delivering cutting-edge & practical insights for the market. Proficient in multi-tasking, and can successfully deal with competing demands, while maintaining complete confidentiality. Generated business through active client and project development, networking, and high-quality responses. Her knowledge and skills have helped in making solid business decisions, securing funding from investors, and avoiding business failures.

    Leave a Comment

    FAQs

    What is the market size of the Gallium Nitride Market in 2024?

    The Gallium Nitride Market is expected to be valued at 2.02 billion USD in 2024.

    What will be the projected market size of the Gallium Nitride Market by 2035?

    By 2035, the Gallium Nitride Market is expected to reach a valuation of 9.5 billion USD.

    What is the expected CAGR for the Gallium Nitride Market from 2025 to 2035?

    The Gallium Nitride Market is projected to grow at a CAGR of 15.11% during the period from 2025 to 2035.

    Which region will dominate the Gallium Nitride Market by 2035?

    By 2035, North America is expected to dominate the market, valued at approximately 3.13 billion USD.

    What is the market value of the Power Devices segment in 2024?

    The Power Devices segment of the Gallium Nitride Market is valued at 0.8 billion USD in 2024.

    How much will the RF Devices segment be worth by 2035?

    The RF Devices segment is projected to reach a value of 2.5 billion USD by 2035.

    What is the estimated market size for LEDs in the Gallium Nitride Market in 2024?

    In 2024, the market size for LEDs is estimated at 0.4 billion USD.

    Who are the key players in the Gallium Nitride Market?

    Key players in the Gallium Nitride Market include Cree, Navitas Semiconductor, and Mitsubishi Electric, among others.

    What is the projected value of the Laser Diodes segment by 2035?

    The Laser Diodes segment is expected to reach a valuation of 1.3 billion USD by 2035.

    What is the market growth rate for Asia Pacific in the Gallium Nitride Market by 2035?

    The Asia Pacific region is expected to grow significantly, reaching a market valuation of 3.49 billion USD by 2035.

    Market Summary

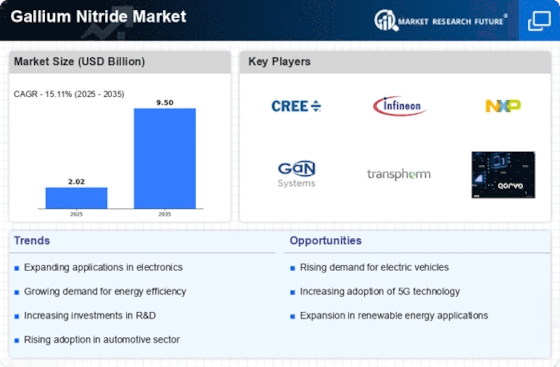
    As per MRFR analysis, the Gallium Nitride Market Size was estimated at 2.02 USD Billion in 2024. The Gallium Nitride industry is projected to grow from 2.325 USD Billion in 2025 to 9.497 USD Billion by 2035, exhibiting a compound annual growth rate (CAGR) of 15.11 during the forecast period 2025 - 2035.

    Key Market Trends & Highlights

    The Gallium Nitride market is poised for substantial growth driven by technological advancements and increasing demand across various sectors.

    • The North American region remains the largest market for Gallium Nitride, primarily due to its robust power electronics sector.
    • Asia-Pacific is emerging as the fastest-growing region, fueled by rapid advancements in telecommunications and manufacturing.
    • Power devices represent the largest segment, while RF devices are experiencing the fastest growth, reflecting diverse application needs.
    • Key market drivers include the increasing adoption of electric vehicles and the expansion of renewable energy sources, which are significantly influencing demand.

    Market Size & Forecast

    2024 Market Size 2.02 (USD Billion)
    2035 Market Size 9.497 (USD Billion)
    CAGR (2025 - 2035) 15.11%
    Largest Regional Market Share in 2024 North America

    Major Players

    <p>Cree Inc (US), Infineon Technologies AG (DE), NXP Semiconductors (NL), GaN Systems (CA), Transphorm Inc (US), Efficient Power Conversion Corporation (US), Qorvo Inc (US), United Silicon Carbide Inc (US)</p>

    Market Trends

    The Gallium Nitride Market is currently experiencing a transformative phase, driven by the increasing demand for high-performance electronic devices and energy-efficient solutions. This compound semiconductor material is gaining traction in various applications, including power electronics, RF devices, and optoelectronics. The shift towards renewable energy sources and electric vehicles is further propelling the need for advanced materials that can enhance efficiency and reduce energy consumption. As industries seek to innovate and improve performance, Gallium Nitride is emerging as a preferred choice due to its superior properties compared to traditional silicon-based materials. Moreover, the expansion of the telecommunications sector, particularly with the rollout of 5G technology, is likely to bolster the Gallium Nitride Market. The material's ability to operate at higher frequencies and temperatures makes it suitable for next-generation communication systems. Additionally, ongoing research and development efforts are expected to unlock new applications and improve manufacturing processes, potentially leading to cost reductions. As the market evolves, stakeholders must remain vigilant to emerging trends and technological advancements that could shape the future landscape of the Gallium Nitride Market.

    Rising Demand in Power Electronics

    The Gallium Nitride Market is witnessing a surge in demand for power electronics applications. This trend is largely attributed to the material's ability to handle higher voltages and temperatures, which enhances the efficiency of power conversion systems. As industries increasingly prioritize energy efficiency, Gallium Nitride devices are becoming essential in various sectors, including automotive and renewable energy.

    Advancements in Telecommunications

    The expansion of telecommunications infrastructure, particularly with the advent of 5G technology, is significantly influencing the Gallium Nitride Market. The material's superior performance in high-frequency applications positions it as a key component in next-generation communication devices. This trend suggests a growing reliance on Gallium Nitride for enhancing connectivity and data transmission.

    Innovations in Manufacturing Processes

    Ongoing innovations in the manufacturing processes of Gallium Nitride are likely to impact the market positively. Enhanced techniques may lead to improved yield rates and reduced production costs, making Gallium Nitride more accessible for various applications. This trend indicates a potential shift in market dynamics, as affordability could drive wider adoption across multiple industries.

    <p>The increasing demand for energy-efficient technologies and the rapid advancement of electric vehicles are driving a notable shift towards the adoption of Gallium Nitride in various applications, suggesting a transformative impact on the semiconductor landscape.</p>

    U.S. Department of Energy

    Gallium Nitride Market Market Drivers

    Expansion of Renewable Energy Sources

    The transition towards renewable energy sources is significantly influencing the Gallium Nitride Market. As countries aim to reduce carbon emissions, the integration of solar and wind energy systems is becoming more prevalent. Gallium nitride devices are essential in power management systems, enabling efficient energy conversion and storage. The market for renewable energy is expected to witness a CAGR of approximately 15% over the next decade, which may lead to increased investments in gallium nitride technologies. This expansion indicates a promising future for the Gallium Nitride Market, as it aligns with global sustainability goals and the need for efficient energy solutions.

    Increasing Adoption of Electric Vehicles

    The rising adoption of electric vehicles (EVs) is a pivotal driver for the Gallium Nitride Market. As automakers strive to enhance the efficiency and performance of EVs, the demand for advanced power electronics is surging. Gallium nitride, with its superior thermal conductivity and efficiency, is increasingly utilized in power converters and chargers. Reports indicate that the EV market is projected to grow at a compound annual growth rate (CAGR) of over 20% in the coming years, thereby propelling the demand for gallium nitride components. This trend suggests that the Gallium Nitride Market is likely to experience substantial growth as manufacturers seek to meet the evolving needs of the automotive sector.

    Rising Demand for High-Power Applications

    The increasing demand for high-power applications is a significant driver for the Gallium Nitride Market. Industries such as aerospace, defense, and industrial automation require power devices that can handle high voltages and currents efficiently. Gallium nitride's ability to operate at higher power levels with reduced energy losses makes it an ideal choice for these applications. The high-power electronics market is projected to grow at a CAGR of around 12% over the next several years, suggesting a robust demand for gallium nitride solutions. This trend highlights the potential for the Gallium Nitride Market to expand as it caters to the needs of high-performance applications.

    Growth in Telecommunications Infrastructure

    The ongoing expansion of telecommunications infrastructure is a crucial driver for the Gallium Nitride Market. With the rollout of 5G networks, there is a heightened demand for high-frequency components that can handle increased data transmission rates. Gallium nitride is favored for its ability to operate at higher frequencies and power levels, making it ideal for 5G base stations and other communication devices. The telecommunications sector is projected to grow at a CAGR of around 10% in the next few years, which could lead to a significant uptick in the adoption of gallium nitride technologies. This growth trajectory suggests that the Gallium Nitride Market will play a vital role in supporting the next generation of communication technologies.

    Technological Advancements in Semiconductor Manufacturing

    Technological advancements in semiconductor manufacturing processes are driving innovation within the Gallium Nitride Market. The development of new fabrication techniques has enabled the production of gallium nitride devices that are more efficient and cost-effective. As semiconductor manufacturers invest in research and development, the performance of gallium nitride components continues to improve, making them more attractive for various applications. The semiconductor market is anticipated to grow at a CAGR of approximately 8% in the coming years, which may further bolster the demand for gallium nitride technologies. This trend indicates that the Gallium Nitride Market is poised for growth as manufacturers seek to leverage these advancements.

    Market Segment Insights

    By Application: Power Devices (Largest) vs. RF Devices (Fastest-Growing)

    <p>In the Gallium Nitride market, the application segment showcases a diverse distribution of market share among Power Devices, RF Devices, LEDs, and Laser Diodes. Power Devices dominate the landscape, owing to their essential role in efficient energy conversion and management. They are widely utilized in electronic systems, contributing to their significant share. RF Devices, while having a smaller current share, are gaining traction and slowly increasing their footprint in the market, especially with the rise of 5G technologies.</p>

    <p>Power Devices (Dominant) vs. RF Devices (Emerging)</p>

    <p>Power Devices have established a dominant position within the Gallium Nitride market due to their pivotal role in high-performance applications, particularly in power management and conversion systems. Their efficiency and capability to handle high voltages make them ideal for various sectors, including automotive and renewable energy. On the other hand, RF Devices are emerging as a significant player, bolstered by the burgeoning demand for high-frequency applications and the advancement of telecommunications infrastructure. This segment is poised for rapid growth as the need for faster and more efficient wireless communication technologies, such as 5G and IoT, drives innovation and uptake.</p>

    By Type: GaN-on-Silicon (Largest) vs. GaN-on-Sapphire (Fastest-Growing)

    <p>In the Gallium Nitride market, GaN-on-Silicon holds the largest market share due to its widespread adoption in various applications, including power electronics and RF components. Its compatibility with existing silicon manufacturing processes significantly contributes to its dominance, making it a preferred choice among manufacturers. Conversely, GaN-on-Sapphire is emerging as a significant player, experiencing rapid growth driven by its application in high-frequency and optoelectronic devices. As markets evolve, these segment values reflect dynamic shifts in technology preferences. Analyzing growth trends in the Gallium Nitride market reveals that GaN-on-Silicon remains the industry backbone, supported by continuous technological advancements and economies of scale. Meanwhile, GaN-on-Sapphire showcases a promising upward trajectory, attributed to increasing demand for compact and efficient devices in telecommunications and consumer electronics. The shift toward more energy-efficient solutions is propelling both segment values, with GaN-on-SiC also gaining traction in specialized applications.</p>

    <p>GaN-on-Silicon (Dominant) vs. GaN-on-Sapphire (Emerging)</p>

    <p>GaN-on-Silicon serves as the dominant technology in the Gallium Nitride market, leveraging established silicon fabrication techniques to create cost-effective and high-performance devices. This segment's extensive utilization in power amplifiers and converters underscores its pivotal role in advancing electrical efficiency across applications. In contrast, GaN-on-Sapphire is emerging with unique offerings that cater to high-frequency applications, particularly in optoelectronics. This technology's capacity to enhance performance in smaller packages makes it increasingly attractive for applications requiring miniaturization, such as LEDs and RF components. Despite differences in their current market positions, both GaN-on-Silicon and GaN-on-Sapphire are set to shape the future of Gallium Nitride technology.</p>

    By End Use: Consumer Electronics (Largest) vs. Telecommunications (Fastest-Growing)

    <p>The Gallium Nitride market showcases a diverse range of end-use applications, with consumer electronics accounting for the largest share. This segment primarily includes devices such as smartphones, laptops, and other personal gadgets that benefit from GaN technology's high efficiency and power density. Following closely behind is the telecommunications sector, where GaN is increasingly being utilized for 5G infrastructure, enhancing signal strength and transmission efficiency. Both segments underscore the growing importance of GaN in modern technological advancements.</p>

    <p>Electronics: Consumer Electronics (Dominant) vs. Telecommunications (Emerging)</p>

    <p>The consumer electronics segment of the Gallium Nitride market is characterized by its robust demand for high-performance, compact devices. GaN technology facilitates faster charging and improved energy efficiency, enabling manufacturers to meet consumer expectations for both performance and sustainability. On the other hand, the telecommunications segment is emerging as a critical player, driven by the rapid rollout of 5G networks. GaN's ability to operate at high frequencies makes it ideal for next-generation communication technologies, positioning it as an essential component in base stations and other telecom infrastructure. This dynamic landscape indicates a strong future for both segments, with consumer electronics remaining dominant and telecommunications poised for significant growth.</p>

    By Production Method: MOCVD (Largest) vs. Hydride Vapor Phase Epitaxy (Fastest-Growing)

    <p>In the Gallium Nitride Market, the production methods segment is predominantly led by Metal-Organic Chemical Vapor Deposition (MOCVD), which holds a significant market share due to its established technology and high efficiency in producing high-quality GaN materials. Other production methods, while crucial, like Hydride Vapor Phase Epitaxy (HVPE) and Liquid Phase Epitaxy (LPE), account for relatively smaller shares but are gaining attention for their specific advantages in niche applications. The growth of the production methods segment is influenced by the increasing demand for energy-efficient electronic components and the growing adoption of GaN in power electronics and RF applications. HVPE, in particular, is emerging as a fast-growing method due to its potential for scaling up production and efficiency, positioning it as a key player for future market dynamics.</p>

    <p>MOCVD (Dominant) vs. HVPE (Emerging)</p>

    <p>The Metal-Organic Chemical Vapor Deposition (MOCVD) method dominates the Gallium Nitride production landscape due to its robust process that enables the fabrication of high-quality GaN layers suitable for various applications, from LEDs to power devices. Its ability to precisely control material quality and thickness makes it favored by many manufacturers. On the other hand, Hydride Vapor Phase Epitaxy (HVPE) is considered an emerging method, offering advantages such as faster deposition rates and larger crystal sizes, which are vital for high-performance applications. As the market continues to evolve, HVPE's scalability and efficiency may redefine the competitive dynamics, particularly in sectors demanding high volume and quality, such as power electronics.</p>

    Get more detailed insights about Gallium Nitride Market Research Report- Forecast to 2035

    Regional Insights

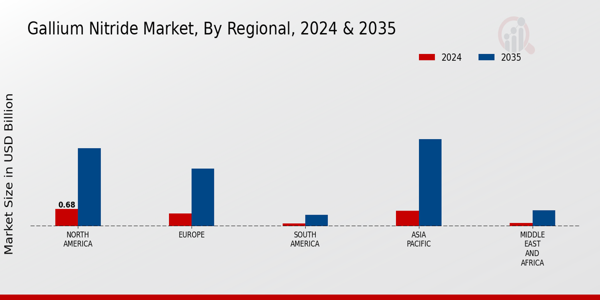
    The Gallium Nitride Market is projected to witness significant growth across various regional segments. In 2024, North America holds a majority share, with a valuation of 0.68 USD Billion, which is expected to rise to 3.13 USD Billion by 2035, driven by the increasing demand for advanced electronics and telecommunications. Europe follows, valued at 0.5 USD Billion in 2024 and forecasted to expand to 2.3 USD Billion by 2035, supported by growth in renewable energy applications.

    The Asia Pacific region is also gaining traction, with a market value of 0.62 USD Billion in 2024, projected at 3.49 USD Billion by 2035, thanks to rapid industrialization and technological advancements.South America and the Middle East and Africa exhibit smaller markets, valued at 0.1 USD Billion and 0.12 USD Billion, respectively, in 2024, but show growth potential, with estimates of 0.45 USD Billion and 0.63 USD Billion by 2035. The dynamics of regional growth in the Gallium Nitride Market are influenced by emerging technologies, increasing investment in Research and Development, and a growing focus on energy-efficient solutions.

    These segments showcase the importance of regional strategies in capturing market opportunities and addressing local demand efficiently. 

    Gallium Nitride Market Regional Insights

    Source: Primary Research, Secondary Research, Market Research Future Database and Analyst Review 

    Key Players and Competitive Insights

    The Gallium Nitride Market has witnessed noteworthy advancements and competition as it finds extensive applications across various industries, including consumer electronics, telecommunications, and renewable energy. The increasing demand for high-performance and efficient power devices drives the market. Key players are continuously engaging in research and development to enhance their product offerings, leading to significant growth and innovation in gallium nitride technology. The competitive landscape comprises both established companies that have a long-standing presence in the semiconductor industry as well as emerging startups that bring fresh approaches to technology and market strategies.

    Companies are focusing on capitalizing on the growing trend towards miniaturization and performance efficiency, which are paramount in applications such as electric vehicles and advanced wireless infrastructures.Cree stands out as a formidable competitor within the Gallium Nitride Market due to its extensive experience and strong portfolio in power and radio-frequency (RF) products. The company has established a solid reputation for its innovative solutions, which are pivotal in various applications that require efficient energy management. Cree leverages its technological expertise to manufacture high-quality gallium nitride devices, gaining significant traction and market share in the power electronics sector.

    Furthermore, Cree’s commitment to sustainability and energy efficiency aligns well with current market trends, enhancing its competitive position. The company's robust research initiatives allow it to continually advance its product lineup, addressing the fast-evolving needs of customers globally. As a result, Cree has secured a prominent place in the market, supported by its brand equity and reliable performance metrics.Navitas Semiconductor operates effectively within the Gallium Nitride Market, specializing in power electronics solutions aimed at simplifying the design and enhancing the efficiency of power systems.

    The company’s key products include its innovative GaNFast power ICs, designed to optimize performance in applications such as mobile chargers, data centers, and solar inverters. Navitas has effectively introduced these products to the market, highlighting their high efficiency and reduced size compared to traditional silicon technologies. The company has engaged in strategic partnerships and collaborations aimed at boosting its market presence and technological capabilities. Recent mergers and acquisitions undertaken by Navitas Semiconductor have allowed it to expand its reach and reinforce its competitive edge, positioning the company for strong growth within the GaN market.

    With a sustained focus on innovation and customer-centric solutions, Navitas Semiconductor continues to capitalize on emerging opportunities in various sectors, driving its presence forward on the stage.

    Key Companies in the Gallium Nitride Market market include

    Industry Developments

    Recent developments in the Gallium Nitride Market have seen significant growth due to increasing demand for energy-efficient technologies and advancements in semiconductor applications. In September 2023, Cree announced the expansion of its SiC semiconductor manufacturing capabilities, focusing on increasing production capacity to meet rising market needs. Meanwhile, Navitas Semiconductor has launched new product lines that incorporate Gallium Nitride technology, designed for fast charging solutions in consumer electronics, contributing to market traction. Current affairs also highlight Mitsubishi Electric enhancing its GaN power device portfolio to improve electric vehicle performance.

    Notably, merger and acquisition activities have remained active, with ROHM Semiconductor acquiring a subsidiary in 2023 to bolster its power semiconductor division. There has been an observable growth trend in market valuations, driven by substantial investments in Research and Development across companies like Texas Instruments and Infineon Technologies, reflecting a collective push towards innovation in power management solutions. The market has evolved rapidly over the last few years, particularly with significant advancements in GaN technology by STMicroelectronics and Qorvo, further solidifying the competitiveness of the Gallium Nitride sector.

    Future Outlook

    Gallium Nitride Market Future Outlook

    <p>The Gallium Nitride Market is projected to grow at a 15.11% CAGR from 2024 to 2035, driven by advancements in power electronics, telecommunications, and renewable energy applications.</p>

    New opportunities lie in:

    • <p>Development of high-efficiency power converters for renewable energy systems.</p>
    • <p>Expansion into automotive applications for electric vehicle charging infrastructure.</p>
    • <p>Creation of advanced RF components for 5G and beyond telecommunications.</p>

    <p>By 2035, the Gallium Nitride Market is expected to achieve substantial growth, solidifying its role in various high-tech industries.</p>

    Market Segmentation

    Gallium Nitride Market Type Outlook

    • GaN-on-Silicon
    • GaN-on-Sapphire
    • GaN-on-SiC

    Gallium Nitride Market End Use Outlook

    • Consumer Electronics
    • Telecommunications
    • Automotive
    • Aerospace

    Gallium Nitride Market Application Outlook

    • Power Devices
    • RF Devices
    • LEDs
    • Laser Diodes

    Gallium Nitride Market Production Method Outlook

    • MOCVD
    • Hydride Vapor Phase Epitaxy
    • Liquid Phase Epitaxy

    Report Scope

    MARKET SIZE 20242.02(USD Billion)
    MARKET SIZE 20252.325(USD Billion)
    MARKET SIZE 20359.497(USD Billion)
    COMPOUND ANNUAL GROWTH RATE (CAGR)15.11% (2024 - 2035)
    REPORT COVERAGERevenue Forecast, Competitive Landscape, Growth Factors, and Trends
    BASE YEAR2024
    Market Forecast Period2025 - 2035
    Historical Data2019 - 2024
    Market Forecast UnitsUSD Billion
    Key Companies ProfiledMarket analysis in progress
    Segments CoveredMarket segmentation analysis in progress
    Key Market OpportunitiesGrowing demand for energy-efficient devices drives innovation in the Gallium Nitride Market.
    Key Market DynamicsRising demand for efficient power electronics drives innovation and competition in the Gallium Nitride market.
    Countries CoveredNorth America, Europe, APAC, South America, MEA

    Market Highlights

    Author

    Chitranshi Jaiswal
    Research Analyst Level I

    She holds an experience of about 6+ years in market research and business consulting, working under the spectrum of information communication technology, telecommunications and semiconductor domains. aarti conceptualizes and implements a scalable business strategy and provides strategic leadership to the clients. her expertise lies in market estimation, competitive intelligence, pipeline analysis, customer assessment, etc.

    Leave a Comment

    Latest Comments

    John Doe
    john@example.com

    This is a great article! Really helped me understand the topic better.

    Posted on July 23, 2025, 10:15 AM
    Jane Smith
    jane@domain.com

    Thanks for sharing this. I’ve bookmarked it for later reference.

    Posted on July 22, 2025, 7:45 PM

    FAQs

    What is the market size of the Gallium Nitride Market in 2024?

    The Gallium Nitride Market is expected to be valued at 2.02 billion USD in 2024.

    What will be the projected market size of the Gallium Nitride Market by 2035?

    By 2035, the Gallium Nitride Market is expected to reach a valuation of 9.5 billion USD.

    What is the expected CAGR for the Gallium Nitride Market from 2025 to 2035?

    The Gallium Nitride Market is projected to grow at a CAGR of 15.11% during the period from 2025 to 2035.

    Which region will dominate the Gallium Nitride Market by 2035?

    By 2035, North America is expected to dominate the market, valued at approximately 3.13 billion USD.

    What is the market value of the Power Devices segment in 2024?

    The Power Devices segment of the Gallium Nitride Market is valued at 0.8 billion USD in 2024.

    How much will the RF Devices segment be worth by 2035?

    The RF Devices segment is projected to reach a value of 2.5 billion USD by 2035.

    What is the estimated market size for LEDs in the Gallium Nitride Market in 2024?

    In 2024, the market size for LEDs is estimated at 0.4 billion USD.

    Who are the key players in the Gallium Nitride Market?

    Key players in the Gallium Nitride Market include Cree, Navitas Semiconductor, and Mitsubishi Electric, among others.

    What is the projected value of the Laser Diodes segment by 2035?

    The Laser Diodes segment is expected to reach a valuation of 1.3 billion USD by 2035.

    What is the market growth rate for Asia Pacific in the Gallium Nitride Market by 2035?

    The Asia Pacific region is expected to grow significantly, reaching a market valuation of 3.49 billion USD by 2035.

    1. EXECUTIVE SUMMARY
      1. \r\n
      2. Market Overview
      3. \r\n
      4. Key Findings
      5. \r\n
      6. Market Segmentation
      7. \r\n
      8. Competitive Landscape
      9. \r\n
      10. Challenges and Opportunities
      11. \r\n
      12. Future Outlook
      13. \r\n
      14. \r\n
      15. \r\n
      16. \r\n
    2. MARKET INTRODUCTION
      1. \r\n
      2. Definition
      3. \r\n
      4. Scope of the study
        1. Research Objective
        2. Assumption
        3. Limitations
      5. \r\n
      6. \r\n
      7. \r\n
      8. \r\n
    3. RESEARCH METHODOLOGY
      1. \r\n
      2. Overview
      3. \r\n
      4. Data Mining
      5. \r\n
      6. Secondary Research
      7. \r\n
      8. Primary Research
        1. Primary Interviews and Information Gathering Process
        2. Breakdown of Primary Respondents
      9. \r\n
      10. \r\n
      11. \r\n
      12. Forecasting Model
      13. \r\n
      14. Market Size Estimation
        1. Bottom-Up Approach
        2. Top-Down Approach
      15. \r\n
      16. \r\n
      17. \r\n
      18. Data Triangulation
      19. \r\n
      20. Validation
      21. \r\n
      22. \r\n
      23. \r\n
      24. \r\n
    4. MARKET DYNAMICS
      1. \r\n
      2. Overview
      3. \r\n
      4. Drivers
      5. \r\n
      6. Restraints
      7. \r\n
      8. Opportunities
      9. \r\n
    5. MARKET FACTOR ANALYSIS
      1. \r\n
      2. Value chain Analysis
      3. \r\n
      4. Porter's Five Forces Analysis
        1. Bargaining Power of Suppliers
        2. Bargaining Power of Buyers
        3. Threat of New Entrants
        4. Threat of Substitutes
        5. Intensity of Rivalry
      5. \r\n
      6. \r\n
      7. \r\n
      8. \r\n
      9. \r\n
      10. \r\n
      11. COVID-19 Impact Analysis
        1. Market Impact Analysis
        2. Regional Impact
        3. Opportunity and Threat Analysis
      12. \r\n
      13. \r\n
      14. \r\n
      15. \r\n
      16. \r\n
      17. \r\n
      18. \r\n
    6. GALLIUM NITRIDE MARKET, BY APPLICATION (USD BILLION)
      1. \r\n
      2. Power Devices
      3. \r\n
      4. RF Devices
      5. \r\n
      6. LEDs
      7. \r\n
      8. Laser Diodes
      9. \r\n
    7. GALLIUM NITRIDE MARKET, BY TYPE (USD BILLION)
      1. \r\n
      2. GaN-on-Silicon
      3. \r\n
      4. GaN-on-Sapphire
      5. \r\n
      6. GaN-on-SiC
      7. \r\n
    8. GALLIUM NITRIDE MARKET, BY END USE (USD BILLION)
      1. \r\n
      2. Consumer Electronics
      3. \r\n
      4. Telecommunications
      5. \r\n
      6. Automotive
      7. \r\n
      8. Aerospace
      9. \r\n
    9. GALLIUM NITRIDE MARKET, BY PRODUCTION METHOD (USD BILLION)
      1. \r\n
      2. MOCVD
      3. \r\n
      4. Hydride Vapor Phase Epitaxy
      5. \r\n
      6. Liquid Phase Epitaxy
      7. \r\n
    10. GALLIUM NITRIDE MARKET, BY REGIONAL (USD BILLION)
      1. \r\n
      2. North America
        1. US
        2. Canada
      3. \r\n
      4. \r\n
      5. \r\n
      6. Europe
        1. Germany
        2. UK
        3. France
        4. Russia
        5. Italy
        6. Spain
        7. Rest of Europe
      7. \r\n
      8. \r\n
      9. \r\n
      10. \r\n
      11. \r\n
      12. \r\n
      13. \r\n
      14. \r\n
      15. APAC
        1. China
        2. India
        3. Japan
        4. South Korea
        5. Malaysia
        6. Thailand
        7. Indonesia
        8. Rest of APAC
      16. \r\n
      17. \r\n
      18. \r\n
      19. \r\n
      20. \r\n
      21. \r\n
      22. \r\n
      23. \r\n
      24. \r\n
      25. South America
        1. Brazil
        2. Mexico
        3. Argentina
        4. Rest of South America
      26. \r\n
      27. \r\n
      28. \r\n
      29. \r\n
      30. \r\n
      31. MEA
        1. GCC Countries
        2. South Africa
        3. Rest of MEA
      32. \r\n
      33. \r\n
      34. \r\n
      35. \r\n
      36. \r\n
      37. \r\n
      38. \r\n
    11. COMPETITIVE LANDSCAPE
      1. \r\n
      2. Overview
      3. \r\n
      4. Competitive Analysis
      5. \r\n
      6. Market share Analysis
      7. \r\n
      8. Major Growth Strategy in the Gallium Nitride Market
      9. \r\n
      10. Competitive Benchmarking
      11. \r\n
      12. Leading Players in Terms of Number of Developments in the Gallium Nitride Market
      13. \r\n
      14. Key developments and growth strategies
        1. New Product Launch/Service Deployment
        2. Merger & Acquisitions
        3. Joint Ventures
      15. \r\n
      16. \r\n
      17. \r\n
      18. \r\n
      19. Major Players Financial Matrix
        1. Sales and Operating Income
        2. Major Players R&D Expenditure. 2023
      20. \r\n
      21. \r\n
      22. \r\n
    12. COMPANY PROFILES
      1. \r\n
      2. Cree
        1. Financial Overview
        2. Products Offered
        3. Key Developments
        4. SWOT Analysis
        5. Key Strategies
      3. \r\n
      4. \r\n
      5. \r\n
      6. \r\n
      7. \r\n
      8. \r\n
      9. Navitas Semiconductor
        1. Financial Overview
        2. Products Offered
        3. Key Developments
        4. SWOT Analysis
        5. Key Strategies
      10. \r\n
      11. \r\n
      12. \r\n
      13. \r\n
      14. \r\n
      15. \r\n
      16. Mitsubishi Electric
        1. Financial Overview
        2. Products Offered
        3. Key Developments
        4. SWOT Analysis
        5. Key Strategies
      17. \r\n
      18. \r\n
      19. \r\n
      20. \r\n
      21. \r\n
      22. \r\n
      23. ROHM Semiconductor
        1. Financial Overview
        2. Products Offered
        3. Key Developments
        4. SWOT Analysis
        5. Key Strategies
      24. \r\n
      25. \r\n
      26. \r\n
      27. \r\n
      28. \r\n
      29. \r\n
      30. NXP Semiconductors
        1. Financial Overview
        2. Products Offered
        3. Key Developments
        4. SWOT Analysis
        5. Key Strategies
      31. \r\n
      32. \r\n
      33. \r\n
      34. \r\n
      35. \r\n
      36. \r\n
      37. Sanken Electric
        1. Financial Overview
        2. Products Offered
        3. Key Developments
        4. SWOT Analysis
        5. Key Strategies
      38. \r\n
      39. \r\n
      40. \r\n
      41. \r\n
      42. \r\n
      43. \r\n
      44. Kawasaki Heavy Industries
        1. Financial Overview
        2. Products Offered
        3. Key Developments
        4. SWOT Analysis
        5. Key Strategies
      45. \r\n
      46. \r\n
      47. \r\n
      48. \r\n
      49. \r\n
      50. \r\n
      51. Epistar Corporation
        1. Financial Overview
        2. Products Offered
        3. Key Developments
        4. SWOT Analysis
        5. Key Strategies
      52. \r\n
      53. \r\n
      54. \r\n
      55. \r\n
      56. \r\n
      57. \r\n
      58. Texas Instruments
        1. Financial Overview
        2. Products Offered
        3. Key Developments
        4. SWOT Analysis
        5. Key Strategies
      59. \r\n
      60. \r\n
      61. \r\n
      62. \r\n
      63. \r\n
      64. \r\n
      65. Siemens
        1. Financial Overview
        2. Products Offered
        3. Key Developments
        4. SWOT Analysis
        5. Key Strategies
      66. \r\n
      67. \r\n
      68. \r\n
      69. \r\n
      70. \r\n
      71. \r\n
      72. Power Integrations
        1. Financial Overview
        2. Products Offered
        3. Key Developments
        4. SWOT Analysis
        5. Key Strategies
      73. \r\n
      74. \r\n
      75. \r\n
      76. \r\n
      77. \r\n
      78. \r\n
      79. STMicroelectronics
        1. Financial Overview
        2. Products Offered
        3. Key Developments
        4. SWOT Analysis
        5. Key Strategies
      80. \r\n
      81. \r\n
      82. \r\n
      83. \r\n
      84. \r\n
      85. \r\n
      86. Qorvo
        1. Financial Overview
        2. Products Offered
        3. Key Developments
        4. SWOT Analysis
        5. Key Strategies
      87. \r\n
      88. \r\n
      89. \r\n
      90. \r\n
      91. \r\n
      92. \r\n
      93. ON Semiconductor
        1. Financial Overview
        2. Products Offered
        3. Key Developments
        4. SWOT Analysis
        5. Key Strategies
      94. \r\n
      95. \r\n
      96. \r\n
      97. \r\n
      98. \r\n
      99. \r\n
      100. Infineon Technologies
        1. Financial Overview
        2. Products Offered
        3. Key Developments
        4. SWOT Analysis
        5. Key Strategies
      101. \r\n
      102. \r\n
      103. \r\n
      104. \r\n
      105. \r\n
      106. \r\n
    13. APPENDIX
      1. \r\n
      2. References
      3. \r\n
      4. Related Reports
      5. \r\n
    14. LIST OF TABLES
      1. \r\n
      2. \r\n
    15. LIST OF ASSUMPTIONS
      1. \r\n
    16. NORTH AMERICA GALLIUM NITRIDE MARKET SIZE ESTIMATES & FORECAST, BY APPLICATION, 2019-2035 (USD BILLIONS)
      1. \r\n
    17. NORTH AMERICA GALLIUM NITRIDE MARKET SIZE ESTIMATES & FORECAST, BY TYPE, 2019-2035 (USD BILLIONS)
      1. \r\n
    18. NORTH AMERICA GALLIUM NITRIDE MARKET SIZE ESTIMATES & FORECAST, BY END USE, 2019-2035 (USD BILLIONS)
      1. \r\n
    19. NORTH AMERICA GALLIUM NITRIDE MARKET SIZE ESTIMATES & FORECAST, BY PRODUCTION METHOD, 2019-2035 (USD BILLIONS)
      1. \r\n
    20. NORTH AMERICA GALLIUM NITRIDE MARKET SIZE ESTIMATES & FORECAST, BY REGIONAL, 2019-2035 (USD BILLIONS)
      1. \r\n
    21. US GALLIUM NITRIDE MARKET SIZE ESTIMATES & FORECAST, BY APPLICATION, 2019-2035 (USD BILLIONS)
      1. \r\n
    22. US GALLIUM NITRIDE MARKET SIZE ESTIMATES & FORECAST, BY TYPE, 2019-2035 (USD BILLIONS)
      1. \r\n
    23. US GALLIUM NITRIDE MARKET SIZE ESTIMATES & FORECAST, BY END USE, 2019-2035 (USD BILLIONS)
      1. \r\n
    24. US GALLIUM NITRIDE MARKET SIZE ESTIMATES & FORECAST, BY PRODUCTION METHOD, 2019-2035 (USD BILLIONS)
      1. \r\n
    25. US GALLIUM NITRIDE MARKET SIZE ESTIMATES & FORECAST, BY REGIONAL, 2019-2035 (USD BILLIONS)
      1. \r\n
    26. CANADA GALLIUM NITRIDE MARKET SIZE ESTIMATES & FORECAST, BY APPLICATION, 2019-2035 (USD BILLIONS)
      1. \r\n
    27. CANADA GALLIUM NITRIDE MARKET SIZE ESTIMATES & FORECAST, BY TYPE, 2019-2035 (USD BILLIONS)
      1. \r\n
    28. CANADA GALLIUM NITRIDE MARKET SIZE ESTIMATES & FORECAST, BY END USE, 2019-2035 (USD BILLIONS)
      1. \r\n
    29. CANADA GALLIUM NITRIDE MARKET SIZE ESTIMATES & FORECAST, BY PRODUCTION METHOD, 2019-2035 (USD BILLIONS)
      1. \r\n
    30. CANADA GALLIUM NITRIDE MARKET SIZE ESTIMATES & FORECAST, BY REGIONAL, 2019-2035 (USD BILLIONS)
      1. \r\n
    31. EUROPE GALLIUM NITRIDE MARKET SIZE ESTIMATES & FORECAST, BY APPLICATION, 2019-2035 (USD BILLIONS)
      1. \r\n
    32. EUROPE GALLIUM NITRIDE MARKET SIZE ESTIMATES & FORECAST, BY TYPE, 2019-2035 (USD BILLIONS)
      1. \r\n
    33. EUROPE GALLIUM NITRIDE MARKET SIZE ESTIMATES & FORECAST, BY END USE, 2019-2035 (USD BILLIONS)
      1. \r\n
    34. EUROPE GALLIUM NITRIDE MARKET SIZE ESTIMATES & FORECAST, BY PRODUCTION METHOD, 2019-2035 (USD BILLIONS)
      1. \r\n
    35. EUROPE GALLIUM NITRIDE MARKET SIZE ESTIMATES & FORECAST, BY REGIONAL, 2019-2035 (USD BILLIONS)
      1. \r\n
    36. GERMANY GALLIUM NITRIDE MARKET SIZE ESTIMATES & FORECAST, BY APPLICATION, 2019-2035 (USD BILLIONS)
      1. \r\n
    37. GERMANY GALLIUM NITRIDE MARKET SIZE ESTIMATES & FORECAST, BY TYPE, 2019-2035 (USD BILLIONS)
      1. \r\n
    38. GERMANY GALLIUM NITRIDE MARKET SIZE ESTIMATES & FORECAST, BY END USE, 2019-2035 (USD BILLIONS)
      1. \r\n
    39. GERMANY GALLIUM NITRIDE MARKET SIZE ESTIMATES & FORECAST, BY PRODUCTION METHOD, 2019-2035 (USD BILLIONS)
      1. \r\n
    40. GERMANY GALLIUM NITRIDE MARKET SIZE ESTIMATES & FORECAST, BY REGIONAL, 2019-2035 (USD BILLIONS)
      1. \r\n
    41. UK GALLIUM NITRIDE MARKET SIZE ESTIMATES & FORECAST, BY APPLICATION, 2019-2035 (USD BILLIONS)
      1. \r\n
    42. UK GALLIUM NITRIDE MARKET SIZE ESTIMATES & FORECAST, BY TYPE, 2019-2035 (USD BILLIONS)
      1. \r\n
    43. UK GALLIUM NITRIDE MARKET SIZE ESTIMATES & FORECAST, BY END USE, 2019-2035 (USD BILLIONS)
      1. \r\n
    44. UK GALLIUM NITRIDE MARKET SIZE ESTIMATES & FORECAST, BY PRODUCTION METHOD, 2019-2035 (USD BILLIONS)
      1. \r\n
    45. UK GALLIUM NITRIDE MARKET SIZE ESTIMATES & FORECAST, BY REGIONAL, 2019-2035 (USD BILLIONS)
      1. \r\n
    46. FRANCE GALLIUM NITRIDE MARKET SIZE ESTIMATES & FORECAST, BY APPLICATION, 2019-2035 (USD BILLIONS)
      1. \r\n
    47. FRANCE GALLIUM NITRIDE MARKET SIZE ESTIMATES & FORECAST, BY TYPE, 2019-2035 (USD BILLIONS)
      1. \r\n
    48. FRANCE GALLIUM NITRIDE MARKET SIZE ESTIMATES & FORECAST, BY END USE, 2019-2035 (USD BILLIONS)
      1. \r\n
    49. FRANCE GALLIUM NITRIDE MARKET SIZE ESTIMATES & FORECAST, BY PRODUCTION METHOD, 2019-2035 (USD BILLIONS)
      1. \r\n
    50. FRANCE GALLIUM NITRIDE MARKET SIZE ESTIMATES & FORECAST, BY REGIONAL, 2019-2035 (USD BILLIONS)
      1. \r\n
    51. RUSSIA GALLIUM NITRIDE MARKET SIZE ESTIMATES & FORECAST, BY APPLICATION, 2019-2035 (USD BILLIONS)
      1. \r\n
    52. RUSSIA GALLIUM NITRIDE MARKET SIZE ESTIMATES & FORECAST, BY TYPE, 2019-2035 (USD BILLIONS)
      1. \r\n
    53. RUSSIA GALLIUM NITRIDE MARKET SIZE ESTIMATES & FORECAST, BY END USE, 2019-2035 (USD BILLIONS)
      1. \r\n
    54. RUSSIA GALLIUM NITRIDE MARKET SIZE ESTIMATES & FORECAST, BY PRODUCTION METHOD, 2019-2035 (USD BILLIONS)
      1. \r\n
    55. RUSSIA GALLIUM NITRIDE MARKET SIZE ESTIMATES & FORECAST, BY REGIONAL, 2019-2035 (USD BILLIONS)
      1. \r\n
    56. ITALY GALLIUM NITRIDE MARKET SIZE ESTIMATES & FORECAST, BY APPLICATION, 2019-2035 (USD BILLIONS)
      1. \r\n
    57. ITALY GALLIUM NITRIDE MARKET SIZE ESTIMATES & FORECAST, BY TYPE, 2019-2035 (USD BILLIONS)
      1. \r\n
    58. ITALY GALLIUM NITRIDE MARKET SIZE ESTIMATES & FORECAST, BY END USE, 2019-2035 (USD BILLIONS)
      1. \r\n
    59. ITALY GALLIUM NITRIDE MARKET SIZE ESTIMATES & FORECAST, BY PRODUCTION METHOD, 2019-2035 (USD BILLIONS)
      1. \r\n
    60. ITALY GALLIUM NITRIDE MARKET SIZE ESTIMATES & FORECAST, BY REGIONAL, 2019-2035 (USD BILLIONS)
      1. \r\n
    61. SPAIN GALLIUM NITRIDE MARKET SIZE ESTIMATES & FORECAST, BY APPLICATION, 2019-2035 (USD BILLIONS)
      1. \r\n
    62. SPAIN GALLIUM NITRIDE MARKET SIZE ESTIMATES & FORECAST, BY TYPE, 2019-2035 (USD BILLIONS)
      1. \r\n
    63. SPAIN GALLIUM NITRIDE MARKET SIZE ESTIMATES & FORECAST, BY END USE, 2019-2035 (USD BILLIONS)
      1. \r\n
    64. SPAIN GALLIUM NITRIDE MARKET SIZE ESTIMATES & FORECAST, BY PRODUCTION METHOD, 2019-2035 (USD BILLIONS)
      1. \r\n
    65. SPAIN GALLIUM NITRIDE MARKET SIZE ESTIMATES & FORECAST, BY REGIONAL, 2019-2035 (USD BILLIONS)
      1. \r\n
    66. REST OF EUROPE GALLIUM NITRIDE MARKET SIZE ESTIMATES & FORECAST, BY APPLICATION, 2019-2035 (USD BILLIONS)
      1. \r\n
    67. REST OF EUROPE GALLIUM NITRIDE MARKET SIZE ESTIMATES & FORECAST, BY TYPE, 2019-2035 (USD BILLIONS)
      1. \r\n
    68. REST OF EUROPE GALLIUM NITRIDE MARKET SIZE ESTIMATES & FORECAST, BY END USE, 2019-2035 (USD BILLIONS)
      1. \r\n
    69. REST OF EUROPE GALLIUM NITRIDE MARKET SIZE ESTIMATES & FORECAST, BY PRODUCTION METHOD, 2019-2035 (USD BILLIONS)
      1. \r\n
    70. REST OF EUROPE GALLIUM NITRIDE MARKET SIZE ESTIMATES & FORECAST, BY REGIONAL, 2019-2035 (USD BILLIONS)
      1. \r\n
    71. APAC GALLIUM NITRIDE MARKET SIZE ESTIMATES & FORECAST, BY APPLICATION, 2019-2035 (USD BILLIONS)
      1. \r\n
    72. APAC GALLIUM NITRIDE MARKET SIZE ESTIMATES & FORECAST, BY TYPE, 2019-2035 (USD BILLIONS)
      1. \r\n
    73. APAC GALLIUM NITRIDE MARKET SIZE ESTIMATES & FORECAST, BY END USE, 2019-2035 (USD BILLIONS)
      1. \r\n
    74. APAC GALLIUM NITRIDE MARKET SIZE ESTIMATES & FORECAST, BY PRODUCTION METHOD, 2019-2035 (USD BILLIONS)
      1. \r\n
    75. APAC GALLIUM NITRIDE MARKET SIZE ESTIMATES & FORECAST, BY REGIONAL, 2019-2035 (USD BILLIONS)
      1. \r\n
    76. CHINA GALLIUM NITRIDE MARKET SIZE ESTIMATES & FORECAST, BY APPLICATION, 2019-2035 (USD BILLIONS)
      1. \r\n
    77. CHINA GALLIUM NITRIDE MARKET SIZE ESTIMATES & FORECAST, BY TYPE, 2019-2035 (USD BILLIONS)
      1. \r\n
    78. CHINA GALLIUM NITRIDE MARKET SIZE ESTIMATES & FORECAST, BY END USE, 2019-2035 (USD BILLIONS)
      1. \r\n
    79. CHINA GALLIUM NITRIDE MARKET SIZE ESTIMATES & FORECAST, BY PRODUCTION METHOD, 2019-2035 (USD BILLIONS)
      1. \r\n
    80. CHINA GALLIUM NITRIDE MARKET SIZE ESTIMATES & FORECAST, BY REGIONAL, 2019-2035 (USD BILLIONS)
      1. \r\n
    81. INDIA GALLIUM NITRIDE MARKET SIZE ESTIMATES & FORECAST, BY APPLICATION, 2019-2035 (USD BILLIONS)
      1. \r\n
    82. INDIA GALLIUM NITRIDE MARKET SIZE ESTIMATES & FORECAST, BY TYPE, 2019-2035 (USD BILLIONS)
      1. \r\n
    83. INDIA GALLIUM NITRIDE MARKET SIZE ESTIMATES & FORECAST, BY END USE, 2019-2035 (USD BILLIONS)
      1. \r\n
    84. INDIA GALLIUM NITRIDE MARKET SIZE ESTIMATES & FORECAST, BY PRODUCTION METHOD, 2019-2035 (USD BILLIONS)
      1. \r\n
    85. INDIA GALLIUM NITRIDE MARKET SIZE ESTIMATES & FORECAST, BY REGIONAL, 2019-2035 (USD BILLIONS)
      1. \r\n
    86. JAPAN GALLIUM NITRIDE MARKET SIZE ESTIMATES & FORECAST, BY APPLICATION, 2019-2035 (USD BILLIONS)
      1. \r\n
    87. JAPAN GALLIUM NITRIDE MARKET SIZE ESTIMATES & FORECAST, BY TYPE, 2019-2035 (USD BILLIONS)
      1. \r\n
    88. JAPAN GALLIUM NITRIDE MARKET SIZE ESTIMATES & FORECAST, BY END USE, 2019-2035 (USD BILLIONS)
      1. \r\n
    89. JAPAN GALLIUM NITRIDE MARKET SIZE ESTIMATES & FORECAST, BY PRODUCTION METHOD, 2019-2035 (USD BILLIONS)
      1. \r\n
    90. JAPAN GALLIUM NITRIDE MARKET SIZE ESTIMATES & FORECAST, BY REGIONAL, 2019-2035 (USD BILLIONS)
      1. \r\n
    91. SOUTH KOREA GALLIUM NITRIDE MARKET SIZE ESTIMATES & FORECAST, BY APPLICATION, 2019-2035 (USD BILLIONS)
      1. \r\n
    92. SOUTH KOREA GALLIUM NITRIDE MARKET SIZE ESTIMATES & FORECAST, BY TYPE, 2019-2035 (USD BILLIONS)
      1. \r\n
    93. SOUTH KOREA GALLIUM NITRIDE MARKET SIZE ESTIMATES & FORECAST, BY END USE, 2019-2035 (USD BILLIONS)
      1. \r\n
    94. SOUTH KOREA GALLIUM NITRIDE MARKET SIZE ESTIMATES & FORECAST, BY PRODUCTION METHOD, 2019-2035 (USD BILLIONS)
      1. \r\n
    95. SOUTH KOREA GALLIUM NITRIDE MARKET SIZE ESTIMATES & FORECAST, BY REGIONAL, 2019-2035 (USD BILLIONS)
      1. \r\n
    96. MALAYSIA GALLIUM NITRIDE MARKET SIZE ESTIMATES & FORECAST, BY APPLICATION, 2019-2035 (USD BILLIONS)
      1. \r\n
    97. MALAYSIA GALLIUM NITRIDE MARKET SIZE ESTIMATES & FORECAST, BY TYPE, 2019-2035 (USD BILLIONS)
      1. \r\n
    98. MALAYSIA GALLIUM NITRIDE MARKET SIZE ESTIMATES & FORECAST, BY END USE, 2019-2035 (USD BILLIONS)
      1. \r\n
    99. MALAYSIA GALLIUM NITRIDE MARKET SIZE ESTIMATES & FORECAST, BY PRODUCTION METHOD, 2019-2035 (USD BILLIONS)
      1. \r\n
    100. MALAYSIA GALLIUM NITRIDE MARKET SIZE ESTIMATES & FORECAST, BY REGIONAL, 2019-2035 (USD BILLIONS)
      1. \r\n
    101. THAILAND GALLIUM NITRIDE MARKET SIZE ESTIMATES & FORECAST, BY APPLICATION, 2019-2035 (USD BILLIONS)
      1. \r\n
    102. THAILAND GALLIUM NITRIDE MARKET SIZE ESTIMATES & FORECAST, BY TYPE, 2019-2035 (USD BILLIONS)
      1. \r\n
    103. THAILAND GALLIUM NITRIDE MARKET SIZE ESTIMATES & FORECAST, BY END USE, 2019-2035 (USD BILLIONS)
      1. \r\n
    104. THAILAND GALLIUM NITRIDE MARKET SIZE ESTIMATES & FORECAST, BY PRODUCTION METHOD, 2019-2035 (USD BILLIONS)
      1. \r\n
    105. THAILAND GALLIUM NITRIDE MARKET SIZE ESTIMATES & FORECAST, BY REGIONAL, 2019-2035 (USD BILLIONS)
      1. \r\n
    106. INDONESIA GALLIUM NITRIDE MARKET SIZE ESTIMATES & FORECAST, BY APPLICATION, 2019-2035 (USD BILLIONS)
      1. \r\n
    107. INDONESIA GALLIUM NITRIDE MARKET SIZE ESTIMATES & FORECAST, BY TYPE, 2019-2035 (USD BILLIONS)
      1. \r\n
    108. INDONESIA GALLIUM NITRIDE MARKET SIZE ESTIMATES & FORECAST, BY END USE, 2019-2035 (USD BILLIONS)
      1. \r\n
    109. INDONESIA GALLIUM NITRIDE MARKET SIZE ESTIMATES & FORECAST, BY PRODUCTION METHOD, 2019-2035 (USD BILLIONS)
      1. \r\n
    110. INDONESIA GALLIUM NITRIDE MARKET SIZE ESTIMATES & FORECAST, BY REGIONAL, 2019-2035 (USD BILLIONS)
      1. \r\n
    111. REST OF APAC GALLIUM NITRIDE MARKET SIZE ESTIMATES & FORECAST, BY APPLICATION, 2019-2035 (USD BILLIONS)
      1. \r\n
    112. REST OF APAC GALLIUM NITRIDE MARKET SIZE ESTIMATES & FORECAST, BY TYPE, 2019-2035 (USD BILLIONS)
      1. \r\n
    113. REST OF APAC GALLIUM NITRIDE MARKET SIZE ESTIMATES & FORECAST, BY END USE, 2019-2035 (USD BILLIONS)
      1. \r\n
    114. REST OF APAC GALLIUM NITRIDE MARKET SIZE ESTIMATES & FORECAST, BY PRODUCTION METHOD, 2019-2035 (USD BILLIONS)
      1. \r\n
    115. REST OF APAC GALLIUM NITRIDE MARKET SIZE ESTIMATES & FORECAST, BY REGIONAL, 2019-2035 (USD BILLIONS)
      1. \r\n
    116. SOUTH AMERICA GALLIUM NITRIDE MARKET SIZE ESTIMATES & FORECAST, BY APPLICATION, 2019-2035 (USD BILLIONS)
      1. \r\n
    117. SOUTH AMERICA GALLIUM NITRIDE MARKET SIZE ESTIMATES & FORECAST, BY TYPE, 2019-2035 (USD BILLIONS)
      1. \r\n
    118. SOUTH AMERICA GALLIUM NITRIDE MARKET SIZE ESTIMATES & FORECAST, BY END USE, 2019-2035 (USD BILLIONS)
      1. \r\n
    119. SOUTH AMERICA GALLIUM NITRIDE MARKET SIZE ESTIMATES & FORECAST, BY PRODUCTION METHOD, 2019-2035 (USD BILLIONS)
      1. \r\n
    120. SOUTH AMERICA GALLIUM NITRIDE MARKET SIZE ESTIMATES & FORECAST, BY REGIONAL, 2019-2035 (USD BILLIONS)
      1. \r\n
    121. BRAZIL GALLIUM NITRIDE MARKET SIZE ESTIMATES & FORECAST, BY APPLICATION, 2019-2035 (USD BILLIONS)
      1. \r\n
    122. BRAZIL GALLIUM NITRIDE MARKET SIZE ESTIMATES & FORECAST, BY TYPE, 2019-2035 (USD BILLIONS)
      1. \r\n
    123. BRAZIL GALLIUM NITRIDE MARKET SIZE ESTIMATES & FORECAST, BY END USE, 2019-2035 (USD BILLIONS)
      1. \r\n
    124. BRAZIL GALLIUM NITRIDE MARKET SIZE ESTIMATES & FORECAST, BY PRODUCTION METHOD, 2019-2035 (USD BILLIONS)
      1. \r\n
    125. BRAZIL GALLIUM NITRIDE MARKET SIZE ESTIMATES & FORECAST, BY REGIONAL, 2019-2035 (USD BILLIONS)
      1. \r\n
    126. MEXICO GALLIUM NITRIDE MARKET SIZE ESTIMATES & FORECAST, BY APPLICATION, 2019-2035 (USD BILLIONS)
      1. \r\n
    127. MEXICO GALLIUM NITRIDE MARKET SIZE ESTIMATES & FORECAST, BY TYPE, 2019-2035 (USD BILLIONS)
      1. \r\n
    128. MEXICO GALLIUM NITRIDE MARKET SIZE ESTIMATES & FORECAST, BY END USE, 2019-2035 (USD BILLIONS)
      1. \r\n
    129. MEXICO GALLIUM NITRIDE MARKET SIZE ESTIMATES & FORECAST, BY PRODUCTION METHOD, 2019-2035 (USD BILLIONS)
      1. \r\n
    130. MEXICO GALLIUM NITRIDE MARKET SIZE ESTIMATES & FORECAST, BY REGIONAL, 2019-2035 (USD BILLIONS)
      1. \r\n
    131. ARGENTINA GALLIUM NITRIDE MARKET SIZE ESTIMATES & FORECAST, BY APPLICATION, 2019-2035 (USD BILLIONS)
      1. \r\n
    132. ARGENTINA GALLIUM NITRIDE MARKET SIZE ESTIMATES & FORECAST, BY TYPE, 2019-2035 (USD BILLIONS)
      1. \r\n
    133. ARGENTINA GALLIUM NITRIDE MARKET SIZE ESTIMATES & FORECAST, BY END USE, 2019-2035 (USD BILLIONS)
      1. \r\n
    134. ARGENTINA GALLIUM NITRIDE MARKET SIZE ESTIMATES & FORECAST, BY PRODUCTION METHOD, 2019-2035 (USD BILLIONS)
      1. \r\n
    135. ARGENTINA GALLIUM NITRIDE MARKET SIZE ESTIMATES & FORECAST, BY REGIONAL, 2019-2035 (USD BILLIONS)
      1. \r\n
    136. REST OF SOUTH AMERICA GALLIUM NITRIDE MARKET SIZE ESTIMATES & FORECAST, BY APPLICATION, 2019-2035 (USD BILLIONS)
      1. \r\n
    137. REST OF SOUTH AMERICA GALLIUM NITRIDE MARKET SIZE ESTIMATES & FORECAST, BY TYPE, 2019-2035 (USD BILLIONS)
      1. \r\n
    138. REST OF SOUTH AMERICA GALLIUM NITRIDE MARKET SIZE ESTIMATES & FORECAST, BY END USE, 2019-2035 (USD BILLIONS)
      1. \r\n
    139. REST OF SOUTH AMERICA GALLIUM NITRIDE MARKET SIZE ESTIMATES & FORECAST, BY PRODUCTION METHOD, 2019-2035 (USD BILLIONS)
      1. \r\n
    140. REST OF SOUTH AMERICA GALLIUM NITRIDE MARKET SIZE ESTIMATES & FORECAST, BY REGIONAL, 2019-2035 (USD BILLIONS)
      1. \r\n
    141. MEA GALLIUM NITRIDE MARKET SIZE ESTIMATES & FORECAST, BY APPLICATION, 2019-2035 (USD BILLIONS)
      1. \r\n
    142. MEA GALLIUM NITRIDE MARKET SIZE ESTIMATES & FORECAST, BY TYPE, 2019-2035 (USD BILLIONS)
      1. \r\n
    143. MEA GALLIUM NITRIDE MARKET SIZE ESTIMATES & FORECAST, BY END USE, 2019-2035 (USD BILLIONS)
      1. \r\n
    144. MEA GALLIUM NITRIDE MARKET SIZE ESTIMATES & FORECAST, BY PRODUCTION METHOD, 2019-2035 (USD BILLIONS)
      1. \r\n
    145. MEA GALLIUM NITRIDE MARKET SIZE ESTIMATES & FORECAST, BY REGIONAL, 2019-2035 (USD BILLIONS)
      1. \r\n
    146. GCC COUNTRIES GALLIUM NITRIDE MARKET SIZE ESTIMATES & FORECAST, BY APPLICATION, 2019-2035 (USD BILLIONS)
      1. \r\n
    147. GCC COUNTRIES GALLIUM NITRIDE MARKET SIZE ESTIMATES & FORECAST, BY TYPE, 2019-2035 (USD BILLIONS)
      1. \r\n
    148. GCC COUNTRIES GALLIUM NITRIDE MARKET SIZE ESTIMATES & FORECAST, BY END USE, 2019-2035 (USD BILLIONS)
      1. \r\n
    149. GCC COUNTRIES GALLIUM NITRIDE MARKET SIZE ESTIMATES & FORECAST, BY PRODUCTION METHOD, 2019-2035 (USD BILLIONS)
      1. \r\n
    150. GCC COUNTRIES GALLIUM NITRIDE MARKET SIZE ESTIMATES & FORECAST, BY REGIONAL, 2019-2035 (USD BILLIONS)
      1. \r\n
    151. SOUTH AFRICA GALLIUM NITRIDE MARKET SIZE ESTIMATES & FORECAST, BY APPLICATION, 2019-2035 (USD BILLIONS)
      1. \r\n
    152. SOUTH AFRICA GALLIUM NITRIDE MARKET SIZE ESTIMATES & FORECAST, BY TYPE, 2019-2035 (USD BILLIONS)
      1. \r\n
    153. SOUTH AFRICA GALLIUM NITRIDE MARKET SIZE ESTIMATES & FORECAST, BY END USE, 2019-2035 (USD BILLIONS)
      1. \r\n
    154. SOUTH AFRICA GALLIUM NITRIDE MARKET SIZE ESTIMATES & FORECAST, BY PRODUCTION METHOD, 2019-2035 (USD BILLIONS)
      1. \r\n
    155. SOUTH AFRICA GALLIUM NITRIDE MARKET SIZE ESTIMATES & FORECAST, BY REGIONAL, 2019-2035 (USD BILLIONS)
      1. \r\n
    156. REST OF MEA GALLIUM NITRIDE MARKET SIZE ESTIMATES & FORECAST, BY APPLICATION, 2019-2035 (USD BILLIONS)
      1. \r\n
    157. REST OF MEA GALLIUM NITRIDE MARKET SIZE ESTIMATES & FORECAST, BY TYPE, 2019-2035 (USD BILLIONS)
      1. \r\n
    158. REST OF MEA GALLIUM NITRIDE MARKET SIZE ESTIMATES & FORECAST, BY END USE, 2019-2035 (USD BILLIONS)
      1. \r\n
    159. REST OF MEA GALLIUM NITRIDE MARKET SIZE ESTIMATES & FORECAST, BY PRODUCTION METHOD, 2019-2035 (USD BILLIONS)
      1. \r\n
    160. REST OF MEA GALLIUM NITRIDE MARKET SIZE ESTIMATES & FORECAST, BY REGIONAL, 2019-2035 (USD BILLIONS)
      1. \r\n
    161. PRODUCT LAUNCH/PRODUCT DEVELOPMENT/APPROVAL
      1. \r\n
    162. ACQUISITION/PARTNERSHIP
      1. \r\n
      2. \r\n
      3. \r\n
      4. \r\n
      5. \r\n
      6. \r\n
      7. \r\n
      8. \r\n
      9. \r\n
      10. \r\n
      11. \r\n
      12. \r\n
      13. \r\n
      14. \r\n
      15. \r\n
      16. \r\n
      17. \r\n
      18. \r\n
      19. \r\n
      20. \r\n
      21. \r\n
      22. \r\n
      23. \r\n
      24. \r\n
      25. \r\n
      26. \r\n
      27. \r\n
      28. \r\n
      29. \r\n
      30. \r\n
    163. LIST OF FIGURES
      1. \r\n
      2. \r\n
    164. MARKET SYNOPSIS
      1. \r\n
    165. NORTH AMERICA GALLIUM NITRIDE MARKET ANALYSIS
      1. \r\n
    166. US GALLIUM NITRIDE MARKET ANALYSIS BY APPLICATION
      1. \r\n
    167. US GALLIUM NITRIDE MARKET ANALYSIS BY TYPE
      1. \r\n
    168. US GALLIUM NITRIDE MARKET ANALYSIS BY END USE
      1. \r\n
    169. US GALLIUM NITRIDE MARKET ANALYSIS BY PRODUCTION METHOD
      1. \r\n
    170. US GALLIUM NITRIDE MARKET ANALYSIS BY REGIONAL
      1. \r\n
    171. CANADA GALLIUM NITRIDE MARKET ANALYSIS BY APPLICATION
      1. \r\n
    172. CANADA GALLIUM NITRIDE MARKET ANALYSIS BY TYPE
      1. \r\n
    173. CANADA GALLIUM NITRIDE MARKET ANALYSIS BY END USE
      1. \r\n
    174. CANADA GALLIUM NITRIDE MARKET ANALYSIS BY PRODUCTION METHOD
      1. \r\n
    175. CANADA GALLIUM NITRIDE MARKET ANALYSIS BY REGIONAL
      1. \r\n
    176. EUROPE GALLIUM NITRIDE MARKET ANALYSIS
      1. \r\n
    177. GERMANY GALLIUM NITRIDE MARKET ANALYSIS BY APPLICATION
      1. \r\n
    178. GERMANY GALLIUM NITRIDE MARKET ANALYSIS BY TYPE
      1. \r\n
    179. GERMANY GALLIUM NITRIDE MARKET ANALYSIS BY END USE
      1. \r\n
    180. GERMANY GALLIUM NITRIDE MARKET ANALYSIS BY PRODUCTION METHOD
      1. \r\n
    181. GERMANY GALLIUM NITRIDE MARKET ANALYSIS BY REGIONAL
      1. \r\n
    182. UK GALLIUM NITRIDE MARKET ANALYSIS BY APPLICATION
      1. \r\n
    183. UK GALLIUM NITRIDE MARKET ANALYSIS BY TYPE
      1. \r\n
    184. UK GALLIUM NITRIDE MARKET ANALYSIS BY END USE
      1. \r\n
    185. UK GALLIUM NITRIDE MARKET ANALYSIS BY PRODUCTION METHOD
      1. \r\n
    186. UK GALLIUM NITRIDE MARKET ANALYSIS BY REGIONAL
      1. \r\n
    187. FRANCE GALLIUM NITRIDE MARKET ANALYSIS BY APPLICATION
      1. \r\n
    188. FRANCE GALLIUM NITRIDE MARKET ANALYSIS BY TYPE
      1. \r\n
    189. FRANCE GALLIUM NITRIDE MARKET ANALYSIS BY END USE
      1. \r\n
    190. FRANCE GALLIUM NITRIDE MARKET ANALYSIS BY PRODUCTION METHOD
      1. \r\n
    191. FRANCE GALLIUM NITRIDE MARKET ANALYSIS BY REGIONAL
      1. \r\n
    192. RUSSIA GALLIUM NITRIDE MARKET ANALYSIS BY APPLICATION
      1. \r\n
    193. RUSSIA GALLIUM NITRIDE MARKET ANALYSIS BY TYPE
      1. \r\n
    194. RUSSIA GALLIUM NITRIDE MARKET ANALYSIS BY END USE
      1. \r\n
    195. RUSSIA GALLIUM NITRIDE MARKET ANALYSIS BY PRODUCTION METHOD
      1. \r\n
    196. RUSSIA GALLIUM NITRIDE MARKET ANALYSIS BY REGIONAL
      1. \r\n
    197. ITALY GALLIUM NITRIDE MARKET ANALYSIS BY APPLICATION
      1. \r\n
    198. ITALY GALLIUM NITRIDE MARKET ANALYSIS BY TYPE
      1. \r\n
    199. ITALY GALLIUM NITRIDE MARKET ANALYSIS BY END USE
      1. \r\n
    200. ITALY GALLIUM NITRIDE MARKET ANALYSIS BY PRODUCTION METHOD
      1. \r\n
    201. ITALY GALLIUM NITRIDE MARKET ANALYSIS BY REGIONAL
      1. \r\n
    202. SPAIN GALLIUM NITRIDE MARKET ANALYSIS BY APPLICATION
      1. \r\n
    203. SPAIN GALLIUM NITRIDE MARKET ANALYSIS BY TYPE
      1. \r\n
    204. SPAIN GALLIUM NITRIDE MARKET ANALYSIS BY END USE
      1. \r\n
    205. SPAIN GALLIUM NITRIDE MARKET ANALYSIS BY PRODUCTION METHOD
      1. \r\n
    206. SPAIN GALLIUM NITRIDE MARKET ANALYSIS BY REGIONAL
      1. \r\n
    207. REST OF EUROPE GALLIUM NITRIDE MARKET ANALYSIS BY APPLICATION
      1. \r\n
    208. REST OF EUROPE GALLIUM NITRIDE MARKET ANALYSIS BY TYPE
      1. \r\n
    209. REST OF EUROPE GALLIUM NITRIDE MARKET ANALYSIS BY END USE
      1. \r\n
    210. REST OF EUROPE GALLIUM NITRIDE MARKET ANALYSIS BY PRODUCTION METHOD
      1. \r\n
    211. REST OF EUROPE GALLIUM NITRIDE MARKET ANALYSIS BY REGIONAL
      1. \r\n
    212. APAC GALLIUM NITRIDE MARKET ANALYSIS
      1. \r\n
    213. CHINA GALLIUM NITRIDE MARKET ANALYSIS BY APPLICATION
      1. \r\n
    214. CHINA GALLIUM NITRIDE MARKET ANALYSIS BY TYPE
      1. \r\n
    215. CHINA GALLIUM NITRIDE MARKET ANALYSIS BY END USE
      1. \r\n
    216. CHINA GALLIUM NITRIDE MARKET ANALYSIS BY PRODUCTION METHOD
      1. \r\n
    217. CHINA GALLIUM NITRIDE MARKET ANALYSIS BY REGIONAL
      1. \r\n
    218. INDIA GALLIUM NITRIDE MARKET ANALYSIS BY APPLICATION
      1. \r\n
    219. INDIA GALLIUM NITRIDE MARKET ANALYSIS BY TYPE
      1. \r\n
    220. INDIA GALLIUM NITRIDE MARKET ANALYSIS BY END USE
      1. \r\n
    221. INDIA GALLIUM NITRIDE MARKET ANALYSIS BY PRODUCTION METHOD
      1. \r\n
    222. INDIA GALLIUM NITRIDE MARKET ANALYSIS BY REGIONAL
      1. \r\n
    223. JAPAN GALLIUM NITRIDE MARKET ANALYSIS BY APPLICATION
      1. \r\n
    224. JAPAN GALLIUM NITRIDE MARKET ANALYSIS BY TYPE
      1. \r\n
    225. JAPAN GALLIUM NITRIDE MARKET ANALYSIS BY END USE
      1. \r\n
    226. JAPAN GALLIUM NITRIDE MARKET ANALYSIS BY PRODUCTION METHOD
      1. \r\n
    227. JAPAN GALLIUM NITRIDE MARKET ANALYSIS BY REGIONAL
      1. \r\n
    228. SOUTH KOREA GALLIUM NITRIDE MARKET ANALYSIS BY APPLICATION
      1. \r\n
    229. SOUTH KOREA GALLIUM NITRIDE MARKET ANALYSIS BY TYPE
      1. \r\n
    230. SOUTH KOREA GALLIUM NITRIDE MARKET ANALYSIS BY END USE
      1. \r\n
    231. SOUTH KOREA GALLIUM NITRIDE MARKET ANALYSIS BY PRODUCTION METHOD
      1. \r\n
    232. SOUTH KOREA GALLIUM NITRIDE MARKET ANALYSIS BY REGIONAL
      1. \r\n
    233. MALAYSIA GALLIUM NITRIDE MARKET ANALYSIS BY APPLICATION
      1. \r\n
    234. MALAYSIA GALLIUM NITRIDE MARKET ANALYSIS BY TYPE
      1. \r\n
    235. MALAYSIA GALLIUM NITRIDE MARKET ANALYSIS BY END USE
      1. \r\n
    236. MALAYSIA GALLIUM NITRIDE MARKET ANALYSIS BY PRODUCTION METHOD
      1. \r\n
    237. MALAYSIA GALLIUM NITRIDE MARKET ANALYSIS BY REGIONAL
      1. \r\n
    238. THAILAND GALLIUM NITRIDE MARKET ANALYSIS BY APPLICATION
      1. \r\n
    239. THAILAND GALLIUM NITRIDE MARKET ANALYSIS BY TYPE
      1. \r\n
    240. THAILAND GALLIUM NITRIDE MARKET ANALYSIS BY END USE
      1. \r\n
    241. THAILAND GALLIUM NITRIDE MARKET ANALYSIS BY PRODUCTION METHOD
      1. \r\n
    242. THAILAND GALLIUM NITRIDE MARKET ANALYSIS BY REGIONAL
      1. \r\n
    243. INDONESIA GALLIUM NITRIDE MARKET ANALYSIS BY APPLICATION
      1. \r\n
    244. INDONESIA GALLIUM NITRIDE MARKET ANALYSIS BY TYPE
      1. \r\n
    245. INDONESIA GALLIUM NITRIDE MARKET ANALYSIS BY END USE
      1. \r\n
    246. INDONESIA GALLIUM NITRIDE MARKET ANALYSIS BY PRODUCTION METHOD
      1. \r\n
    247. INDONESIA GALLIUM NITRIDE MARKET ANALYSIS BY REGIONAL
      1. \r\n
    248. REST OF APAC GALLIUM NITRIDE MARKET ANALYSIS BY APPLICATION
      1. \r\n
    249. REST OF APAC GALLIUM NITRIDE MARKET ANALYSIS BY TYPE
      1. \r\n
    250. REST OF APAC GALLIUM NITRIDE MARKET ANALYSIS BY END USE
      1. \r\n
    251. REST OF APAC GALLIUM NITRIDE MARKET ANALYSIS BY PRODUCTION METHOD
      1. \r\n
    252. REST OF APAC GALLIUM NITRIDE MARKET ANALYSIS BY REGIONAL
      1. \r\n
    253. SOUTH AMERICA GALLIUM NITRIDE MARKET ANALYSIS
      1. \r\n
    254. BRAZIL GALLIUM NITRIDE MARKET ANALYSIS BY APPLICATION
      1. \r\n
    255. BRAZIL GALLIUM NITRIDE MARKET ANALYSIS BY TYPE
      1. \r\n
    256. BRAZIL GALLIUM NITRIDE MARKET ANALYSIS BY END USE
      1. \r\n
    257. BRAZIL GALLIUM NITRIDE MARKET ANALYSIS BY PRODUCTION METHOD
      1. \r\n
    258. BRAZIL GALLIUM NITRIDE MARKET ANALYSIS BY REGIONAL
      1. \r\n
    259. MEXICO GALLIUM NITRIDE MARKET ANALYSIS BY APPLICATION
      1. \r\n
    260. MEXICO GALLIUM NITRIDE MARKET ANALYSIS BY TYPE
      1. \r\n
    261. MEXICO GALLIUM NITRIDE MARKET ANALYSIS BY END USE
      1. \r\n
    262. MEXICO GALLIUM NITRIDE MARKET ANALYSIS BY PRODUCTION METHOD
      1. \r\n
    263. MEXICO GALLIUM NITRIDE MARKET ANALYSIS BY REGIONAL
      1. \r\n
    264. ARGENTINA GALLIUM NITRIDE MARKET ANALYSIS BY APPLICATION
      1. \r\n
    265. ARGENTINA GALLIUM NITRIDE MARKET ANALYSIS BY TYPE
      1. \r\n
    266. ARGENTINA GALLIUM NITRIDE MARKET ANALYSIS BY END USE
      1. \r\n
    267. ARGENTINA GALLIUM NITRIDE MARKET ANALYSIS BY PRODUCTION METHOD
      1. \r\n
    268. ARGENTINA GALLIUM NITRIDE MARKET ANALYSIS BY REGIONAL
      1. \r\n
    269. REST OF SOUTH AMERICA GALLIUM NITRIDE MARKET ANALYSIS BY APPLICATION
      1. \r\n
    270. REST OF SOUTH AMERICA GALLIUM NITRIDE MARKET ANALYSIS BY TYPE
      1. \r\n
    271. REST OF SOUTH AMERICA GALLIUM NITRIDE MARKET ANALYSIS BY END USE
      1. \r\n
    272. REST OF SOUTH AMERICA GALLIUM NITRIDE MARKET ANALYSIS BY PRODUCTION METHOD
      1. \r\n
    273. REST OF SOUTH AMERICA GALLIUM NITRIDE MARKET ANALYSIS BY REGIONAL
      1. \r\n
    274. MEA GALLIUM NITRIDE MARKET ANALYSIS
      1. \r\n
    275. GCC COUNTRIES GALLIUM NITRIDE MARKET ANALYSIS BY APPLICATION
      1. \r\n
    276. GCC COUNTRIES GALLIUM NITRIDE MARKET ANALYSIS BY TYPE
      1. \r\n
    277. GCC COUNTRIES GALLIUM NITRIDE MARKET ANALYSIS BY END USE
      1. \r\n
    278. GCC COUNTRIES GALLIUM NITRIDE MARKET ANALYSIS BY PRODUCTION METHOD
      1. \r\n
    279. GCC COUNTRIES GALLIUM NITRIDE MARKET ANALYSIS BY REGIONAL
      1. \r\n
    280. SOUTH AFRICA GALLIUM NITRIDE MARKET ANALYSIS BY APPLICATION
      1. \r\n
    281. SOUTH AFRICA GALLIUM NITRIDE MARKET ANALYSIS BY TYPE
      1. \r\n
    282. SOUTH AFRICA GALLIUM NITRIDE MARKET ANALYSIS BY END USE
      1. \r\n
    283. SOUTH AFRICA GALLIUM NITRIDE MARKET ANALYSIS BY PRODUCTION METHOD
      1. \r\n
    284. SOUTH AFRICA GALLIUM NITRIDE MARKET ANALYSIS BY REGIONAL
      1. \r\n
    285. REST OF MEA GALLIUM NITRIDE MARKET ANALYSIS BY APPLICATION
      1. \r\n
    286. REST OF MEA GALLIUM NITRIDE MARKET ANALYSIS BY TYPE
      1. \r\n
    287. REST OF MEA GALLIUM NITRIDE MARKET ANALYSIS BY END USE
      1. \r\n
    288. REST OF MEA GALLIUM NITRIDE MARKET ANALYSIS BY PRODUCTION METHOD
      1. \r\n
    289. REST OF MEA GALLIUM NITRIDE MARKET ANALYSIS BY REGIONAL
      1. \r\n
    290. KEY BUYING CRITERIA OF GALLIUM NITRIDE MARKET
      1. \r\n
    291. RESEARCH PROCESS OF MRFR
      1. \r\n
    292. DRO ANALYSIS OF GALLIUM NITRIDE MARKET
      1. \r\n
    293. DRIVERS IMPACT ANALYSIS: GALLIUM NITRIDE MARKET
      1. \r\n
    294. RESTRAINTS IMPACT ANALYSIS: GALLIUM NITRIDE MARKET
      1. \r\n
    295. SUPPLY / VALUE CHAIN: GALLIUM NITRIDE MARKET
      1. \r\n
    296. GALLIUM NITRIDE MARKET, BY APPLICATION, 2025 (% SHARE)
      1. \r\n
    297. GALLIUM NITRIDE MARKET, BY APPLICATION, 2019 TO 2035 (USD Billions)
      1. \r\n
    298. GALLIUM NITRIDE MARKET, BY TYPE, 2025 (% SHARE)
      1. \r\n
    299. GALLIUM NITRIDE MARKET, BY TYPE, 2019 TO 2035 (USD Billions)
      1. \r\n
    300. GALLIUM NITRIDE MARKET, BY END USE, 2025 (% SHARE)
      1. \r\n
    301. GALLIUM NITRIDE MARKET, BY END USE, 2019 TO 2035 (USD Billions)
      1. \r\n
    302. GALLIUM NITRIDE MARKET, BY PRODUCTION METHOD, 2025 (% SHARE)
      1. \r\n
    303. GALLIUM NITRIDE MARKET, BY PRODUCTION METHOD, 2019 TO 2035 (USD Billions)
      1. \r\n
    304. GALLIUM NITRIDE MARKET, BY REGIONAL, 2025 (% SHARE)
      1. \r\n
    305. GALLIUM NITRIDE MARKET, BY REGIONAL, 2019 TO 2035 (USD Billions)
      1. \r\n
    306. BENCHMARKING OF MAJOR COMPETITORS
      1. \r\n

    Gallium Nitride Market Segmentation


    Gallium Nitride Market By Application (USD Billion, 2019-2035)

    Power Devices

    RF Devices

    LEDs

    Laser Diodes


    Gallium Nitride Market By Type (USD Billion, 2019-2035)

    GaN-on-Silicon

    GaN-on-Sapphire

    GaN-on-SiC


    Gallium Nitride Market By End Use (USD Billion, 2019-2035)

    Consumer Electronics

    Telecommunications

    Automotive

    Aerospace


    Gallium Nitride Market By Production Method (USD Billion, 2019-2035)

    MOCVD

    Hydride Vapor Phase Epitaxy

    Liquid Phase Epitaxy


    Gallium Nitride Market By Regional (USD Billion, 2019-2035)

    North America

    Europe

    South America

    Asia Pacific

    Middle East and Africa


    Gallium Nitride Market Regional Outlook (USD Billion, 2019-2035)


    North America Outlook (USD Billion, 2019-2035)

    North America Gallium Nitride Market by Application Type

    Power Devices

    RF Devices

    LEDs

    Laser Diodes

    North America Gallium Nitride Market by Type

    GaN-on-Silicon

    GaN-on-Sapphire

    GaN-on-SiC

    North America Gallium Nitride Market by End Use Type

    Consumer Electronics

    Telecommunications

    Automotive

    Aerospace

    North America Gallium Nitride Market by Production Method Type

    MOCVD

    Hydride Vapor Phase Epitaxy

    Liquid Phase Epitaxy

    North America Gallium Nitride Market by Regional Type

    US

    Canada

    US Outlook (USD Billion, 2019-2035)

    US Gallium Nitride Market by Application Type

    Power Devices

    RF Devices

    LEDs

    Laser Diodes

    US Gallium Nitride Market by Type

    GaN-on-Silicon

    GaN-on-Sapphire

    GaN-on-SiC

    US Gallium Nitride Market by End Use Type

    Consumer Electronics

    Telecommunications

    Automotive

    Aerospace

    US Gallium Nitride Market by Production Method Type

    MOCVD

    Hydride Vapor Phase Epitaxy

    Liquid Phase Epitaxy
    CANADA Outlook (USD Billion, 2019-2035)

    CANADA Gallium Nitride Market by Application Type

    Power Devices

    RF Devices

    LEDs

    Laser Diodes

    CANADA Gallium Nitride Market by Type

    GaN-on-Silicon

    GaN-on-Sapphire

    GaN-on-SiC

    CANADA Gallium Nitride Market by End Use Type

    Consumer Electronics

    Telecommunications

    Automotive

    Aerospace

    CANADA Gallium Nitride Market by Production Method Type

    MOCVD

    Hydride Vapor Phase Epitaxy

    Liquid Phase Epitaxy
    Europe Outlook (USD Billion, 2019-2035)

    Europe Gallium Nitride Market by Application Type

    Power Devices

    RF Devices

    LEDs

    Laser Diodes

    Europe Gallium Nitride Market by Type

    GaN-on-Silicon

    GaN-on-Sapphire

    GaN-on-SiC

    Europe Gallium Nitride Market by End Use Type

    Consumer Electronics

    Telecommunications

    Automotive

    Aerospace

    Europe Gallium Nitride Market by Production Method Type

    MOCVD

    Hydride Vapor Phase Epitaxy

    Liquid Phase Epitaxy

    Europe Gallium Nitride Market by Regional Type

    Germany

    UK

    France

    Russia

    Italy

    Spain

    Rest of Europe

    GERMANY Outlook (USD Billion, 2019-2035)

    GERMANY Gallium Nitride Market by Application Type

    Power Devices

    RF Devices

    LEDs

    Laser Diodes

    GERMANY Gallium Nitride Market by Type

    GaN-on-Silicon

    GaN-on-Sapphire

    GaN-on-SiC

    GERMANY Gallium Nitride Market by End Use Type

    Consumer Electronics

    Telecommunications

    Automotive

    Aerospace

    GERMANY Gallium Nitride Market by Production Method Type

    MOCVD

    Hydride Vapor Phase Epitaxy

    Liquid Phase Epitaxy

    UK Outlook (USD Billion, 2019-2035)

    UK Gallium Nitride Market by Application Type

    Power Devices

    RF Devices

    LEDs

    Laser Diodes

    UK Gallium Nitride Market by Type

    GaN-on-Silicon

    GaN-on-Sapphire

    GaN-on-SiC

    UK Gallium Nitride Market by End Use Type

    Consumer Electronics

    Telecommunications

    Automotive

    Aerospace

    UK Gallium Nitride Market by Production Method Type

    MOCVD

    Hydride Vapor Phase Epitaxy

    Liquid Phase Epitaxy
    FRANCE Outlook (USD Billion, 2019-2035)

    FRANCE Gallium Nitride Market by Application Type

    Power Devices

    RF Devices

    LEDs

    Laser Diodes

    FRANCE Gallium Nitride Market by Type

    GaN-on-Silicon

    GaN-on-Sapphire

    GaN-on-SiC

    FRANCE Gallium Nitride Market by End Use Type

    Consumer Electronics

    Telecommunications

    Automotive

    Aerospace

    FRANCE Gallium Nitride Market by Production Method Type

    MOCVD

    Hydride Vapor Phase Epitaxy

    Liquid Phase Epitaxy

    RUSSIA Outlook (USD Billion, 2019-2035)

    RUSSIA Gallium Nitride Market by Application Type

    Power Devices

    RF Devices

    LEDs

    Laser Diodes

    RUSSIA Gallium Nitride Market by Type

    GaN-on-Silicon

    GaN-on-Sapphire

    GaN-on-SiC

    RUSSIA Gallium Nitride Market by End Use Type

    Consumer Electronics

    Telecommunications

    Automotive

    Aerospace

    RUSSIA Gallium Nitride Market by Production Method Type

    MOCVD

    Hydride Vapor Phase Epitaxy

    Liquid Phase Epitaxy

    ITALY Outlook (USD Billion, 2019-2035)

    ITALY Gallium Nitride Market by Application Type

    Power Devices

    RF Devices

    LEDs

    Laser Diodes

    ITALY Gallium Nitride Market by Type

    GaN-on-Silicon

    GaN-on-Sapphire

    GaN-on-SiC

    ITALY Gallium Nitride Market by End Use Type

    Consumer Electronics

    Telecommunications

    Automotive

    Aerospace

    ITALY Gallium Nitride Market by Production Method Type

    MOCVD

    Hydride Vapor Phase Epitaxy

    Liquid Phase Epitaxy

    SPAIN Outlook (USD Billion, 2019-2035)

    SPAIN Gallium Nitride Market by Application Type

    Power Devices

    RF Devices

    LEDs

    Laser Diodes

    SPAIN Gallium Nitride Market by Type

    GaN-on-Silicon

    GaN-on-Sapphire

    GaN-on-SiC

    SPAIN Gallium Nitride Market by End Use Type

    Consumer Electronics

    Telecommunications

    Automotive

    Aerospace

    SPAIN Gallium Nitride Market by Production Method Type

    MOCVD

    Hydride Vapor Phase Epitaxy

    Liquid Phase Epitaxy

    REST OF EUROPE Outlook (USD Billion, 2019-2035)

    REST OF EUROPE Gallium Nitride Market by Application Type

    Power Devices

    RF Devices

    LEDs

    Laser Diodes

    REST OF EUROPE Gallium Nitride Market by Type

    GaN-on-Silicon

    GaN-on-Sapphire

    GaN-on-SiC

    REST OF EUROPE Gallium Nitride Market by End Use Type

    Consumer Electronics

    Telecommunications

    Automotive

    Aerospace

    REST OF EUROPE Gallium Nitride Market by Production Method Type

    MOCVD

    Hydride Vapor Phase Epitaxy

    Liquid Phase Epitaxy

    APAC Outlook (USD Billion, 2019-2035)

    APAC Gallium Nitride Market by Application Type

    Power Devices

    RF Devices

    LEDs

    Laser Diodes

    APAC Gallium Nitride Market by Type

    GaN-on-Silicon

    GaN-on-Sapphire

    GaN-on-SiC

    APAC Gallium Nitride Market by End Use Type

    Consumer Electronics

    Telecommunications

    Automotive

    Aerospace

    APAC Gallium Nitride Market by Production Method Type

    MOCVD

    Hydride Vapor Phase Epitaxy

    Liquid Phase Epitaxy

    APAC Gallium Nitride Market by Regional Type

    China

    India

    Japan

    South Korea

    Malaysia

    Thailand

    Indonesia

    Rest of APAC

    CHINA Outlook (USD Billion, 2019-2035)

    CHINA Gallium Nitride Market by Application Type

    Power Devices

    RF Devices

    LEDs

    Laser Diodes

    CHINA Gallium Nitride Market by Type

    GaN-on-Silicon

    GaN-on-Sapphire

    GaN-on-SiC

    CHINA Gallium Nitride Market by End Use Type

    Consumer Electronics

    Telecommunications

    Automotive

    Aerospace

    CHINA Gallium Nitride Market by Production Method Type

    MOCVD

    Hydride Vapor Phase Epitaxy

    Liquid Phase Epitaxy

    INDIA Outlook (USD Billion, 2019-2035)

    INDIA Gallium Nitride Market by Application Type

    Power Devices

    RF Devices

    LEDs

    Laser Diodes

    INDIA Gallium Nitride Market by Type

    GaN-on-Silicon

    GaN-on-Sapphire

    GaN-on-SiC

    INDIA Gallium Nitride Market by End Use Type

    Consumer Electronics

    Telecommunications

    Automotive

    Aerospace

    INDIA Gallium Nitride Market by Production Method Type

    MOCVD

    Hydride Vapor Phase Epitaxy

    Liquid Phase Epitaxy

    JAPAN Outlook (USD Billion, 2019-2035)

    JAPAN Gallium Nitride Market by Application Type

    Power Devices

    RF Devices

    LEDs

    Laser Diodes

    JAPAN Gallium Nitride Market by Type

    GaN-on-Silicon

    GaN-on-Sapphire

    GaN-on-SiC

    JAPAN Gallium Nitride Market by End Use Type

    Consumer Electronics

    Telecommunications

    Automotive

    Aerospace

    JAPAN Gallium Nitride Market by Production Method Type

    MOCVD

    Hydride Vapor Phase Epitaxy

    Liquid Phase Epitaxy

    SOUTH KOREA Outlook (USD Billion, 2019-2035)

    SOUTH KOREA Gallium Nitride Market by Application Type

    Power Devices

    RF Devices

    LEDs

    Laser Diodes

    SOUTH KOREA Gallium Nitride Market by Type

    GaN-on-Silicon

    GaN-on-Sapphire

    GaN-on-SiC

    SOUTH KOREA Gallium Nitride Market by End Use Type

    Consumer Electronics

    Telecommunications

    Automotive

    Aerospace

    SOUTH KOREA Gallium Nitride Market by Production Method Type

    MOCVD

    Hydride Vapor Phase Epitaxy

    Liquid Phase Epitaxy

    MALAYSIA Outlook (USD Billion, 2019-2035)

    MALAYSIA Gallium Nitride Market by Application Type

    Power Devices

    RF Devices

    LEDs

    Laser Diodes

    MALAYSIA Gallium Nitride Market by Type

    GaN-on-Silicon

    GaN-on-Sapphire

    GaN-on-SiC

    MALAYSIA Gallium Nitride Market by End Use Type

    Consumer Electronics

    Telecommunications

    Automotive

    Aerospace

    MALAYSIA Gallium Nitride Market by Production Method Type

    MOCVD

    Hydride Vapor Phase Epitaxy

    Liquid Phase Epitaxy

    THAILAND Outlook (USD Billion, 2019-2035)

    THAILAND Gallium Nitride Market by Application Type

    Power Devices

    RF Devices

    LEDs

    Laser Diodes

    THAILAND Gallium Nitride Market by Type

    GaN-on-Silicon

    GaN-on-Sapphire

    GaN-on-SiC

    THAILAND Gallium Nitride Market by End Use Type

    Consumer Electronics

    Telecommunications

    Automotive

    Aerospace

    THAILAND Gallium Nitride Market by Production Method Type

    MOCVD

    Hydride Vapor Phase Epitaxy

    Liquid Phase Epitaxy

    INDONESIA Outlook (USD Billion, 2019-2035)

    INDONESIA Gallium Nitride Market by Application Type

    Power Devices

    RF Devices

    LEDs

    Laser Diodes

    INDONESIA Gallium Nitride Market by Type

    GaN-on-Silicon

    GaN-on-Sapphire

    GaN-on-SiC

    INDONESIA Gallium Nitride Market by End Use Type

    Consumer Electronics

    Telecommunications

    Automotive

    Aerospace

    INDONESIA Gallium Nitride Market by Production Method Type

    MOCVD

    Hydride Vapor Phase Epitaxy

    Liquid Phase Epitaxy

    REST OF APAC Outlook (USD Billion, 2019-2035)

    REST OF APAC Gallium Nitride Market by Application Type

    Power Devices

    RF Devices

    LEDs

    Laser Diodes

    REST OF APAC Gallium Nitride Market by Type

    GaN-on-Silicon

    GaN-on-Sapphire

    GaN-on-SiC

    REST OF APAC Gallium Nitride Market by End Use Type

    Consumer Electronics

    Telecommunications

    Automotive

    Aerospace

    REST OF APAC Gallium Nitride Market by Production Method Type

    MOCVD

    Hydride Vapor Phase Epitaxy

    Liquid Phase Epitaxy

    South America Outlook (USD Billion, 2019-2035)

    South America Gallium Nitride Market by Application Type

    Power Devices

    RF Devices

    LEDs

    Laser Diodes

    South America Gallium Nitride Market by Type

    GaN-on-Silicon

    GaN-on-Sapphire

    GaN-on-SiC

    South America Gallium Nitride Market by End Use Type

    Consumer Electronics

    Telecommunications

    Automotive

    Aerospace

    South America Gallium Nitride Market by Production Method Type

    MOCVD

    Hydride Vapor Phase Epitaxy

    Liquid Phase Epitaxy

    South America Gallium Nitride Market by Regional Type

    Brazil

    Mexico

    Argentina

    Rest of South America

    BRAZIL Outlook (USD Billion, 2019-2035)

    BRAZIL Gallium Nitride Market by Application Type

    Power Devices

    RF Devices

    LEDs

    Laser Diodes

    BRAZIL Gallium Nitride Market by Type

    GaN-on-Silicon

    GaN-on-Sapphire

    GaN-on-SiC

    BRAZIL Gallium Nitride Market by End Use Type

    Consumer Electronics

    Telecommunications

    Automotive

    Aerospace

    BRAZIL Gallium Nitride Market by Production Method Type

    MOCVD

    Hydride Vapor Phase Epitaxy

    Liquid Phase Epitaxy

    MEXICO Outlook (USD Billion, 2019-2035)

    MEXICO Gallium Nitride Market by Application Type

    Power Devices

    RF Devices

    LEDs

    Laser Diodes

    MEXICO Gallium Nitride Market by Type

    GaN-on-Silicon

    GaN-on-Sapphire

    GaN-on-SiC

    MEXICO Gallium Nitride Market by End Use Type

    Consumer Electronics

    Telecommunications

    Automotive

    Aerospace

    MEXICO Gallium Nitride Market by Production Method Type

    MOCVD

    Hydride Vapor Phase Epitaxy

    Liquid Phase Epitaxy

    ARGENTINA Outlook (USD Billion, 2019-2035)

    ARGENTINA Gallium Nitride Market by Application Type

    Power Devices

    RF Devices

    LEDs

    Laser Diodes

    ARGENTINA Gallium Nitride Market by Type

    GaN-on-Silicon

    GaN-on-Sapphire

    GaN-on-SiC

    ARGENTINA Gallium Nitride Market by End Use Type

    Consumer Electronics

    Telecommunications

    Automotive

    Aerospace

    ARGENTINA Gallium Nitride Market by Production Method Type

    MOCVD

    Hydride Vapor Phase Epitaxy

    Liquid Phase Epitaxy

    REST OF SOUTH AMERICA Outlook (USD Billion, 2019-2035)

    REST OF SOUTH AMERICA Gallium Nitride Market by Application Type

    Power Devices

    RF Devices

    LEDs

    Laser Diodes

    REST OF SOUTH AMERICA Gallium Nitride Market by Type

    GaN-on-Silicon

    GaN-on-Sapphire

    GaN-on-SiC

    REST OF SOUTH AMERICA Gallium Nitride Market by End Use Type

    Consumer Electronics

    Telecommunications

    Automotive

    Aerospace

    REST OF SOUTH AMERICA Gallium Nitride Market by Production Method Type

    MOCVD

    Hydride Vapor Phase Epitaxy

    Liquid Phase Epitaxy

    MEA Outlook (USD Billion, 2019-2035)

    MEA Gallium Nitride Market by Application Type

    Power Devices

    RF Devices

    LEDs

    Laser Diodes

    MEA Gallium Nitride Market by Type

    GaN-on-Silicon

    GaN-on-Sapphire

    GaN-on-SiC

    MEA Gallium Nitride Market by End Use Type

    Consumer Electronics

    Telecommunications

    Automotive

    Aerospace

    MEA Gallium Nitride Market by Production Method Type

    MOCVD

    Hydride Vapor Phase Epitaxy

    Liquid Phase Epitaxy

    MEA Gallium Nitride Market by Regional Type

    GCC Countries

    South Africa

    Rest of MEA

    GCC COUNTRIES Outlook (USD Billion, 2019-2035)

    GCC COUNTRIES Gallium Nitride Market by Application Type

    Power Devices

    RF Devices

    LEDs

    Laser Diodes

    GCC COUNTRIES Gallium Nitride Market by Type

    GaN-on-Silicon

    GaN-on-Sapphire

    GaN-on-SiC

    GCC COUNTRIES Gallium Nitride Market by End Use Type

    Consumer Electronics

    Telecommunications

    Automotive

    Aerospace

    GCC COUNTRIES Gallium Nitride Market by Production Method Type

    MOCVD

    Hydride Vapor Phase Epitaxy

    Liquid Phase Epitaxy

    SOUTH AFRICA Outlook (USD Billion, 2019-2035)

    SOUTH AFRICA Gallium Nitride Market by Application Type

    Power Devices

    RF Devices

    LEDs

    Laser Diodes

    SOUTH AFRICA Gallium Nitride Market by Type

    GaN-on-Silicon

    GaN-on-Sapphire

    GaN-on-SiC

    SOUTH AFRICA Gallium Nitride Market by End Use Type

    Consumer Electronics

    Telecommunications

    Automotive

    Aerospace

    SOUTH AFRICA Gallium Nitride Market by Production Method Type

    MOCVD

    Hydride Vapor Phase Epitaxy

    Liquid Phase Epitaxy

    REST OF MEA Outlook (USD Billion, 2019-2035)

    REST OF MEA Gallium Nitride Market by Application Type

    Power Devices

    RF Devices

    LEDs

    Laser Diodes

    REST OF MEA Gallium Nitride Market by Type

    GaN-on-Silicon

    GaN-on-Sapphire

    GaN-on-SiC

    REST OF MEA Gallium Nitride Market by End Use Type

    Consumer Electronics

    Telecommunications

    Automotive

    Aerospace

    REST OF MEA Gallium Nitride Market by Production Method Type

    MOCVD

    Hydride Vapor Phase Epitaxy

    Liquid Phase Epitaxy


    Infographic

    Free Sample Request

    Kindly complete the form below to receive a free sample of this Report

    Get Free Sample

    Customer Strories

    “I am very pleased with how market segments have been defined in a relevant way for my purposes (such as "Portable Freezers & refrigerators" and "last-mile"). In general the report is well structured. Thanks very much for your efforts.”

    Victoria Milne

    Founder
    Case Study
    Chemicals and Materials

    Compare Licence

    ×
    Features License Type
    Single User Multiuser License Enterprise User
    Price $4,950 $5,950 $7,250
    Maximum User Access Limit 1 User Upto 10 Users Unrestricted Access Throughout the Organization
    Free Customization
    Direct Access to Analyst
    Deliverable Format
    Platform Access
    Discount on Next Purchase 10% 15% 15%
    Printable Versions