Request Free Sample ×

Kindly complete the form below to receive a free sample of this Report

* Please use a valid business email

Leading companies partner with us for data-driven Insights

clients tt-cursor
Hero Background

Germany Neuropathic Pain Market

ID: MRFR/HC/47669-HCR
200 Pages
Nidhi Mandole
Last Updated: April 06, 2026
Germany Neuropathic Pain Market Research Report: Size, Share, Trend Analysis By Types of Neuropathic Pain (Diabetic Neuropathy, Postherpetic Neuralgia, Trigeminal Neuralgia, Chemotherapy-Induced Peripheral Neuropathy), By Treatment Type (Medications, Physical Therapy, Surgical Procedures, Electrical Stimulation), By Route of Administration (Oral, Topical, Injectable) and By End Users (Hospitals, Clinics, Home Care) - Growth Outlook & Industry Forecast 2025 To 2035
Download PDF ×

We do not share your information with anyone. However, we may send you emails based on your report interest from time to time. You may contact us at any time to opt-out.

  1. 1 SECTION I: EXECUTIVE SUMMARY AND KEY HIGHLIGHTS
    1. 1.1 EXECUTIVE SUMMARY
      1. 1.1.1 Market Overview
      2. 1.1.2 Key Findings
      3. 1.1.3 Market Segmentation
      4. 1.1.4 Competitive Landscape
      5. 1.1.5 Challenges and Opportunities
      6. 1.1.6 Future Outlook
  2. 2 SECTION II: SCOPING, METHODOLOGY AND MARKET STRUCTURE
    1. 2.1 MARKET INTRODUCTION
      1. 2.1.1 Definition
      2. 2.1.2 Scope of the study
        1. 2.1.2.1 Research Objective
        2. 2.1.2.2 Assumption
        3. 2.1.2.3 Limitations
    2. 2.2 RESEARCH METHODOLOGY
      1. 2.2.1 Overview
      2. 2.2.2 Data Mining
      3. 2.2.3 Secondary Research
      4. 2.2.4 Primary Research
        1. 2.2.4.1 Primary Interviews and Information Gathering Process
        2. 2.2.4.2 Breakdown of Primary Respondents
      5. 2.2.5 Forecasting Model
      6. 2.2.6 Market Size Estimation
        1. 2.2.6.1 Bottom-Up Approach
        2. 2.2.6.2 Top-Down Approach
      7. 2.2.7 Data Triangulation
      8. 2.2.8 Validation
  3. 3 SECTION III: QUALITATIVE ANALYSIS
    1. 3.1 MARKET DYNAMICS
      1. 3.1.1 Overview
      2. 3.1.2 Drivers
      3. 3.1.3 Restraints
      4. 3.1.4 Opportunities
    2. 3.2 MARKET FACTOR ANALYSIS
      1. 3.2.1 Value chain Analysis
      2. 3.2.2 Porter's Five Forces Analysis
        1. 3.2.2.1 Bargaining Power of Suppliers
        2. 3.2.2.2 Bargaining Power of Buyers
        3. 3.2.2.3 Threat of New Entrants
        4. 3.2.2.4 Threat of Substitutes
        5. 3.2.2.5 Intensity of Rivalry
      3. 3.2.3 COVID-19 Impact Analysis
        1. 3.2.3.1 Market Impact Analysis
        2. 3.2.3.2 Regional Impact
        3. 3.2.3.3 Opportunity and Threat Analysis
  4. 4 SECTION IV: QUANTITATIVE ANALYSIS
    1. 4.1 Chemicals and Materials, BY Type of Neuropathic Pain (USD Million)
      1. 4.1.1 Diabetic Neuropathy
      2. 4.1.2 Postherpetic Neuralgia
      3. 4.1.3 Trigeminal Neuralgia
      4. 4.1.4 Chemotherapy-Induced Peripheral Neuropathy
    2. 4.2 Chemicals and Materials, BY Treatment Type (USD Million)
      1. 4.2.1 Medications
      2. 4.2.2 Physical Therapy
      3. 4.2.3 Surgical Procedures
      4. 4.2.4 Electrical Stimulation
    3. 4.3 Chemicals and Materials, BY Route of Administration (USD Million)
      1. 4.3.1 Oral
      2. 4.3.2 Topical
      3. 4.3.3 Injectable
    4. 4.4 Chemicals and Materials, BY End User (USD Million)
      1. 4.4.1 Hospitals
      2. 4.4.2 Clinics
      3. 4.4.3 Home Care
  5. 5 SECTION V: COMPETITIVE ANALYSIS
    1. 5.1 Competitive Landscape
      1. 5.1.1 Overview
      2. 5.1.2 Competitive Analysis
      3. 5.1.3 Market share Analysis
      4. 5.1.4 Major Growth Strategy in the Chemicals and Materials
      5. 5.1.5 Competitive Benchmarking
      6. 5.1.6 Leading Players in Terms of Number of Developments in the Chemicals and Materials
      7. 5.1.7 Key developments and growth strategies
        1. 5.1.7.1 New Product Launch/Service Deployment
        2. 5.1.7.2 Merger & Acquisitions
        3. 5.1.7.3 Joint Ventures
      8. 5.1.8 Major Players Financial Matrix
        1. 5.1.8.1 Sales and Operating Income
        2. 5.1.8.2 Major Players R&D Expenditure. 2023
    2. 5.2 Company Profiles
      1. 5.2.1 Pfizer Inc (US)
        1. 5.2.1.1 Financial Overview
        2. 5.2.1.2 Products Offered
        3. 5.2.1.3 Key Developments
        4. 5.2.1.4 SWOT Analysis
        5. 5.2.1.5 Key Strategies
      2. 5.2.2 Johnson & Johnson (US)
        1. 5.2.2.1 Financial Overview
        2. 5.2.2.2 Products Offered
        3. 5.2.2.3 Key Developments
        4. 5.2.2.4 SWOT Analysis
        5. 5.2.2.5 Key Strategies
      3. 5.2.3 Novartis AG (CH)
        1. 5.2.3.1 Financial Overview
        2. 5.2.3.2 Products Offered
        3. 5.2.3.3 Key Developments
        4. 5.2.3.4 SWOT Analysis
        5. 5.2.3.5 Key Strategies
      4. 5.2.4 Boehringer Ingelheim (DE)
        1. 5.2.4.1 Financial Overview
        2. 5.2.4.2 Products Offered
        3. 5.2.4.3 Key Developments
        4. 5.2.4.4 SWOT Analysis
        5. 5.2.4.5 Key Strategies
      5. 5.2.5 Eli Lilly and Company (US)
        1. 5.2.5.1 Financial Overview
        2. 5.2.5.2 Products Offered
        3. 5.2.5.3 Key Developments
        4. 5.2.5.4 SWOT Analysis
        5. 5.2.5.5 Key Strategies
      6. 5.2.6 AstraZeneca PLC (GB)
        1. 5.2.6.1 Financial Overview
        2. 5.2.6.2 Products Offered
        3. 5.2.6.3 Key Developments
        4. 5.2.6.4 SWOT Analysis
        5. 5.2.6.5 Key Strategies
      7. 5.2.7 Teva Pharmaceutical Industries Ltd (IL)
        1. 5.2.7.1 Financial Overview
        2. 5.2.7.2 Products Offered
        3. 5.2.7.3 Key Developments
        4. 5.2.7.4 SWOT Analysis
        5. 5.2.7.5 Key Strategies
      8. 5.2.8 GSK PLC (GB)
        1. 5.2.8.1 Financial Overview
        2. 5.2.8.2 Products Offered
        3. 5.2.8.3 Key Developments
        4. 5.2.8.4 SWOT Analysis
        5. 5.2.8.5 Key Strategies
      9. 5.2.9 AbbVie Inc (US)
        1. 5.2.9.1 Financial Overview
        2. 5.2.9.2 Products Offered
        3. 5.2.9.3 Key Developments
        4. 5.2.9.4 SWOT Analysis
        5. 5.2.9.5 Key Strategies
    3. 5.3 Appendix
      1. 5.3.1 References
      2. 5.3.2 Related Reports
  6. 6 LIST OF FIGURES
    1. 6.1 MARKET SYNOPSIS
    2. 6.2 GERMANY MARKET ANALYSIS BY TYPE OF NEUROPATHIC PAIN
    3. 6.3 GERMANY MARKET ANALYSIS BY TREATMENT TYPE
    4. 6.4 GERMANY MARKET ANALYSIS BY ROUTE OF ADMINISTRATION
    5. 6.5 GERMANY MARKET ANALYSIS BY END USER
    6. 6.6 KEY BUYING CRITERIA OF CHEMICALS AND MATERIALS
    7. 6.7 RESEARCH PROCESS OF MRFR
    8. 6.8 DRO ANALYSIS OF CHEMICALS AND MATERIALS
    9. 6.9 DRIVERS IMPACT ANALYSIS: CHEMICALS AND MATERIALS
    10. 6.10 RESTRAINTS IMPACT ANALYSIS: CHEMICALS AND MATERIALS
    11. 6.11 SUPPLY / VALUE CHAIN: CHEMICALS AND MATERIALS
    12. 6.12 CHEMICALS AND MATERIALS, BY TYPE OF NEUROPATHIC PAIN, 2024 (% SHARE)
    13. 6.13 CHEMICALS AND MATERIALS, BY TYPE OF NEUROPATHIC PAIN, 2024 TO 2035 (USD Million)
    14. 6.14 CHEMICALS AND MATERIALS, BY TREATMENT TYPE, 2024 (% SHARE)
    15. 6.15 CHEMICALS AND MATERIALS, BY TREATMENT TYPE, 2024 TO 2035 (USD Million)
    16. 6.16 CHEMICALS AND MATERIALS, BY ROUTE OF ADMINISTRATION, 2024 (% SHARE)
    17. 6.17 CHEMICALS AND MATERIALS, BY ROUTE OF ADMINISTRATION, 2024 TO 2035 (USD Million)
    18. 6.18 CHEMICALS AND MATERIALS, BY END USER, 2024 (% SHARE)
    19. 6.19 CHEMICALS AND MATERIALS, BY END USER, 2024 TO 2035 (USD Million)
    20. 6.20 BENCHMARKING OF MAJOR COMPETITORS
  7. 7 LIST OF TABLES
    1. 7.1 LIST OF ASSUMPTIONS
  8. 7.1.1
    1. 7.2 Germany MARKET SIZE ESTIMATES; FORECAST
      1. 7.2.1 BY TYPE OF NEUROPATHIC PAIN, 2025-2035 (USD Million)
      2. 7.2.2 BY TREATMENT TYPE, 2025-2035 (USD Million)
      3. 7.2.3 BY ROUTE OF ADMINISTRATION, 2025-2035 (USD Million)
      4. 7.2.4 BY END USER, 2025-2035 (USD Million)
    2. 7.3 PRODUCT LAUNCH/PRODUCT DEVELOPMENT/APPROVAL
  9. 7.3.1
    1. 7.4 ACQUISITION/PARTNERSHIP
  10. 7.4.1

Germany Chemicals and Materials Market Segmentation

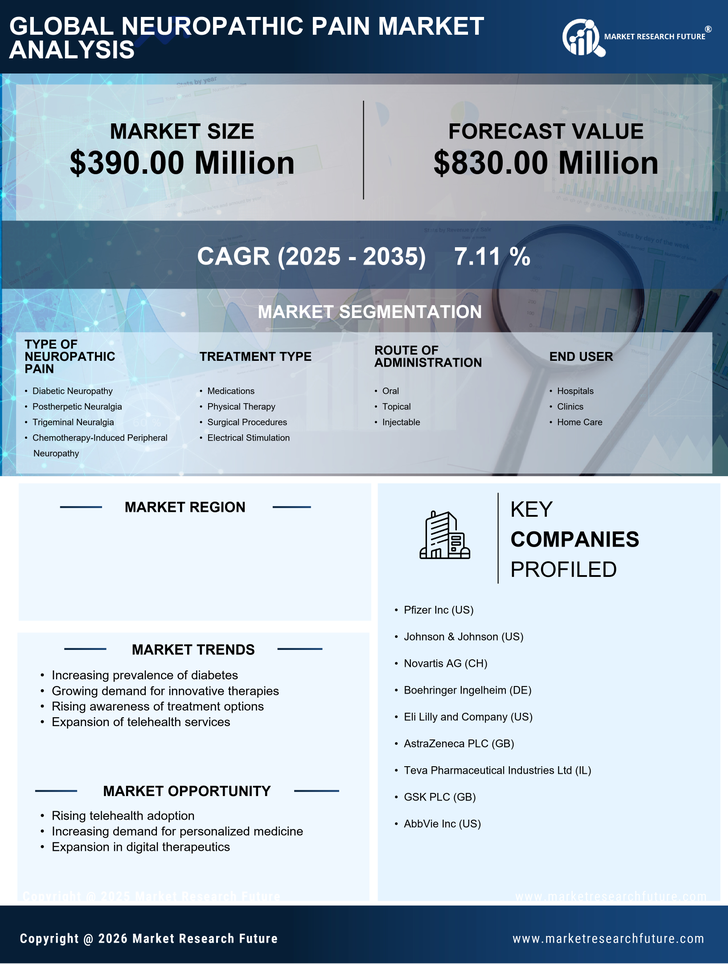
Chemicals and Materials By Type of Neuropathic Pain (USD Million, 2025-2035)

  • Diabetic Neuropathy
  • Postherpetic Neuralgia
  • Trigeminal Neuralgia
  • Chemotherapy-Induced Peripheral Neuropathy

Chemicals and Materials By Treatment Type (USD Million, 2025-2035)

  • Medications
  • Physical Therapy
  • Surgical Procedures
  • Electrical Stimulation

Chemicals and Materials By Route of Administration (USD Million, 2025-2035)

  • Oral
  • Topical
  • Injectable

Chemicals and Materials By End User (USD Million, 2025-2035)

  • Hospitals
  • Clinics
  • Home Care