Segmentation Quick Reference
| Dimension | Sub-Segments | Dominant Segment | Fastest Growing Segment |
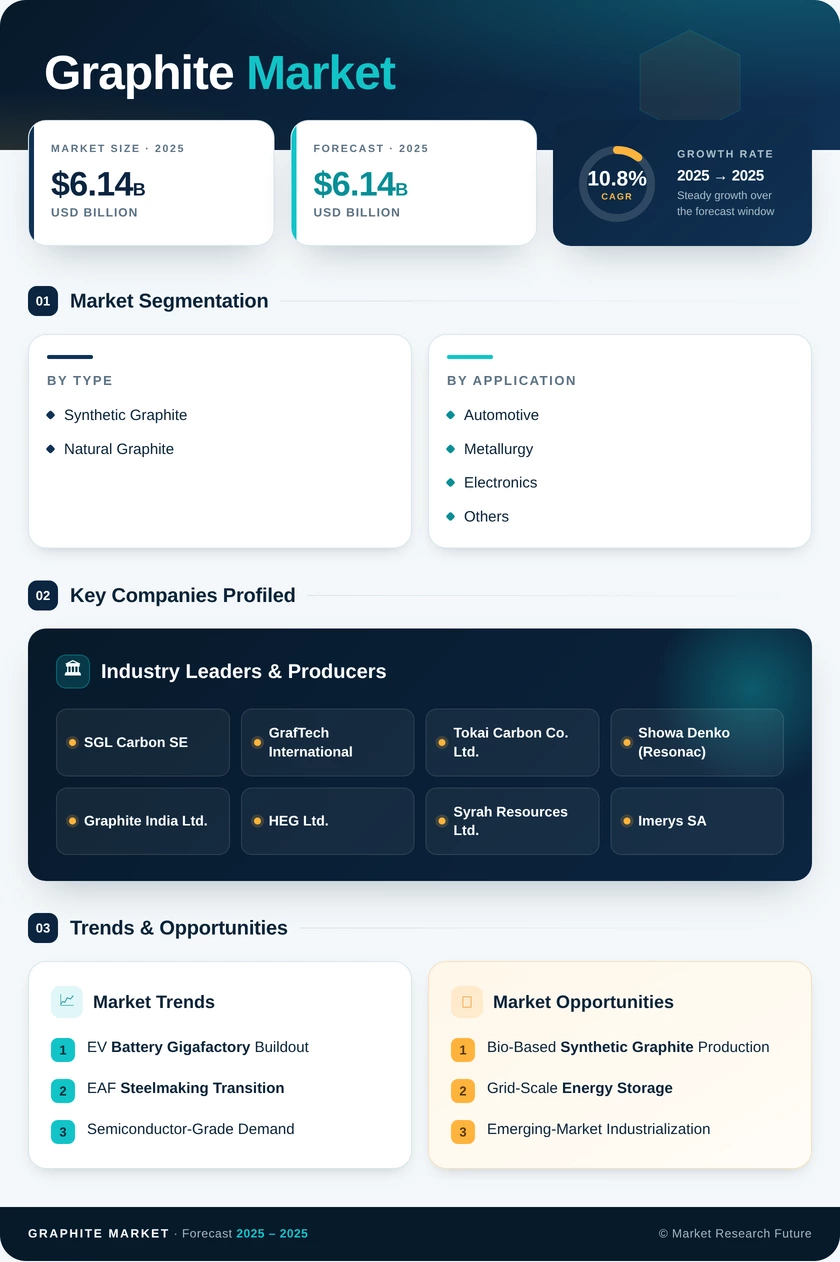
| By Type | Natural Graphite, Synthetic Graphite | Synthetic Graphite (63.5% share, 2025) | Natural Graphite (CAGR 13.3%) |
| By Application | Electrodes, Refractories/Casting/Foundries, Graphite Market, Lubricants, Other Applications | Graphite Market (44.2% share, 2025) | Graphite Market (CAGR 19.3%) |
| By End-User Industry | Metallurgy, Electronics, Automotive, Others | Automotive (47.2% share, 2025) | Automotive (CAGR 18.3%) |
| By Geography | Asia-Pacific, North America, Europe, South America, Middle East & Africa | Asia-Pacific (51.5% share, 2025) | Asia-Pacific (CAGR 12.3%) |
Market Segmentation Overview
By Type
| Sub-Segment | Key Trend |
| Natural Graphite | Rising adoption in cost-sensitive LFP battery anode materials; mine-to-anode integration in North America and Africa |
| Synthetic Graphite | Dominant in graphite electrodes for EAF steel and high purity graphite for semiconductors; bio-based production emerging |
Natural graphite and synthetic graphite represent the two foundational pillars of the Graphite Market. Synthetic graphite retains the larger share due to its controllable properties and essential role in electrode and semiconductor applications, while natural graphite is growing faster as battery cell makers seek lower-cost anode feedstock alternatives.
By Application
| Sub-Segment | Key Trend |
| Electrodes | EAF steelmaking transition drives sustained graphite electrode replacement demand globally |
| Refractories / Casting / Foundries | Steady consumption of refractory graphite materials in metal casting and glass manufacturing |
| Graphite Market | Lithium ion battery graphite anode scaling is the primary growth engine for the Graphite Market |
| Lubricants | High-temperature industrial lubrication applications leverage conductive carbon materials properties |
| Other Applications | Nuclear moderators, pencil production, and specialty sealing components |
Graphite Market dominate the application landscape and will continue to absorb the largest incremental volumes of both natural graphite and synthetic graphite through 2035. Electrodes represent the most mature application segment, anchored by the structural shift toward EAF steelmaking across Europe and North America.
By End-User Industry
| Sub-Segment | Key Trend |
| Metallurgy | EAF capacity expansion sustains demand for graphite electrodes and refractory graphite materials |
| Electronics | Semiconductor fabrication growth drives demand for high purity graphite crucibles and susceptors |
| Automotive | EV production ramp creates dominant offtake channel for battery anode materials |
| Others | Aerospace, energy storage, and defense applications for specialty industrial graphite products |
Automotive end users account for nearly half of Graphite Market revenue, a position that will strengthen as EV penetration rates climb globally. Electronics represents the highest-value niche, with semiconductor-grade carbon based materials commanding significant price premiums over commodity grades.