Graphite Market

Key Players: SGL Carbon SE, GrafTech International, Tokai Carbon Co. Ltd., Showa Denko (Resonac), Graphite India Ltd., HEG Ltd., Syrah Resources Ltd., Imerys SA

Graphite Market

Graphite Market Research Report By Application (Batteries, Lubricants, Refractories, Electronics, Composite Materials), By Type (Natural Graphite, Synthetic Graphite, Amorphous Graphite, Graphite Foil, Graphite Powder), By End Use Industry (Automotive, Aerospace, Energy, Electronics, Construction), By Form (Flake Graphite, Micronized Graphite, Expanded Graphite, Graphite Granules) and By Regional (North America, Europe, South America, Asia Pacific, Middle East and Africa) - Forecast to 2035
ID: MRFR/CnM/0354-CR
111 Pages
Chitranshi Jaiswal
Last Updated: June 12, 2026
 

Graphite Market Summary

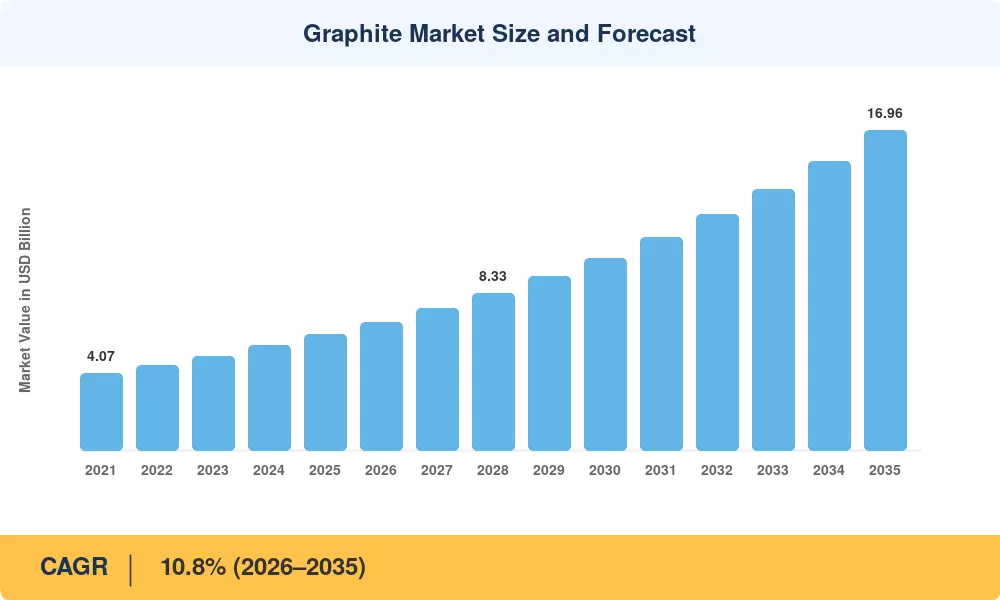
The global Graphite Market reached an estimated USD 6.14 Billion in 2025 and is positioned to grow from USD 6.74 Billion in 2026 to USD 16.96 Billion by 2035, registering a CAGR of 10.8% across the forecast period. This expansion is anchored in record capital commitments to lithium ion battery gigafactories — the U.S. Department of Energy alone channeled over USD 3.1 Billion into battery material supply chains through the Bipartisan Infrastructure Law, while Europe's Critical Raw Materials Act designated graphite as strategic, unlocking preferential permitting for new processing hubs[2].

A generational technology shift is reshaping the Graphite Market from the supply side. Legacy blast-furnace steelmaking is yielding ground to electric-arc-furnace (EAF) routes that consume graphite electrodes at roughly three times the intensity per ton of steel. Simultaneously, battery anode materials producers are integrating mine-to-anode operations to reduce dependence on third-party synthetic graphite toll-processors, with over USD 1.9 Billion in capacity announcements across North America and Europe during 2024–2025 [3][4].

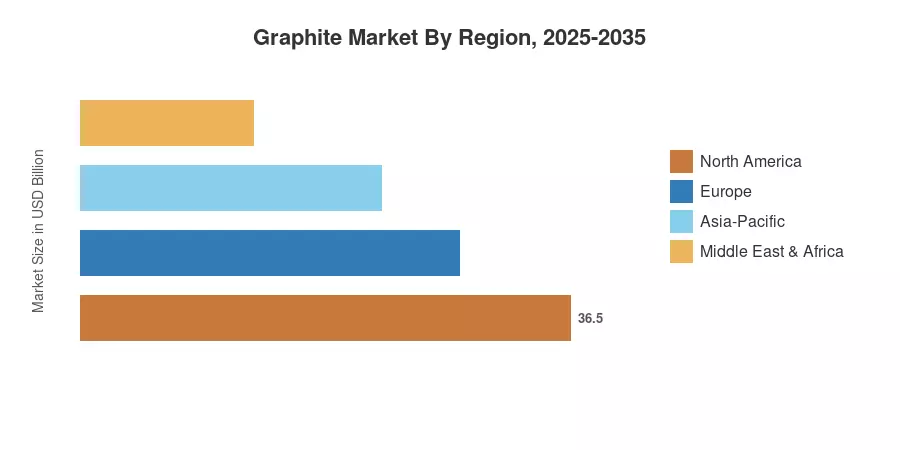
Asia-Pacific commands roughly 51.5% of global revenue, led by China's dominance in natural graphite mining and anode processing. The region also posts the fastest CAGR at 12.3% through 2035. North America ranks as the second-largest contributor with an 18% share, driven by reshoring incentives under the Inflation Reduction Act. Europe follows closely at 20%, propelled by EV battery localization mandates. The Graphite Market trajectory points to a decisive decade of geographic diversification and demand intensification [5].


Key Report Takeaways

• By Type

  • Synthetic graphite captured 63.5% of the Graphite Market in 2025, reflecting strong demand from EAF steelmaking and high purity graphite applications in semiconductors
  • Natural graphite is projected to expand at a 13.3% CAGR through 2035, fueled by cost-competitive battery anode materials sourcing

• By Application

  • Batteries accounted for 44.2% of Graphite Market revenue in 2025, as lithium ion battery graphite consumption scaled alongside global gigafactory buildouts
  • Graphite electrodes remain the second-largest application segment, underpinned by accelerating EAF steel capacity additions worldwide

• By End-User Industry

  • Automotive held the largest share of the Graphite Market at 47.2% in 2025, reflecting the EV production ramp across major OEMs
  • Electronics end users are advancing at a CAGR of 14.6%, tied to rising semiconductor wafer demand for high purity graphite components

• By Region

  • Asia-Pacific controlled 51.5% of the Graphite Market in 2025
  • North America is attracting USD 1.9 Billion in new graphite processing investments through 2027


Market Size and Forecast (2021–2035)

MRFR's proprietary estimation framework combines primary industry interviews, trade data reconciliation, and bottom-up demand modeling validated against public company disclosures and government production statistics.

Graphite Market Size and Forecast
Our Impact
Enabled $4.3B Revenue Impact for Fortune 500 and Leading Multinationals
Partnering with 2000+ Global Organizations Each Year
30K+ Citations by Top-Tier Firms in the Industry
 

Driver Impact Analysis

Driver ~% Impact on CAGR Geographic Relevance Impact Timeline
EV battery gigafactory buildout ~28% Global Short-term (≤2 yr)
EAF steelmaking transition ~20% Europe, North America Medium-term (2–4 yr)
Semiconductor demand for high purity graphite ~12% Asia-Pacific, North America Medium-term (2–4 yr)
Supply-chain reshoring policies ~15% North America, Europe Short-term (≤2 yr)
Grid-scale energy storage expansion ~10% Global Long-term (≥4 yr)
Emerging-market industrialization ~8% South America, MEA, India Long-term (≥4 yr)
Nuclear graphite demand resurgence ~7% Europe, Asia-Pacific Long-term (≥4 yr)


EV Battery Gigafactory Buildout

Global announced lithium ion battery manufacturing capacity exceeded 9,000 GWh by late 2024, per BloombergNEF tracking, with over 60% of projects requiring battery anode materials derived from either natural graphite or synthetic graphite [2]. The U.S. Inflation Reduction Act's 10% advanced manufacturing production credit for electrode-active materials has redirected approximately USD 7 Billion in planned anode investments to North American sites since 2023, directly lifting the Graphite Market across the value chain [3].

EAF Steelmaking Transition

The European Green Deal's carbon border adjustment mechanism (CBAM) is accelerating steelmakers' shift to EAF routes, which consume graphite electrodes at 1.5–2.0 kg per ton of crude steel versus near zero in basic oxygen furnaces. ArcelorMittal, Thyssenkrupp, and Tata Steel Europe collectively announced over 15 Mt of new EAF capacity between 2024 and 2028, representing an incremental demand uplift of roughly 25,000 tons annually for industrial graphite products [9].

Semiconductor-Grade Demand

The CHIPS and Science Act allocated USD 52.7 Billion to domestic semiconductor fabrication, with wafer-processing furnace components requiring high purity graphite susceptors, crucibles, and heating elements rated at 99.99%+ carbon content. Demand from this segment alone is expected to grow at 14% annually through 2030, creating a premium-price pocket within the broader Graphite Market [10].

Supply-Chain Reshoring Policies

China's December 2023 export-licence requirements for natural graphite products prompted a strategic recalibration. By mid-2025, North American and European governments had approved over USD 1.9 Billion in grants and loan guarantees targeting graphite mining, spheronization, and coating capacity — a direct supply-security response that adds structural demand for domestically sourced carbon based materials [4][7].


Restraints Impact Analysis

Restraint impacts are directional estimates of growth drag; they do not subtract directly from the headline CAGR.

Restraint ~% Drag on CAGR Geographic Relevance Impact Timeline
Silicon-anode substitution risk ~−12% Global Medium-term (2–4 yr)
Needle-coke feedstock volatility ~−10% Global Short-term (≤2 yr)
Environmental permitting delays ~−8% North America, Europe Medium-term (2–4 yr)
Chinese export-policy uncertainty ~−7% Asia-Pacific Short-term (≤2 yr)
Recycled graphite supply cannibalization ~−5% Europe Long-term (≥4 yr)


Silicon-Anode Substitution

Next-generation battery chemistries blending silicon into the anode at 10–30 wt% can reduce graphite loading per cell by up to 25%. Tesla, Samsung SDI, and Sila Nanotechnologies have each disclosed silicon-composite anode roadmaps targeting commercial deployment by 2027, which could trim graphite intensity in premium EVs. However, cost parity remains elusive — silicon anode pre-lithiation adds roughly USD 4–6/kWh to cell cost — limiting near-term penetration to high-performance segments rather than mainstream lithium ion battery graphite demand [16].

Needle-Coke Feedstock Volatility

Synthetic graphite production depends on petroleum- or coal-tar-derived needle coke, a commodity whose supply is concentrated among fewer than 10 global producers. Spot prices surged 40% during the 2022–2023 cycle, compressing margins for graphite electrode manufacturers and raising input costs across the synthetic graphite value chain. Prolonged coke tightness could slow capacity additions for refractory graphite materials and specialty carbon products [3].

Environmental Permitting Delays

Greenfield graphite mining projects in Canada, Mozambique, and Tanzania face permitting timelines averaging 7–10 years. Environmental impact assessments for natural graphite operations now increasingly require full lifecycle carbon accounting, water-use modeling, and community benefit agreements, adding 18–24 months to project schedules and deferring new supply that the Graphite Market urgently needs [17].


Graphite Market Opportunities

Bio-Based Synthetic Graphite Production

Biomass pyrolysis to carbon-negative synthetic graphite is progressing rapidly. Companies such as Vianode (Norway) and Novonix (Australia/Canada) have shown pilot-scale output with energy intensities 40% below typical Acheson-furnace techniques, creating a premium conductive carbon materials sector for ESG-sensitive battery OEMs [11].


Grid-Scale Energy Storage

The IEA forecasts that stationary lithium-iron-phosphate (LFP) batteries for grid storage will be deployed at a rate of 1,200 GWh per year by 2032. LFP cells use 100% graphite anodes, with no nickel or cobalt, offering a dedicated high-volume offtake channel for battery anode materials producers looking to develop beyond automotive [14].


Emerging-Market Industrialization

India’s National Mineral Policy 2025 amendment designates graphite as an important mineral, opening up exploration licences across Jharkhand, Odisha and Tamil Nadu. At the same time, Brazil´s growing EAF steel sector and increasing foundry base are creating demand for refractory graphite materials and industrial graphite products, offering opportunities for greenfield investments [12].


Recycled-Graphite Circular Economy

Business models for urban mining of anode graphite from end-of-life EV batteries are gaining popularity. Redwood Materials and Li-Cycle introduced lines of recycled graphite with purities reaching 99.95% and with cost reductions of 20-30% vs virgin synthetic graphite. This establishes a new revenue pool in the Graphite Market and meets ESG standards [13].


Nuclear Energy Renaissance

Small modular reactor (SMR) designs from companies such as X-energy and Kairos Power use graphite as a neutron moderator, requiring high purity graphite billets machined to exacting tolerances. With over 80 SMR projects globally in licensing or construction as of 2025, nuclear applications present a durable niche demand stream for carbon based materials [15].


Graphite Market Future Outlook

Electrification Supercycle and Battery Demand

The IEA projects global EV sales will surpass 45 million units annually by 2030, with each vehicle consuming 50–100 kg of battery anode materials depending on chemistry. This electrification wave ensures that the Graphite Market's single-largest demand vertical — lithium ion battery anodes — will sustain double-digit growth well into the 2030s, even as silicon blending modestly trims per-cell graphite intensity [2][14].

AI-Driven Process Optimization

Advanced analytics and machine learning are entering graphite processing operations, optimizing Acheson furnace thermal profiles, purification yields, and particle-size distributions. Pilot deployments at synthetic graphite plants in China and Germany have demonstrated 12–15% energy-cost reductions, which will become critical as decarbonization regulations raise the cost of carbon-intensive manufacturing [10].

ESG and Sustainability Reporting

Scope 3 emissions disclosure under ISSB and EU CSRD frameworks will force battery OEMs to map graphite supply chains end to end. Producers offering verified low-carbon natural graphite or bio-sourced synthetic graphite will command premium pricing, creating a bifurcated Graphite Market with distinct ESG and commodity tiers [11][13].

Platform Economics and Vertical Integration

Major anode producers — POSCO Future M, BTR New Material, Shanshan Technology — are vertically integrating from mine ownership through coating and formation to direct cell-maker supply. This platform model compresses margins for independent toll processors but consolidates customer relationships, reshaping the competitive structure of the Graphite Market for the next decade.


Graphite Market Segmentation

By Type

Segment Key Metric Primary Demand Driver
Synthetic Graphite 63.5% share (2025) Graphite electrodes for EAF steel and conductive carbon materials
Natural Graphite CAGR 13.3% (2026–2035) Battery anode materials and refractory graphite materials


Synthetic graphite dominates the Graphite Market because it offers tailored purity, crystallinity, and particle morphology that natural alternatives cannot match without extensive downstream processing. EAF steel production consumes ultra-high-power graphite electrodes manufactured exclusively from synthetic precursors, while semiconductor applications demand high purity graphite at 99.99%+ grades achievable only through synthetic routes.

Natural graphite, however, is gaining share as battery anode materials producers adopt spheronized flake graphite coated with amorphous carbon — a process that delivers comparable electrochemical performance to synthetic anodes at roughly 40% lower cost. The proliferation of cost-sensitive LFP battery chemistries, which pair exclusively with graphite-dominant anodes, reinforces natural graphite's growth trajectory across the Graphite Market.

By Application

Segment Key Metric Primary Demand Driver
Batteries 44.2% share (2025) Lithium ion battery graphite anode scaling
Electrodes USD 1.42 Billion (2025) EAF steelmaking capacity additions
Refractories / Casting / Foundries CAGR 8.2% Industrial graphite products for metal casting
Lubricants 8.0% share (2025) High-temperature conductive carbon materials for machinery
Other Applications CAGR 7.5% Nuclear moderators, pencil cores, specialty seals


Batteries stand as the fastest-expanding application within the Graphite Market, propelled by the sheer scale of lithium ion battery manufacturing commitments. Each GWh of cell capacity requires approximately 800–1,100 tons of anode graphite, creating a linear relationship between gigafactory commissioning schedules and raw-material offtake.

Graphite electrodes rank second, with the global EAF steel share projected to exceed 50% by 2030. Each ton of EAF steel consumes 1.5–2.0 kg of electrode material, and the shift toward larger-diameter ultra-high-power electrodes raises the quality threshold — favoring producers of premium synthetic graphite with low coefficient-of-thermal-expansion specifications.

By End-User Industry

Segment Key Metric Primary Demand Driver
Automotive 47.2% share (2025) EV production scaling requiring battery anode materials
Metallurgy CAGR 8.9% EAF transition lifting graphite electrodes consumption
Electronics USD 0.97 Billion (2025) Semiconductor-grade high purity graphite components
Others 9.8% share (2025) Aerospace, energy, defense applications


The automotive industry's gravitational pull on the Graphite Market intensifies each year as global OEMs scale EV production lines. Volkswagen, BYD, Tesla, and Hyundai collectively plan over 500 GWh of in-house and contracted cell capacity by 2030, each gigawatt-hour translating to sustained lithium ion battery graphite procurement contracts.


Regional Market Share Analysis

Region Key Metric Primary Investment Themes
Asia-Pacific 51.5% share (2025) Battery anode materials processing, EAF steel expansion
Europe 20.0% share (2025) CRM Act localization, synthetic graphite capacity
North America 18.0% share (2025) IRA-driven reshoring, graphite electrodes supply security
South America 5.5% share (2025) Natural graphite mining, foundry-grade materials
Middle East & Africa 5.0% share (2025) Mining concession development, industrial diversification
Total 100%

The Graphite Market displays significant regional asymmetry, with Asia-Pacific dominating production and consumption while North America and Europe accelerate processing capacity investments.


North America

Country Key Metric Key Driver
US CAGR 11.9% IRA manufacturing credits for battery anode materials
Canada USD 0.38 Billion (2025) New graphite mine commissioning in Quebec and Ontario
Mexico CAGR 9.4% Nearshoring of industrial graphite products assembly


The U.S. accounts for the bulk of North American demand, with the DOE's Loan Programs Office backing four graphite processing facilities totaling 150,000 tpa of coated spherical graphite capacity by 2028. Canada's Nouveau Monde Graphite and Northern Graphite are constructing integrated mine-to-anode operations in Quebec, positioning the country as a critical non-Chinese source of natural graphite for the North American Graphite Market [8].

Europe

Country Key Metric Key Driver
Germany 28% of regional share EAF steel transition and EV battery cell production
UK CAGR 10.2% Specialty conductive carbon materials for electronics
France USD 0.18 Billion (2025) Nuclear-grade high purity graphite demand
Italy CAGR 9.1% Foundry and refractory graphite materials consumption
Spain 6% of regional share Emerging lithium ion battery cell assembly
Nordic Countries CAGR 12.8% Bio-based synthetic graphite pilot facilities
Russia USD 0.11 Billion (2025) Legacy electrode production for domestic steel
Rest of Europe 14% of regional share Diversified industrial demand


Europe's Graphite Market benefits from the EU Critical Raw Materials Act mandating that 40% of strategic material processing occur domestically by 2030. Vianode's Norwegian anode facility and SGL Carbon's expansions in Germany anchor the region's synthetic graphite ambitions, while Imerys' Lautaret project in France targets 34,000 tpa of natural graphite concentrate [7].

Asia-Pacific

Country Key Metric Key Driver
China 62% of regional share Integrated anode supply chain, largest global producer
India CAGR 14.5% Critical mineral policy and graphite electrodes demand
Japan USD 0.41 Billion (2025) Advanced synthetic graphite for semiconductors
South Korea CAGR 13.1% Battery anode materials for domestic cell makers
ASEAN 7% of regional share Expanding steel and foundry sectors
Rest of Asia-Pacific CAGR 10.4% Resource exploration and industrial growth


China processes over 90% of the world's spherical graphite for battery anodes, a concentration that governments elsewhere are actively working to dilute. Japan's Tokai Carbon and Nippon Carbon supply premium high purity graphite to the semiconductor and nuclear sectors, while South Korea's POSCO Future M and SK On are scaling domestic anode coating lines to reduce reliance on Chinese imports. The Graphite Market in Asia-Pacific remains the anchor of global supply chains despite diversification efforts [5].

South America

Country Key Metric Key Driver
Brazil 65% of regional share Natural graphite mining and EAF foundry demand
Argentina CAGR 9.8% Emerging battery material exploration
Rest of South America USD 0.06 Billion (2025) Early-stage graphite deposit assessment


Brazil holds significant flake natural graphite reserves in Minas Gerais and Bahia, with rising EAF steel output adding incremental demand for graphite electrodes. The Graphite Market across South America remains nascent but is gaining investor attention as supply-chain diversification pressures intensify [12].

Middle East & Africa

Country Key Metric Key Driver
South Africa 38% of regional share Established graphite mining operations
UAE CAGR 8.7% Industrial diversification into carbon based materials
Saudi Arabia USD 0.04 Billion (2025) Vision 2030 manufacturing base development
Egypt CAGR 7.9% Foundry sector expansion
Rest of MEA 22% of regional share Mozambique and Tanzania mining concessions


Mozambique's Balama mine (operated by Syrah Resources) is the largest integrated natural graphite operation outside China, supplying feedstock to Syrah's Vidalia active-anode-material plant in Louisiana. Tanzania's graphite deposits in the Lindi region represent additional untapped reserves that could reshape the Graphite Market supply picture in the MEA corridor [17].


Graphite Market By Region, 2025-2035
 

Competitive Benchmarking

The Graphite Market exhibits medium concentration, with the top five players accounting for an estimated 35–42% of global revenue. A moderate Herfindahl-Hirschman Index reflects a mix of vertically integrated conglomerates and specialized mid-tier producers competing across distinct value-chain segments — mining, processing, electrode manufacturing, and anode conversion.

Company Est. Revenue Share Range Key Offerings for Graphite Market Strategic Positioning
SGL Carbon SE ~7–10% Graphite electrodes, specialty carbon components Vertically integrated European leader in synthetic graphite
GrafTech International ~6–9% Ultra-high-power graphite electrodes Needle-coke-to-electrode integration via Seadrift facility
Tokai Carbon Co. Ltd. ~5–8% Graphite electrodes, fine carbon, high purity graphite Diversified portfolio spanning steel and semiconductor sectors
Showa Denko (Resonac) ~5–7% Synthetic graphite, battery anode materials Japanese conglomerate pivoting toward EV supply chains
Graphite India Ltd. ~4–7% Graphite electrodes, industrial graphite products Low-cost Indian manufacturer with global export reach
HEG Ltd. ~3–6% Ultra-high-power electrodes, refractory graphite materials Captive power advantage in Madhya Pradesh operations
Syrah Resources Ltd. ~3–5% Natural graphite mining and active anode material Mine-to-anode integration (Balama–Vidalia corridor)
Imerys SA ~2–4% Natural graphite, conductive carbon materials European mine-to-market strategy (Lautaret project)
BTR New Material Group ~4–7% Battery anode materials, synthetic graphite China's largest anode producer by volume
Mersen SA ~2–4% High purity graphite components, specialty carbon Niche focus on semiconductor and chemical-processing equipment


Recent News & Developments

  • Syrah Resources (March 2025): Completed Phase 2 expansion at Vidalia, Louisiana, bringing active anode material capacity to 11,250 tpa — the first large-scale non-Chinese natural graphite anode plant in North America [8].


  • Nouveau Monde Graphite (November 2024): Secured CAD 260 million in federal and provincial financing for its Matawinie mine and Bécancour anode facility in Quebec, Canada [8].
  • European Commission (September 2024): Published the Critical Raw Materials Act implementing regulations, classifying graphite among 34 strategic materials requiring 40% domestic processing by 2030 [7].
  • BTR New Material (July 2024): Commissioned a 200,000 tpa synthetic graphite anode line in Inner Mongolia, reinforcing China's battery anode materials production lead.
  • U.S. Department of Energy (April 2024): Awarded USD 150 million in grants under the Battery Materials Processing program to three graphite spheronization startups in Tennessee and Georgia [2].
  • Vianode AS (February 2024): Broke ground on its 20,000 tpa bio-based synthetic graphite plant near Herøya, Norway, targeting carbon-negative anode production [11].


Graphite Market Report Scope

Parameter Detail
Market Scope Global Graphite Market — natural graphite, synthetic graphite, battery anode materials, graphite electrodes, refractory graphite materials, conductive carbon materials, high purity graphite
Study Period 2021–2035
CAGR (Forecast) 10.8% (2026–2035)
Base Year Market Size USD 6.14 Billion (2025)
Forecast Endpoint USD 16.96 Billion (2035)
Fastest Growing Segment Natural graphite (by type); Batteries (by application); Automotive (by end-user)
Companies Profiled SGL Carbon, GrafTech, Tokai Carbon, Resonac, Graphite India, HEG, Syrah Resources, Imerys, BTR New Material, Mersen
Valuation Currency USD Billion
CAGR Driver Disclaimer Impact percentages in Sections 4–5 are directional and not additive to headline CAGR


FAQs

What purity levels distinguish battery-grade from electrode-grade graphite?

Battery-grade spherical graphite requires ≥99.95% carbon purity after chemical purification, while electrode-grade synthetic graphite typically operates at 99.5–99.8% purity. The purification cost gap makes battery anode materials roughly 2–3× more expensive per ton [19].

How do long-term offtake contracts affect pricing in the Graphite Market?

Most battery anode materials contracts now lock pricing for 3–5 years with quarterly index adjustments, shielding buyers from spot volatility. Electrode contracts follow a similar structure but benchmark against needle-coke indices [3].

What role does particle morphology play in anode performance?

Spheronized natural graphite with a D50 of 15–18 µm maximizes tap density and first-cycle coulombic efficiency in lithium ion battery cells. Synthetic graphite allows broader morphology tuning but at higher energy cost.

Which Graphite Market segment is most exposed to trade-policy disruption?

Natural graphite mining and processing face the highest exposure because China controls over 65% of global flake-graphite output and over 90% of spheronization capacity [4].

Can recycled graphite meet OEM quality specifications for the Graphite Market?

Recycled anode graphite from end-of-life batteries currently achieves 99.95% purity and comparable cycling performance, though supply volumes remain below 3% of virgin demand [13].

How does the EAF steel transition affect graphite electrode replacement cycles?

EAF operations consume graphite electrodes continuously, with replacement cycles averaging 8–12 heats per electrode set depending on furnace power rating and scrap quality [9].

What distinguishes isostatic-pressed graphite from extruded grades in the Graphite Market?

Isostatic pressing produces near-isotropic high purity graphite with uniform grain structure suited for semiconductor and nuclear uses, while extruded grades serve lower-cost industrial graphite products applications.


Author
Author
Author Profile
Chitranshi Jaiswal LinkedIn
Team Lead - Research
Chitranshi is a Team Leader in the Chemicals & Materials (CnM) and Energy & Power (EnP) domains, with 6+ years of experience in market research. She leads and mentors teams to deliver cross-domain projects that equip clients with actionable insights and growth strategies. She is skilled in market estimation, forecasting, competitive benchmarking, and both primary & secondary research, enabling her to turn complex data into decision-ready insights. An engineer and MBA professional, she combines technical expertise with strategic acumen to solve dynamic market challenges. Chitranshi has successfully managed projects that support market entry, investment planning, and competitive positioning, while building strong client relationships. Certified in Advanced Excel & Power BI she leverages data-driven approaches to ensure accuracy, clarity, and impactful outcomes.

Research Approach


Secondary Research

The secondary research process involved comprehensive analysis of regulatory databases, peer-reviewed materials science journals, industry publications, and authoritative geological/mining organizations. Key sources included the US Geological Survey (USGS) Mineral Commodity Summaries, European Commission's Raw Materials Information System (RMIS), British Geological Survey (BGS) World Mineral Statistics, Australian Bureau of Statistics (ABS) Mineral & Petroleum Exploration, Natural Resources Canada (NRCan) Mineral Statistics, China Ministry of Natural Resources Mineral Reserves Data, Indian Bureau of Mines (IBM) Mineral Yearbook, International Energy Agency (IEA) Critical Minerals Market Review, International Monetary Fund (IMF) Commodity Price Statistics, World Bank Commodity Markets Outlook, United Nations Comtrade Database, OECD Raw Materials Database, European Battery Alliance (EBA) Reports, US Department of Energy (DOE) Critical Materials Institute, National Institute of Standards and Technology (NIST) Material Measurement Laboratory, American Society for Testing and Materials (ASTM) International Standards, International Organization for Standardization (ISO) Technical Committee on Graphite, Battery University Research Consortium, International Graphite Association (IGA) Industry Reports, and national mining ministry reports from key graphite-producing jurisdictions (Mozambique, Madagascar, Brazil, Tanzania). These sources were used to collect mineral reserve statistics, production & trade data, battery demand forecasts, pricing trends, regulatory frameworks for mining operations, and technological developments in spherical graphite processing for lithium-ion battery anodes.


Primary Research

Qualitative and quantitative insights were obtained by interviewing supply-side and demand-side stakeholders during the primary research process. The supply-side sources consisted of CEOs, VPs of Operations, mine site managers, and administrators of graphite processing facilities from natural graphite mining companies and synthetic graphite manufacturers. Demand-side sources included procurement leaders from battery cell manufacturers, refractory product engineers, lubricant formulators, and R&D directors from electric vehicle OEMs, energy storage system integrators, and industrial applications sectors. Primary research has confirmed the timelines for the expansion of spherical graphite projects, validated market segmentation between natural flake/amorphous/vein graphite and synthetic graphite, and collected insights on anode material specifications, long-term offtake agreements, and supply chain localization strategies.

Primary Respondent Breakdown:

By Designation: C-level Primaries (28%), Director Level (34%), Others (38%)

By Region: North America (28%), Europe (32%), Asia-Pacific (34%), Rest of World (6%)


Market Size Estimation

Global market valuation was derived through production volume mapping and price analysis across natural and synthetic graphite categories. The methodology included:

Identification of over 55 significant producers in China, Mozambique, Madagascar, Brazil, Canada, India, and emerging African jurisdictions

Product mapping across natural flake graphite (large/jumbo/fine), amorphous graphite, vein/lump graphite, and synthetic graphite (isotropic/extruded/molded)

Analysis of reported and modeled annual revenues specific to graphite mining and processing operations, including spherical graphite and expandable graphite value-added products

Coverage of producers representing 75-80% of global natural graphite supply and 85-90% of synthetic graphite capacity in 2024

Extrapolation using bottom-up (production volume × realized price by graphite grade and region) and top-down (producer revenue validation) approaches to derive segment-specific valuations, with separate modeling for battery-grade spherical graphite premium pricing versus traditional industrial applications

Download Free Sample

Kindly complete the form below to receive a free sample of this Report

Download PDF ×

We do not share your information with anyone. However, we may send you emails based on your report interest from time to time. You may contact us at any time to opt-out.