Green Cement Market

Key Players: Holcim Group, Heidelberg Materials, CEMEX S.A.B., CRH plc, Anhui Conch Cement, UltraTech Cement, Dalmia Bharat, Hoffmann Green Cement

Green Cement Market

Green Cement Market Research Report Information By Product Type (Fly Ash based, Slag based, Geopolymer, Others), By Application (Residential, Non-Residential), And By Region (North America, Europe, Asia-Pacific, And Rest Of The World) – Market Forecast Till 2035.
ID: MRFR/CnM/2131-HCR
111 Pages
Chitranshi Jaiswal
Last Updated: June 22, 2026

Green Cement Market Summary

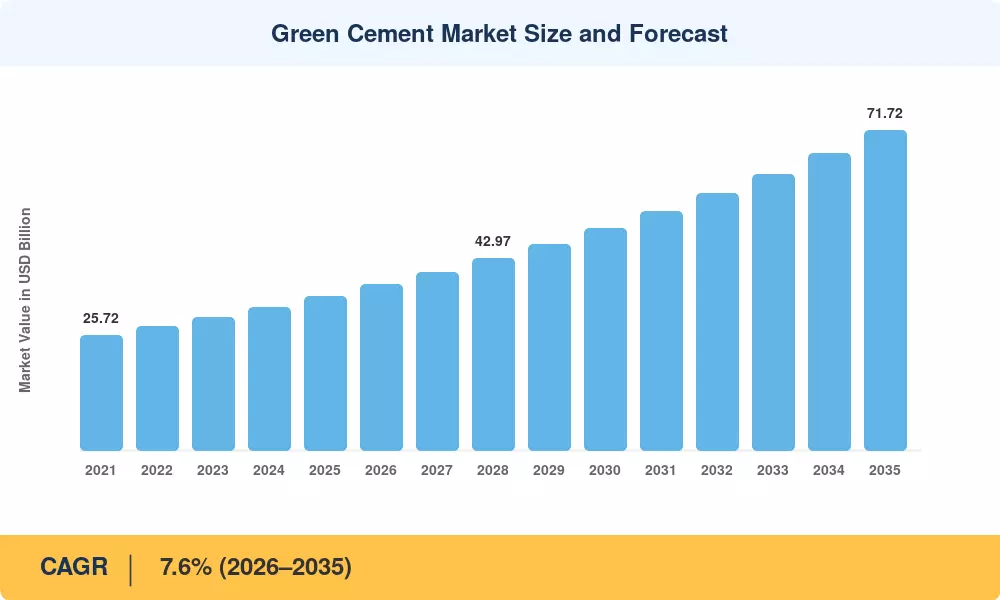
The Green Cement Market reached an estimated USD 34.50 Billion in 2025, is projected to touch USD 37.09 Billion in 2026, and is on course to climb to USD 71.72 Billion by 2035 at a 7.6% CAGR across the 2026–2035 forecast window. This trajectory reflects a structural shift: the EU Carbon Border Adjustment Mechanism (CBAM), now covering cement imports, and the U.S. Inflation Reduction Act's Buy Clean provisions have turned procurement specifications into the single largest growth catalyst for the Green Cement Market [1][2]. Carbon pricing mechanisms active in over 40 national jurisdictions push producers to reformulate or face margin erosion.

Traditional ordinary Portland cement — responsible for roughly 8% of global CO₂ emissions — is steadily losing specification share to blended and geopolymer alternatives. The International Energy Agency's Net Zero Roadmap calls for a 40% cut in direct cement-sector emissions by 2030, a target that has unlocked more than USD 12 billion in cumulative capital commitments toward kiln electrification, carbon-capture retrofit, and clinker-substitution capacity since 2022 [3][4]. Low-carbon cement formulations now account for a growing slice of tender-stage material lists in both public infrastructure and commercial real estate.

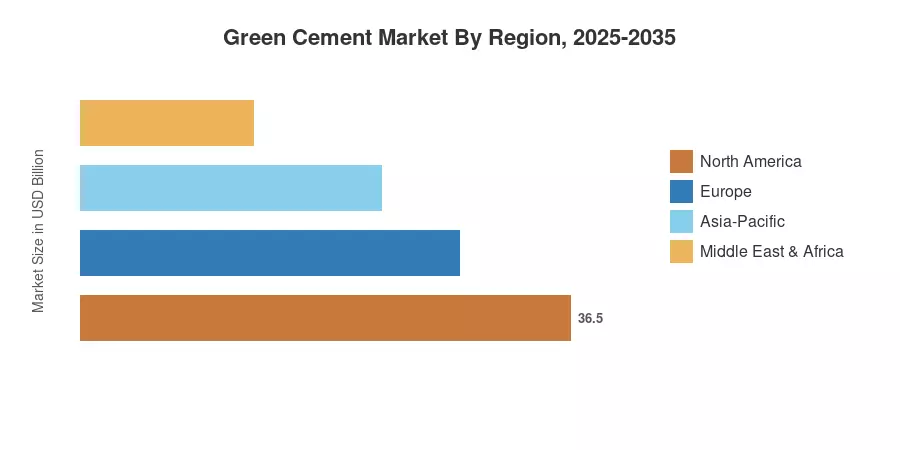
North America held approximately 34.0% of the Green Cement Market revenue in 2025, anchored by federal and state-level Buy Clean mandates. Asia-Pacific posted the fastest regional expansion, registering an 8.6% CAGR, driven by China's dual-carbon policy and India's green-building code revisions. Europe maintained the second-largest revenue position at USD 9.14 billion, underpinned by the EU Emissions Trading System and national green-public-procurement frameworks. The decade ahead will reward companies that lock in supplementary cementitious material supply chains early.


Key Report Takeaways

• By Product Type

  • Fly-ash-based cement commanded a 46.8% share of the Green Cement Market in 2025, reflecting thermal-power-plant by-product availability and established blending standards.
  • Slag-based cement is forecast to expand at an 8.3% CAGR through 2035, supported by rising blast-furnace-slag recovery in steelmaking regions.
  • Limestone-based formulations accounted for approximately USD 5.18 billion in 2025, gaining traction where fly ash supply is constrained.

• By Construction Sector

  • Non-residential works represented 62.3% of the Green Cement Market in 2025, led by commercial, institutional, and infrastructure projects subject to green-procurement mandates.
  • Residential construction is projected to achieve a 7.1% CAGR through 2035 as green-building certification programs expand into single-family housing.

• By Region

  • North America retained a 34.0% revenue share of the Green Cement Market, supported by early policy adoption and robust supply-chain maturity.
  • Asia-Pacific registered the fastest CAGR at 8.6%, with China and India together accounting for over 60% of regional demand growth.


Green Cement Market Size and Forecast (2021–2035)

Market sizing draws on a triangulated methodology combining top-down demand modeling from construction output databases, bottom-up production data from cement-industry associations, and cross-validation against publicly reported revenues of leading producers. All values are expressed in USD Billion at constant exchange rates.

Green Cement Market Size and Forecast
Our Impact
Enabled $4.3B Revenue Impact for Fortune 500 and Leading Multinationals
Partnering with 2000+ Global Organizations Each Year
30K+ Citations by Top-Tier Firms in the Industry

Driver Impact Analysis

Driver ~% Impact on CAGR Geographic Relevance Impact Timeline
Carbon-pricing and CBAM expansion 1.6% Europe, North America Short-term (≤2 yr)
Buy Clean procurement mandates 1.3% North America, Europe Short-term (≤2 yr)
ESG-linked project financing 1.1% Global Medium-term (2–4 yr)
Infrastructure stimulus packages 0.9% Asia-Pacific, North America Short-term (≤2 yr)
Clinker-substitution technology advances 0.8% Global Medium-term (2–4 yr)
Green-building certification growth 0.6% Global Long-term (≥4 yr)
Carbon-capture, utilization & storage scale-up 0.5% Europe, North America Long-term (≥4 yr)


Carbon-Pricing Mechanisms and Border Adjustments

The EU CBAM became fully operational for cement imports in 2026, imposing a carbon cost that can add USD 15–25 per tonne to conventional clinker-heavy products crossing EU borders by 2027 [1]. This price signal gives domestically produced green cement a landed-cost advantage that is reshaping procurement specifications across public-works tenders. Canada's escalating federal carbon price — set to reach CAD 170/tonne CO₂e by 2030 — amplifies a parallel incentive structure in North America [10].

Buy Clean Procurement Mandates

The U.S. General Services Administration’s Buy Clean program establishes maximum embodied carbon restrictions on cement and concrete for federally supported projects, projected to be USD 45 billion per year in construction spending [2]. Complementary legislation has been passed in several U.S. states, including California, New York, and Colorado. Green cement markets gain immediately as these mandates turn voluntary sustainability choices into enforceable purchase requirements.


ESG-Linked Financing and Green Bonds

In 2024, global green bond issuance exceeded USD 600 billion, and decarbonization of building materials is a qualified use-of-proceeds category under the Climate Bonds Initiative taxonomy [8]. Developers’ access to ESG-linked loans increasingly includes covenants on low-embodied-carbon material selection, creating downstream pull across the Green Cement Market across commercial and institutional segments.


Infrastructure Stimulus and Public-Works Spending

The U.S. Bipartisan Infrastructure Law allocates USD 550 billion in new federal investment over five years, much of it directed toward roads, bridges, and transit facilities where cement-intensive specifications dominate [5]. India's National Infrastructure Pipeline targets USD 1.4 trillion in capital expenditure through 2025, with revised IS 16415 codes encouraging blended-cement usage in government contracts [6].


Restraints Impact Analysis

Restraint-impact percentages reflect estimated drag on market growth. They are directional and non-additive.

Restraint ~% Impact on CAGR Geographic Relevance Impact Timeline
Higher unit cost of green formulations –0.9% Global Short-term (≤2 yr)
Feedstock supply variability (fly ash, slag) –0.7% Asia-Pacific, Europe Medium-term (2–4 yr)
Performance-standard conservatism –0.5% Global Long-term (≥4 yr)
Fragmented certification and labeling –0.4% Emerging markets Medium-term (2–4 yr)
Limited awareness among small contractors –0.3% South America, MEA Long-term (≥4 yr)


Cost Premium of Green Formulations

Green cement products are sold for 10–20% more than standard Portland cement, due to the need for additional grinding, quality-control measures, and smaller volumes of clinker, which require the purchase of supplemental materials [11]. Lifecycle cost evaluations frequently favor green choices, however up-front project expenditures — especially in price-sensitive residential markets — might impede uptake. As production rises, the Green Cement Market will close this difference, yet the premium represents a near-term headwind.


Feedstock Supply Constraints

The dominant source of fly ash, coal-fired power production, is decreasing in Europe and portions of North America, hence reducing the supply of an important additional cementitious ingredient [12]. Slag is a byproduct of blast-furnace steelmaking, which is moving toward electric-arc-furnace processes that do not produce granulated slag. Other pozzolans, like calcined clay, are coming into the market, but their supply chains are still immature relative to the volume requirements of the Green Cement Market.


Green Cement Market Opportunities

Calcined-Clay and LC3 Technology Expansion

Limestone-calcined-clay cement (LC3) can cut clinker content by up to 40% using globally abundant raw materials [4]. Pilot plants in India, Brazil, and Sub-Saharan Africa have demonstrated cost parity with ordinary Portland cement, positioning LC3 as a high-potential opportunity for the Green Cement Market in regions where fly ash is scarce.

Carbon-Capture Monetization

Cement kilns generate high-concentration CO₂ streams ideal for post-combustion capture. Several European producers now sell captured CO₂ to synthetic-fuel and beverage industries, converting a compliance cost into a revenue line [7]. This dual-benefit model could add USD 3–5 per tonne in margin uplift for early movers.

Digital Product Passports and Embodied-Carbon Tracking

The EU's revised Construction Products Regulation (EU 2024/3110) will require machine-readable embodied-carbon data, with full construction Digital Product Passport infrastructure by 2028-2029 [14]. Companies that invest in digital traceability platforms can differentiate the Green Cement Market offering at the specification stage and command premium pricing in tenders that weight transparency scoring.

Emerging-Market Urbanization

The urban population in Africa is anticipated to triple by 2050, resulting in a huge need for cement-intensive housing and infrastructure [15]. The early introduction of blended-cement requirements in Nigeria, Kenya, and Egypt – where the cost of importing clinker is already high – provides a greenfield opportunity for the Green Cement Market with no resistance from incumbents.


Green-Cement-as-a-Service Business Models

Innovative producers are bundling material supply with lifecycle carbon accounting, performance warranties, and take-back logistics for demolition waste. This service-layer approach shifts customer relationships from commodity transactions to managed-sustainability contracts, improving margin visibility and customer retention within the Green Cement Market.


Green Cement Market Future Outlook

AI-Optimized Mix Design and Quality Control

Machine-learning algorithms are entering cement plants to optimize supplementary-cementitious-material blending ratios in real time, reducing waste and ensuring consistent 28-day strength outcomes. The IEA estimates that digital process optimization could lower per-tonne emissions by 5–8% without capital-intensive kiln replacements [3]. This capability will enhance the competitiveness of the Green Cement Market by closing the performance-reliability gap that conservative specifiers cite.

Electrification and Hydrogen-Fired Kilns

Direct electrification of cement kilns — and pilot hydrogen-fuel switching at facilities in Sweden and Germany — could eliminate 30–40% of process-related CO₂ by the early 2030s [4][7]. The Green Cement Market stands to benefit as kiln-level decarbonization permits clinker itself to carry a lower carbon footprint, expanding the definition of "green" beyond blended-only products.

Circular-Economy Integration

Concrete recycling and demolition-waste valorization are gaining regulatory backing through the EU Ecodesign for Sustainable Products Regulation (ESPR) revisions slated for 2027 [14]. Producers who integrate reclaimed fine aggregates and recycle them into new formulations can reduce virgin material dependency. The Green Cement Market will increasingly converge with circular-construction platforms that track material provenance from cradle to grave.

ESG Reporting Mandates and Scope 3 Transparency

The International Sustainability Standards Board (ISSB) IFRS S2 disclosure requirements — now adopted by over 20 jurisdictions — compel real-estate developers and contractors to report Scope 3 embodied-carbon data [8]. As downstream buyers face audit scrutiny, preference shifts toward certified green-cement suppliers. The Green Cement Market will evolve from a product category into a compliance enabler tied to corporate sustainability reporting.


Green Cement Market Segmentation

By Product Type

Segment Key Metric Primary Demand Driver
Fly-Ash-Based 46.8% share (2025) Abundant thermal-plant by-product supply
Slag-Based 8.3% CAGR (2026–2035) Steel-industry slag recovery programs
Limestone-Based USD 5.18 Billion (2025) Availability where fly ash is scarce
Silica-Fume-Based 7.0% CAGR (2026–2035) High-performance concrete applications
Other Product Types USD 1.73 Billion (2025) Geopolymer and LC3 emerging formulations


Fly-ash-based cement leads the Green Cement Market because fly ash is a well-characterized pozzolan with decades of field performance data, established ASTM and EN standards, and widespread availability near coal-fired generation sites. Blending ratios of 15–35% are routine, and higher-volume replacements (up to 50%) are gaining acceptance in non-structural applications.

Slag-based cement is the fastest-growing product category within the Green Cement Market, benefiting from quality-consistent ground-granulated blast-furnace slag that delivers superior sulfate resistance and reduced heat of hydration — properties prized in mass-pour infrastructure. Supply security remains the primary risk as electric-arc-furnace steelmaking gains share.

By Construction Sector

Segment Key Metric Primary Demand Driver
Non-Residential 62.3% share (2025) Green-procurement mandates in public works
Residential 7.1% CAGR (2026–2035) Green-home certification expansion


Non-residential construction dominates the Green Cement Market because public tenders, commercial office developers, and institutional builders operate under formal sustainability scoring systems that reward or require low-embodied-carbon materials. Highway, bridge, and airport projects are particularly cement-intensive, and government Buy Clean rules channel this volume toward green formulations.

Residential construction, while smaller in share, is the fastest-growing sector as programs like LEED for Homes, India's GRIHA, and the UK's Future Homes Standard incorporate embodied-carbon benchmarks into compliance pathways.


Regional Market Share Analysis

Region Key Metric Primary Investment Themes
North America 34.0% share (2025) Buy Clean mandates; CCUS infrastructure
Europe USD 9.14 Billion (2025) CBAM enforcement; Digital Product Passports
Asia-Pacific 8.6% CAGR (2026–2035) Dual-carbon policy; infrastructure stimulus
South America USD 2.07 Billion (2025) LC3 pilot programs; urbanization demand
Middle East & Africa 6.9% CAGR (2026–2035) Green-city projects; clinker-import substitution
Total USD 34.50 Billion (2025)

The Green Cement Market exhibits meaningful regional differentiation shaped by policy maturity, feedstock availability, and construction-sector composition.


North America

Country Key Metric Key Driver
United States 72.5% of regional share Federal Buy Clean; state-level mandates
Canada 8.1% CAGR Escalating carbon price; green infrastructure fund
Mexico USD 1.18 Billion (2025) Nearshoring construction boom


U.S. federal procurement reform has been the single most consequential policy lever for the Green Cement Market in North America. Canada's carbon pricing trajectory and Mexico's expanding manufacturing corridor create complementary growth channels.

Europe

Country Key Metric Key Driver
Germany 22.4% of regional share Energiewende construction codes
United Kingdom 7.9% CAGR PAS 2080 carbon-management standard
France USD 1.35 Billion (2025) RE2020 low-carbon building regulation
Italy 6.8% CAGR Superbonus renovation incentive extension
Spain USD 0.68 Billion (2025) Green-public-procurement mandates
Nordic Countries 8.4% CAGR Carbon-neutral roadmaps by 2030
Russia USD 0.41 Billion (2025) Domestic clinker-substitution programs
Rest of Europe 12.8% of regional share EU Cohesion Fund green-infrastructure allocations


The EU ETS carbon price — fluctuating between EUR 55 and EUR 90 per tonne during 2024 — has made conventional high-clinker cement economically unattractive for large-scale tenders, channeling specification authority toward the Green Cement Market [1].

Asia-Pacific

Country Key Metric Key Driver
China 38.2% of regional share Dual-carbon policy; state-owned producer mandates
India 9.1% CAGR IS 16415 blended-cement codes; housing stimulus
Japan USD 1.14 Billion (2025) GX Transition Bond funding
South Korea 7.8% CAGR K-Taxonomy green-finance framework
ASEAN USD 0.92 Billion (2025) Infrastructure connectivity projects
Rest of Asia-Pacific 7.5% CAGR Emerging green-building certifications


China's cement industry — the world's largest — faces binding carbon-intensity caps under the national ETS expansion, compelling state-owned enterprises to accelerate blended-product portfolios. India's dual thrust of affordable housing programs and revised cement standards supports the Green Cement Market through both volume and specification channels [6].

South America

Country Key Metric Key Driver
Brazil 58.5% of regional share PBQP-H green-construction program
Argentina 6.4% CAGR Infrastructure reactivation stimulus
Rest of South America USD 0.49 Billion (2025) LC3 pilot adoption


Brazil anchors regional demand through a combination of public-housing programs and progressive construction-quality frameworks that increasingly reference embodied-carbon metrics for the Green Cement Market.

Middle East & Africa

Country Key Metric Key Driver
Saudi Arabia 31.6% of regional share Vision 2030 giga-project specifications
UAE 7.4% CAGR Estidama and LEED-mandated projects
South Africa USD 0.28 Billion (2025) Carbon-tax phase-in for industrial emitters
Egypt 6.5% CAGR New Administrative Capital construction
Rest of MEA USD 0.42 Billion (2025) Affordable-housing programs


Saudi Arabia's NEOM and Red Sea Project specifications embed mandatory low-carbon-material thresholds, creating anchor demand for the Green Cement Market in the Gulf Cooperation Council region.


Green Cement Market By Region, 2025-2035

Competitive Benchmarking

The Green Cement Market exhibits medium concentration, with an estimated Herfindahl-Hirschman Index (HHI) in the 900–1,200 range. The top five producers account for roughly 35–42% of global revenue. Incumbent cement majors compete on kiln-network scale and distribution reach, while specialized entrants differentiate through proprietary binder chemistry and secured feedstock agreements.

Company Est. Revenue Share Range Key Offerings for the Green Cement Market Strategic Positioning
Holcim Group ~8–11% ECOPact low-carbon concrete; ECOPlanet cement Broadest global footprint; clinker-factor reduction leader
Heidelberg Materials ~7–10% EcoCem portfolio; CCS pilot at Brevik European leadership; first full-scale cement CCS project
CEMEX S.A.B. ~5–8% Vertua low-carbon range Integrated digital platform; strong Americas presence
CRH plc ~4–7% EcoCem blended products Acquisition-led growth; North American infrastructure focus
Anhui Conch Cement ~4–6% Blended-cement and waste-heat-recovery lines Largest producer in China; scale-cost advantage
UltraTech Cement ~3–5% Green building-product range; GGBS blends Dominant Indian share; extensive dealer network
Dalmia Bharat ~2–4% Low-carbon Portland composite cements Industry-leading clinker factor below 60%
Hoffmann Green Cement ~1–2% Clinker-free H-UKR, H-EVA, H-P2A products Pure-play green; no-kiln cold-process technology
Ecocem ~1–2% GGBS and low-carbon binders Specialist slag processor; strong EU partnerships
Solidia Technologies ~0.5–1% CO₂-cured concrete technology Proprietary carbonation-curing; licensing model


Recent News & Developments

  • Holcim Group (May 2024): Commissioned the world's first carbon-capture-ready cement plant in Obourg, Belgium, targeting 95% CO₂ capture upon full operation, reinforcing the Green Cement Market's technological credibility [7].
  • Heidelberg Materials (December 2024): Achieved mechanical completion of the Brevik CCS facility in Norway — the first industrial-scale carbon-capture unit on a cement kiln — with 400,000 tonnes/year capture capacity [7].
  • CEMEX (March 2024): Expanded Vertua net-zero-carbon-ready concrete availability to 15 additional markets across South America and Europe, broadening the Green Cement Market's geographic reach [16].
  • European Commission (January 2024): Published implementing regulations for CBAM cement-sector coverage, establishing default emission values and verification protocols effective 2026 [1].
  • Hoffmann Green Cement (September 2023): Broke ground on a second clinker-free production facility in Bournezeau, France, doubling capacity from 500,000 tonnes to 250,000 tonnes annually [17].
  • Dalmia Bharat (July 2023): Announced a target to become carbon-negative by 2040, committing USD 350 Million to kiln-upgrade and alternative-fuel programs in India [18].
  • U.S. GSA (May 2023): Released final Buy Clean standards setting maximum global-warming-potential limits for cement and concrete in federal construction projects [2].


Green Cement Market Report Scope

Parameter Detail
Market Scope Green Cement Market — global, by Product Type, Construction Sector, and Region
Study Period 2021–2035
CAGR (Forecast) 7.6% (2026–2035)
Market Size (2025) USD 34.50 Billion
Market Size (2035) USD 71.72 Billion
Fastest Growing Segment Slag-Based (by Product Type); Residential (by Sector); Asia-Pacific (by Region)
Companies Profiled 10 (Holcim, Heidelberg Materials, CEMEX, CRH, Anhui Conch, UltraTech, Dalmia Bharat, Hoffmann Green, Ecocem, Solidia Technologies)
Valuation Currency USD Billion


FAQs

How do carbon credits affect procurement decisions in the Green Cement Market?

Carbon credits raise the effective cost of conventional cement, making green alternatives price-competitive in regions with active trading schemes. Procurement teams in CBAM-covered markets increasingly specify maximum embodied-carbon thresholds [1].

What testing standards validate green cement performance in the Green Cement Market?

ASTM C595, EN 197-1, and IS 16415 govern blended-cement strength and durability. Specifiers rely on these standards to confirm that green formulations meet structural-equivalence criteria [13].

How does kiln fuel switching reshape the Green Cement Market?

Hydrogen and biomass co-firing can cut process CO₂ by 30–40%, allowing producers to label even clinker-containing products as green. Early adopters in Scandinavia have demonstrated commercial-scale viability [7].

What financing mechanisms support buyers in the Green Cement Market?

Green-bond-eligible project structures and sustainability-linked loans offer 15–30 basis-point interest-rate reductions when certified low-carbon materials are specified [8].

How do supply-chain disruptions impact the Green Cement Market?

Fly-ash shortages from coal-plant retirements and slag supply shifts from EAF steelmaking create regional feedstock volatility. Diversifying into calcined-clay inputs mitigates this risk [12].

What role do digital twins play in the Green Cement Market?

Digital twins simulate plant-level blending scenarios, reducing trial-batch waste by up to 20% and accelerating formulation approval for new supplementary cementitious materials [3].

How do green-cement warranties differ from conventional guarantees in the Green Cement Market?

Leading producers now bundle embodied-carbon certificates with 10-year performance warranties, shifting risk from buyers. This bundled assurance model accelerates specification adoption [9].    
Author
Author
Author Profile
Chitranshi Jaiswal LinkedIn
Team Lead - Research
Chitranshi is a Team Leader in the Chemicals & Materials (CnM) and Energy & Power (EnP) domains, with 6+ years of experience in market research. She leads and mentors teams to deliver cross-domain projects that equip clients with actionable insights and growth strategies. She is skilled in market estimation, forecasting, competitive benchmarking, and both primary & secondary research, enabling her to turn complex data into decision-ready insights. An engineer and MBA professional, she combines technical expertise with strategic acumen to solve dynamic market challenges. Chitranshi has successfully managed projects that support market entry, investment planning, and competitive positioning, while building strong client relationships. Certified in Advanced Excel & Power BI she leverages data-driven approaches to ensure accuracy, clarity, and impactful outcomes.

Research Approach


Secondary Research

The secondary research process involved comprehensive analysis of regulatory databases, industry associations, peer-reviewed engineering journals, construction sector publications, and authoritative environmental organizations. Key sources included the United States Environmental Protection Agency (EPA), European Commission Directorate-General for Internal Market, Industry, Entrepreneurship and SMEs (GROW), Portland Cement Association (PCA), European Cement Association (CEMBUREAU), World Cement Association (WCA), American Concrete Institute (ACI), National Institute of Standards and Technology (NIST), United States Geological Survey (USGS) Mineral Commodity Summaries, International Energy Agency (IEA) Tracking Clean Energy Progress, Global Cement and Concrete Association (GCCA), National Bureau of Statistics of China, Construction Products Regulation (CPR) EU database, and national infrastructure development authorities from key markets. These sources were used to collect production capacity statistics, carbon emission regulations, green building certification data (LEED, BREEAM), clinker substitution rates, infrastructure investment trends, and competitive landscape analysis for fly ash-based, slag-based, geopolymer, and other alternative cement formulations.


Primary Research

Qualitative and quantitative insights were obtained by interviewing supply-side and demand-side stakeholders during the primary research process. Green cement manufacturers, traditional cement producers with green portfolios, and construction material OEMs were among the supply-side sources, which included CEOs, VPs of Sustainability, R&D managers, and commercial directors. Residential developers, commercial construction firms, infrastructure contractors, and ready-mix concrete suppliers were the demand-side sources, which included procurement directors, chief sustainability officers, and project managers. Market segmentation was validated, decarbonization pathway timelines were confirmed, and insights regarding regulatory compliance costs, pricing premiums for low-carbon cement, and supply chain logistics for supplementary cementitious materials were obtained through primary research.

Primary Respondent Breakdown:

By Designation: C-level Primaries (40%), Director Level (30%), Others (30%)

By Region: North America (32%), Europe (30%), Asia-Pacific (28%), Rest of World (10%)


Market Size Estimation

Global market valuation was derived through production capacity mapping and consumption volume analysis. The methodology included:

Identification of over 40 significant manufacturers in North America, Europe, Asia-Pacific, the Middle East, and Latin America

Product mapping across fly ash-based, slag-based, geopolymer, and other alternative cement categories

Analysis of reported and modeled annual revenues specific to green cement and low-carbon product portfolios

Coverage of manufacturers representing 75-80% of global market share in 2024

Extrapolation using bottom-up (construction volume × cement intensity × green cement penetration by country) and top-down (manufacturer revenue validation) approaches to derive segment-specific valuations, incorporating regional carbon pricing mechanisms and green building code adoption rates

Download Free Sample

Kindly complete the form below to receive a free sample of this Report

Download PDF ×

We do not share your information with anyone. However, we may send you emails based on your report interest from time to time. You may contact us at any time to opt-out.