Green steel Market Summary
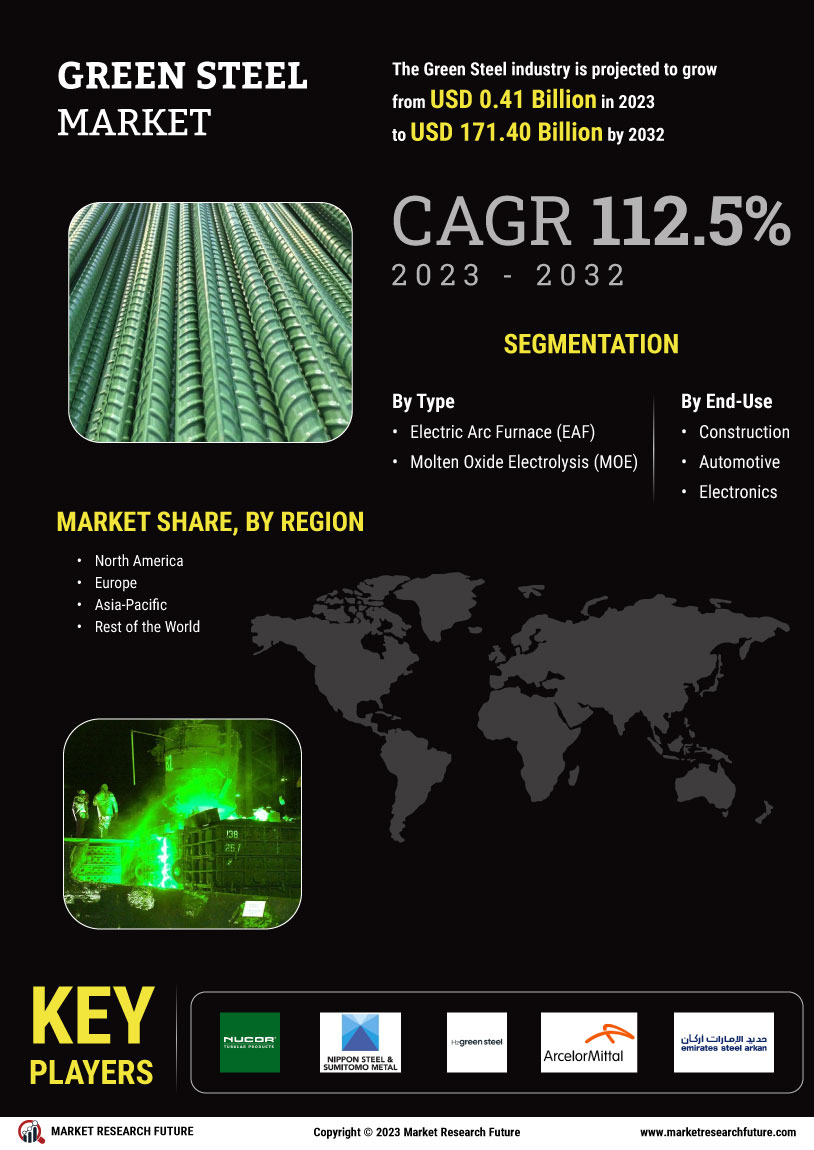
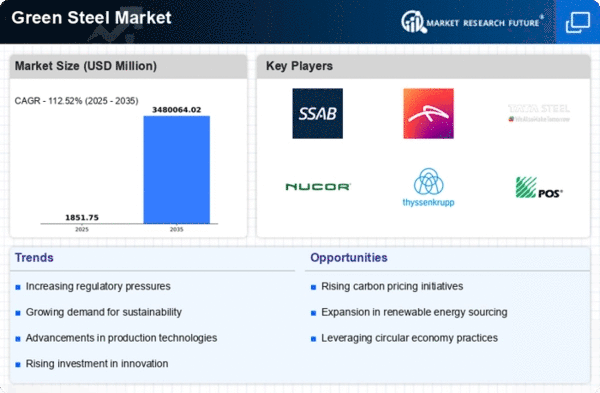
As per Market Research Future Analysis, the Global Green Steel Market is poised for substantial growth, driven by increasing environmental regulations and rising demand from the automotive and construction sectors. The market size was estimated at 2.25 USD Billion in 2023 and is projected to reach 50 USD Billion by 2035, reflecting a compound annual growth rate (CAGR) of approximately 29.49% from 2025 to 2035. Key technological innovations, such as hydrogen-based reduction and recycling methods, are enhancing production efficiency and sustainability.
Key Market Trends & Highlights
The Global Green Steel Market is witnessing transformative trends focused on sustainability and innovation.
- Market size in 2024: 2.91 USD Billion; expected to grow to 50 USD Billion by 2035.
- Hydrogen-Based Reduction method projected to grow from 0.91 USD Billion in 2024 to 15.0 USD Billion by 2035.
- Electric vehicles expected to account for 30% of all vehicle sales by 2030, driving green steel demand.
- Europe's market valuation in 2024: 1.2 USD Billion; anticipated to reach 20.0 USD Billion by 2035.
Market Size & Forecast
2023 Market Size: USD 2.25 Billion
2024 Market Size: USD 2.91 Billion
2035 Market Size: USD 50 Billion
CAGR (2025-2035): 29.49%
Largest Regional Market Share in 2024: Europe.
Major Players
Key companies include Boston Metal, Nucor, ClevelandCliffs, POSCO, Voestalpine, SSAB, Tata Steel, Severstal, Thyssenkrupp, United States Steel, Salzgitter AG, ArcelorMittal, H2 Green Steel.
Key Green Steel Market Trends Highlighted
The Green Steel Market is experiencing significant growth driven by increasing environmental regulations and the urgent need to reduce carbon emissions in steel production. Governments worldwide are pushing for greener manufacturing processes, and steel producers are responding by investing in technologies that promote sustainability, such as hydrogen-based steelmaking. This shift is driven by a growing awareness of climate change and its impact on health and the environment, pushing companies to adopt cleaner alternatives.
Additionally, the demand for green steel is rising due to the automotive and construction industries prioritizing sustainable materials to meet consumer expectations for environmentally friendly products.Opportunities to be explored in this market include advances in carbon capture and storage technologies, as well as the potential for recycling scrap steel, which can reduce the reliance on virgin iron ore. Developing countries, in particular, can benefit from investing in green steel technologies, thus creating an avenue for economic growth and job creation in sustainable sectors.
Innovation in the production processes, such as using renewable energy sources, can open new pathways for accessing markets that favor sustainable goods. Trends in recent times show a collaborative approach among different stakeholders in the steel industry, including partnerships between governments, private companies, and research institutions aimed at accelerating the transition to greener production methods.The focus is increasingly on developing measurement frameworks for assessing the carbon footprint of steel materials, which can also serve as a regulatory benchmark for manufacturers. Furthermore, consumer preferences are shifting toward products with lower environmental impacts, encouraging producers to align their offerings with these trends.
The future of the Green Steel Market looks promising, supported by policy incentives and growing consumer demand for sustainable solutions.Â

Source: Primary Research, Secondary Research, Market Research Future Database and Analyst Review
Green Steel Market Drivers
-
Increasing Demand for Sustainable Practices
demand for sustainable practices in numerous businesses has increased significantly, owing mostly to increased environmental awareness. According to the United Nations Framework Convention on Climate Change (UNFCCC), worldwide carbon dioxide emissions from iron and steel manufacturing have accounted for around 7% of overall emissions in recent years. The steel industry's substantial environmental impact has sparked attempts by organizations such as the World Steel Association, which promotes carbon reduction via the use of green steel technology.As more organizations commit to carbon neutrality targets, the Green Steel Market Industry is predicted to expand, with businesses investing extensively in low-carbon solutions.
According to the International Energy Agency, moving to green steel may cut emissions by roughly 2.5 gigatons per year by 2030, indicating the potential for significant market development owing to rising demand for sustainable steel solutions.
Government Policies Favoring Emission Reductions
Governments worldwide are introducing stringent policies aimed at minimizing carbon emissions, significantly impacting the Green Steel Market Industry. For instance, the European Union's Green Deal sets a target to become climate-neutral by 2050, proposing significant investments in low-carbon technologies and sustainable practices. In 2020, the European Commission revealed plans to achieve a 55% reduction in greenhouse gas emissions by 2030 compared to 1990 levels, directly influencing the steel industry.Such regulatory frameworks are compelling steel manufacturers to invest in green technologies, thereby driving market growth.
Moreover, countries like Sweden and Finland are allocating substantial resources toward developing hydrogen-based steel production methods, which could further accelerate the adoption of green steel on a scale.
Technological Advancements in Steel Production
The Green Steel Market Industry is significantly driven by rapid technological advancements in steel production methodologies. Innovations such as the use of hydrogen in steel manufacturing, developed by key players like SSAB and Swedish company H2 Green Steel, demonstrate the industry's commitment to reducing emissions. Research indicates that using hydrogen can cut carbon emissions by up to 95% compared to conventional production methods.Additionally, the emergence of direct reduced iron technology has optimally utilized renewable energy resources, further facilitating cleaner steel production.
This technological evolution is not only aligning with sustainability goals but also improving efficiency and economic viability, showcasing a robust future for the green steel sector.
Green Steel Market Segment Insights
Green Steel Market Method of Production Insights
The Method of Production segment of the Green Steel Market is poised for significant development, showcasing diverse approaches such as Hydrogen-Based Reduction, Electrolysis, Biomass Direct Reduction, and Recycling. The overall market in 2024 is valued at 2.91 USD Billion and is expected to witness robust growth by 2035, reaching 50.0 USD Billion.
In 2024, the Hydrogen-Based Reduction segment holds a valuation of 1.2 USD Billion, reflecting its strong potential and increasing adoption as industries seek cleaner alternatives for steel production.By 2035, this segment is expected to lead with a valuation of 20.0 USD Billion, giving it a majority holding in the Green Steel Market. This method is considered significant due to its lower carbon emissions compared to traditional processes, which aligns with sustainability goals. Electrolysis, another key method, is valued at 0.85 USD Billion in 2024 and is projected to achieve 15.0 USD Billion by 2035.
This technology utilizes electricity to split water into hydrogen and oxygen, which is then applied in steel production, further enhancing its appeal amid the renewable energy push.Biomass Direct Reduction, with a valuation of 0.45 USD Billion in 2024, is anticipated to grow to 8.0 USD Billion by 2035. This method leverages organic materials to reduce iron ore into iron, contributing significantly to the circular economy by utilizing waste products. Lastly, the Recycling method, valued at 0.41 USD Billion in 2024, is expected to reach 7.0 USD Billion in 2035.
While it represents the least dominant segment, its importance cannot be overlooked as recycling steel greatly reduces energy consumption and greenhouse gas emissions.These insights reflect the underlying trends and market dynamics of the Green Steel Market, where sustainability and innovative production methods play a crucial role in shaping the future of steel manufacturing.Â

Source: Primary Research, Secondary Research, Market Research Future Database and Analyst Review
Green Steel Market End Use Industry Insights
The Green Steel Market, which is set to be valued at 2.91 USD Billion in 2024, showcases a significant expansion driven by the increasing demand in the End Use Industry. The construction sector plays a crucial role, as it increasingly adopts green steel to meet sustainability goals and reduce carbon footprints. The automotive industry is also witnessing a strong shift, with manufacturers prioritizing lightweight and eco-friendly materials to enhance fuel efficiency.
In manufacturing, green steel is essential for the production of machinery and components, aligning with the trend towards decarbonization.Energy applications of green steel are significant as well, particularly in renewable energy infrastructure, supporting the shift towards clean energy sources. The overall market growth is supported by rising environmental regulations and the urgency to mitigate climate change impacts, providing ample opportunities across these sectors. As the focus on sustainability deepens, green steel is expected to gain the majority holding, particularly in the construction and automotive industries, making it a pivotal element in the transition toward a greener future.
Green Steel Market Form Insights
The Green Steel Market, focusing on the Form segment, has been experiencing notable growth, with significant contributions from various categories such as Flat Steel, Long Steel, and Steel Products. By 2024, this market is expected to be valued at 2.91 USD Billion and is projected to witness an increase to 50.0 USD Billion by 2035. Flat Steel is essential due to its versatility and application across the automotive and construction industries, supporting the shift towards sustainable practices in these sectors.
Long Steel plays a crucial role in infrastructure development, catering to the demands for eco-friendly building solutions.Steel Products encompasses a range of items that aid in the production of innovative and efficient applications, aligning with sustainability efforts. The Green Steel Market segmentation indicates a strong consumer preference for low-carbon steel solutions, driven by rising environmental regulations and growing awareness of climate change.
This market growth is further supported by advancements in technology aimed at reducing emissions, thus presenting numerous opportunities while also facing challenges related to production costs and raw material availability.Overall, the market data reflects a robust potential for expansion in the Green Steel industry, demonstrating significant shifts towards greener alternatives and increased demand for sustainable steel forms.
Green Steel Market Quality Grade Insights
The Green Steel Market is witnessing significant growth, particularly in the Quality Grade segment. By 2024, the market is valued at 2.91 USD Billion and is expected to rise substantially in the coming years. This segment encompasses various grades of steel, including High Strength Steel, Low Alloy Steel, and Stainless Steel, which are critical in meeting the evolving demands for sustainability and performance in industrial applications.
High Strength Steel is gaining traction due to its lightweight and high durability, making it vital for industries such as automotive and construction.Low Alloy Steel plays a crucial role in enhancing strength and toughness while maintaining low costs, appealing to manufacturers looking for efficient production methods. Stainless Steel, known for its corrosion resistance and longevity, remains significant for sectors requiring reliable materials, such as food and pharmaceuticals. The Green Steel Market revenues and segmentation underscore a robust market growth trajectory driven by increasing investments in sustainable practices and the adoption of advanced technologies.
Market challenges include the need for improved production methods to enhance efficiency while maintaining environmental benefits, presenting opportunities for innovation in this sector.Overall, the Quality Grade segment is poised to shape the Green Steel Market landscape as industries transition towards greener solutions.
Green Steel Market Regional Insights
The 'Green Steel Market' is projected to witness significant growth across various regions, with a valuation of 2.91 USD Billion in 2024 and expected to reach 50.0 USD Billion by 2035. North America is expected to hold a major portion, valued at 0.74 USD Billion in 2024, rising to 12.5 USD Billion in 2035, driven by a surge in eco-friendly initiatives and technological advancements.
Europe follows closely, with a valuation of 1.1 USD Billion in 2024, anticipated to reach 20.0 USD Billion by 2035, emphasizing the region's strong commitment to sustainable practices.Asia Pacific is also significant, valued at 0.61 USD Billion in 2024, and projected to grow to 10.0 USD Billion by 2035, benefiting from increased demand for green steel in rapidly industrializing economies.
Meanwhile, South America and the Middle East and Africa report valuations of 0.29 USD Billion and 0.17 USD Billion in 2024, respectively, with growth prospects reaching 5.0 USD Billion and 2.5 USD Billion by 2035, as local industries prioritize environmentally friendly production methods. Overall, the regional segmentation showcases varied growth drivers, with significant potential in established and emerging markets alike, highlighting the importance of sustainable steel production initiatives for environmental goals.

Source: Primary Research, Secondary Research, Market Research Future Database and Analyst Review
Green Steel Market Key Players and Competitive Insights:
The Green Steel Market is experiencing robust growth as environmental concerns and sustainability priorities drive manufacturers and consumers to seek more eco-friendly production methods. The competitive landscape is shaped by the pressing need for carbon neutrality and the shift toward hydrogen-reduced steelmaking processes. Various companies are investing heavily in research and development to innovate sustainable practices while maintaining high-quality steel production. As economies worldwide commit to reducing emissions, the market for green steel is likely to expand, drawing in new entrants while established players innovate to improve their offerings and enhance their competitive stance.
The competitive insights reveal a focus on technological advancements, strategic partnerships, and dynamic supply chain management to meet the changing demands of industries.Tata Steel has established a significant presence in the Green Steel Market, leveraging its expertise in steel manufacturing and commitment to sustainability. The company's strengths lie in its advanced manufacturing technologies and a strong emphasis on reducing its carbon footprint, positioning itself as a responsible steel producer. Tata Steel's ongoing initiatives in carbon capture and utilization demonstrate its proactive approach to addressing environmental challenges.
Additionally, the company has been focused on investing in renewable energy sources, which further strengthens its sustainability credentials. Through these efforts, Tata Steel is not only enhancing its reputation as a leader within the sector but also expanding its influence in markets that prioritize greener practices.Hyundai Steel is strategically positioned in the Green Steel Market, focusing on developing low-carbon and eco-friendly steel solutions. The company has adopted several initiatives to bolster its commitment to sustainability, including investing in innovative production technologies that reduce greenhouse gas emissions.
Hyundai Steel's key products include high-strength steel and specialized steel products that cater to various industries, emphasizing quality and sustainability. The company's market presence is augmented by its strategic mergers and acquisitions aimed at enhancing technological capabilities and expanding its product range. Hyundai Steel's ongoing R&D efforts to improve its steel production processes and its focus on industry collaborations further reflect its strengths in adapting to the evolving landscape of steel production. By maintaining a focus on sustainable practices, Hyundai Steel is poised to strengthen its market position as demand for green steel alternatives continues to grow globally.
Key Companies in the Green Steel Market IncludeÂ
- Tata Steel
- Hyundai Steel
- POSCO
- Thyssenkrupp
- ArcelorMittal
- H2 Green Steel
- Steel Dynamics
- Nucor
- ClevelandCliffs
- SAIL
- SSAB
- Voestalpine
- John Wood Group
- United States Steel
- Sierra Steel
Green steel Industry Developments
-
Q3 2025: American startup tests cheaper approach to producing green steel Hertha Metals, a U.S. startup, announced the successful testing of a new, single-step, energy-efficient process for green steel production that minimizes emissions without increasing costs compared to traditional methods.
Green Steel Market Segmentation InsightsÂ
Green Steel Market Method of Production Outlook
- Hydrogen-Based Reduction
- Electrolysis
- Biomass Direct Reduction
- RecyclingÂ
Green Steel Market End Use Industry Outlook
- Construction
- Automotive
- Manufacturing
- EnergyÂ
Green Steel Market Form Outlook
- Flat Steel
- Long Steel
- Steel ProductsÂ
Green Steel Market Quality Grade Outlook
- High Strength Steel
- Low Alloy Steel
- Stainless SteelÂ
Green Steel Market Regional Outlook
- North America
- Europe
- South America
- Asia Pacific
- Middle East and Africa
Â
Â
Report Attribute/Metric |
Details |
Market Size 2023 |
2.25(USD Billion) |
Market Size 2024 |
2.91(USD Billion) |
Market Size 2035 |
50.0(USD Billion) |
Compound Annual Growth Rate (CAGR) |
29.5% (2025 - 2035) |
Report Coverage |
Revenue Forecast, Competitive Landscape, Growth Factors, and Trends |
Base Year |
2024 |
Market Forecast Period |
2025 - 2035 |
Historical Data |
2019 - 2024 |
Market Forecast Units |
USD Billion |
Key Companies Profiled |
Tata Steel, Hyundai Steel, POSCO, Thyssenkrupp, ArcelorMittal, H2 Green Steel, Steel Dynamics, Nucor, ClevelandCliffs, SAIL, SSAB, Voestalpine, John Wood Group, United States Steel, Sierra Steel |
Segments Covered |
Method of Production, End Use Industry, Form, Quality Grade, Regional |
Key Market Opportunities |
Decarbonization initiatives drive demand, Government regulations favoring green processes, Growing electric vehicle manufacturing needs, Rising consumer preference for sustainability, and Investment in innovative production technologies. |
Key Market Dynamics |
sustainability trends, regulatory support, technological advancements, increasing demand, cost competitiveness |
Countries Covered |
North America, Europe, APAC, South America, MEA |
 Â
Green steel Market Highlights:
Frequently Asked Questions (FAQ):
The Green Steel Market is expected to be valued at 2.91 USD Billion in 2024.
By 2035, the Green Steel Market is projected to reach 50.0 USD Billion.
The expected CAGR for the Green Steel Market during this period is 29.5%.
Europe is expected to be the dominant region, with a market valuation of 20.0 USD Billion by 2035.
The Hydrogen-Based Reduction segment is valued at 1.2 USD Billion in 2024.
The Recycling segment is projected to reach 7.0 USD Billion by 2035.
Major players include Tata Steel, Hyundai Steel, POSCO, Thyssenkrupp, and ArcelorMittal.
North America is valued at 0.74 USD Billion in 2024.
The Asia Pacific region is expected to reach a market value of 10.0 USD Billion by 2035.
Key opportunities include advancements in production methods and rising demand for sustainable steel.
TABLE OF CONTENTS
Â
Â
Â
Â
  Â
1. EXECUTIVE SUMMARYÂ Â
1.1. Market Overview  Â
1.2. Key Findings  Â
1.3. Market Segmentation  Â
1.4. Competitive Landscape  Â
1.5. Challenges and Opportunities  Â
1.6. Future Outlook    Â
Â
Â
Â
  Â
2. MARKET INTRODUCTIONÂ Â
2.1. Definition  Â
2.2. Scope of the study Â
2.2.1. Research Objective    Â
2.2.2. Assumption    Â
2.2.3. Limitations       Â
3. RESEARCH METHODOLOGYÂ Â
3.1. Overview  Â
3.2. Data Mining  Â
3.3. Secondary Research  Â
3.4. Primary Research Â
3.4.1. Primary Interviews and Information Gathering Process    Â
3.4.2. Breakdown of Primary Respondents     Â
3.5. Forecasting Model  Â
3.6. Market Size Estimation Â
3.6.1. Bottom-Up Approach    Â
3.6.2. Top-Down Approach     Â
3.7. Data Triangulation  Â
3.8. Validation    Â
Â
Â
Â
  Â
4. MARKET DYNAMICSÂ Â
4.1. Overview  Â
4.2. Drivers  Â
4.3. Restraints  Â
4.4. Opportunities    Â
5. MARKET FACTOR ANALYSISÂ Â
5.1. Value chain Analysis  Â
5.2. Porter's Five Forces Analysis Â
5.2.1. Bargaining Power of Suppliers    Â
5.2.2. Bargaining Power of Buyers    Â
5.2.3. Threat of New Entrants    Â
5.2.4. Threat of Substitutes    Â
5.2.5. Intensity of Rivalry     Â
5.3. COVID-19 Impact Analysis Â
5.3.1. Market Impact Analysis    Â
5.3.2. Regional Impact    Â
5.3.3. Opportunity and Threat Analysis       Â
Â
Â
Â
  Â
6. GREEN STEEL MARKET BY METHOD OF PRODUCTION (USD BILLION)Â Â
6.1. Hydrogen-Based Reduction  Â
6.2. Electrolysis  Â
6.3. Biomass Direct Reduction  Â
6.4. Recycling    Â
7. GREEN STEEL MARKET BY END USE INDUSTRY (USD BILLION)Â Â
7.1. Construction  Â
7.2. Automotive  Â
7.3. Manufacturing  Â
7.4. Energy    Â
8. GREEN STEEL MARKET BY FORM (USD BILLION)Â Â
8.1. Flat Steel  Â
8.2. Long Steel  Â
8.3. Steel Products    Â
9. GREEN STEEL MARKET BY QUALITY GRADE (USD BILLION)Â Â
9.1. High Strength Steel  Â
9.2. Low Alloy Steel  Â
9.3. Stainless Steel    Â
10. GREEN STEEL MARKET BY REGIONAL (USD BILLION)Â Â
10.1. North America Â
10.1.1. USÂ Â Â Â Â
10.1.2. Canada     Â
10.2. Europe Â
10.2.1. Germany    Â
10.2.2. UKÂ Â Â Â Â
10.2.3. France    Â
10.2.4. Russia    Â
10.2.5. Italy    Â
10.2.6. Spain    Â
10.2.7. Rest of Europe     Â
10.3. APACÂ Â
10.3.1. China    Â
10.3.2. India    Â
10.3.3. Japan    Â
10.3.4. South Korea    Â
10.3.5. Malaysia    Â
10.3.6. Thailand    Â
10.3.7. Indonesia    Â
10.3.8. Rest of APACÂ Â Â Â Â Â
10.4. South America Â
10.4.1. Brazil    Â
10.4.2. Mexico    Â
10.4.3. Argentina    Â
10.4.4. Rest of South America     Â
10.5. MEAÂ Â
10.5.1. GCC Countries    Â
10.5.2. South Africa    Â
10.5.3. Rest of MEAÂ Â Â Â Â Â Â Â
Â
Â
Â
  Â
11. COMPETITIVE LANDSCAPEÂ Â
11.1. Overview  Â
11.2. Competitive Analysis  Â
11.3. Market share Analysis  Â
11.4. Major Growth Strategy in the Green Steel Market  Â
11.5. Competitive Benchmarking  Â
11.6. Leading Players in Terms of Number of Developments in the Green Steel Market  Â
11.7. Key developments and growth strategies Â
11.7.1. New Product Launch/Service Deployment    Â
11.7.2. Merger & Acquisitions    Â
11.7.3. Joint Ventures     Â
11.8. Major Players Financial Matrix  Â
11.8.1. Sales and Operating Income    Â
11.8.2. Major Players R&D Expenditure. 2023Â Â Â Â Â Â Â Â
12. COMPANY PROFILESÂ Â
12.1. Tata Steel Â
12.1.1. Financial Overview    Â
12.1.2. Products Offered    Â
12.1.3. Key Developments    Â
12.1.4. SWOT Analysis    Â
12.1.5. Key Strategies     Â
12.2. Hyundai Steel Â
12.2.1. Financial Overview    Â
12.2.2. Products Offered    Â
12.2.3. Key Developments    Â
12.2.4. SWOT Analysis    Â
12.2.5. Key Strategies     Â
12.3. POSCOÂ Â
12.3.1. Financial Overview    Â
12.3.2. Products Offered    Â
12.3.3. Key Developments    Â
12.3.4. SWOT Analysis    Â
12.3.5. Key Strategies     Â
12.4. Thyssenkrupp Â
12.4.1. Financial Overview    Â
12.4.2. Products Offered    Â
12.4.3. Key Developments    Â
12.4.4. SWOT Analysis    Â
12.4.5. Key Strategies     Â
12.5. ArcelorMittal Â
12.5.1. Financial Overview    Â
12.5.2. Products Offered    Â
12.5.3. Key Developments    Â
12.5.4. SWOT Analysis    Â
12.5.5. Key Strategies     Â
12.6. H2 Green Steel Â
12.6.1. Financial Overview    Â
12.6.2. Products Offered    Â
12.6.3. Key Developments    Â
12.6.4. SWOT Analysis    Â
12.6.5. Key Strategies     Â
12.7. Steel Dynamics Â
12.7.1. Financial Overview    Â
12.7.2. Products Offered    Â
12.7.3. Key Developments    Â
12.7.4. SWOT Analysis    Â
12.7.5. Key Strategies     Â
12.8. Nucor Â
12.8.1. Financial Overview    Â
12.8.2. Products Offered    Â
12.8.3. Key Developments    Â
12.8.4. SWOT Analysis    Â
12.8.5. Key Strategies     Â
12.9. ClevelandCliffs Â
12.9.1. Financial Overview    Â
12.9.2. Products Offered    Â
12.9.3. Key Developments    Â
12.9.4. SWOT Analysis    Â
12.9.5. Key Strategies     Â
12.10. SAILÂ Â
12.10.1. Financial Overview    Â
12.10.2. Products Offered    Â
12.10.3. Key Developments    Â
12.10.4. SWOT Analysis    Â
12.10.5. Key Strategies     Â
12.11. SSABÂ Â
12.11.1. Financial Overview    Â
12.11.2. Products Offered    Â
12.11.3. Key Developments    Â
12.11.4. SWOT Analysis    Â
12.11.5. Key Strategies     Â
12.12. Voestalpine Â
12.12.1. Financial Overview    Â
12.12.2. Products Offered    Â
12.12.3. Key Developments    Â
12.12.4. SWOT Analysis    Â
12.12.5. Key Strategies     Â
12.13. John Wood Group Â
12.13.1. Financial Overview    Â
12.13.2. Products Offered    Â
12.13.3. Key Developments    Â
12.13.4. SWOT Analysis    Â
12.13.5. Key Strategies     Â
12.14. United States Steel Â
12.14.1. Financial Overview    Â
12.14.2. Products Offered    Â
12.14.3. Key Developments    Â
12.14.4. SWOT Analysis    Â
12.14.5. Key Strategies     Â
12.15. Sierra Steel Â
12.15.1. Financial Overview    Â
12.15.2. Products Offered    Â
12.15.3. Key Developments    Â
12.15.4. SWOT Analysis    Â
12.15.5. Key Strategies       Â
13. APPENDIXÂ Â
13.1. References  Â
13.2. Related Reports    Â
LIST OF TABLES
Â
TABLE 1. LIST OF ASSUMPTIONSÂ Â
TABLE 2. NORTH AMERICA GREEN STEEL MARKET SIZE ESTIMATES & FORECAST BY METHOD OF PRODUCTION 2019-2035 (USD BILLIONS)Â Â
TABLE 3. NORTH AMERICA GREEN STEEL MARKET SIZE ESTIMATES & FORECAST BY END USE INDUSTRY 2019-2035 (USD BILLIONS)Â Â
TABLE 4. NORTH AMERICA GREEN STEEL MARKET SIZE ESTIMATES & FORECAST BY FORM 2019-2035 (USD BILLIONS)Â Â
TABLE 5. NORTH AMERICA GREEN STEEL MARKET SIZE ESTIMATES & FORECAST BY QUALITY GRADE 2019-2035 (USD BILLIONS)Â Â
TABLE 6. NORTH AMERICA GREEN STEEL MARKET SIZE ESTIMATES & FORECAST BY REGIONAL 2019-2035 (USD BILLIONS)Â Â
TABLE 7. US GREEN STEEL MARKET SIZE ESTIMATES & FORECAST BY METHOD OF PRODUCTION 2019-2035 (USD BILLIONS)Â Â
TABLE 8. US GREEN STEEL MARKET SIZE ESTIMATES & FORECAST BY END USE INDUSTRY 2019-2035 (USD BILLIONS)Â Â
TABLE 9. US GREEN STEEL MARKET SIZE ESTIMATES & FORECAST BY FORM 2019-2035 (USD BILLIONS)Â Â
TABLE 10. US GREEN STEEL MARKET SIZE ESTIMATES & FORECAST BY QUALITY GRADE 2019-2035 (USD BILLIONS)Â Â
TABLE 11. US GREEN STEEL MARKET SIZE ESTIMATES & FORECAST BY REGIONAL 2019-2035 (USD BILLIONS)Â Â
TABLE 12. CANADA GREEN STEEL MARKET SIZE ESTIMATES & FORECAST BY METHOD OF PRODUCTION 2019-2035 (USD BILLIONS)Â Â
TABLE 13. CANADA GREEN STEEL MARKET SIZE ESTIMATES & FORECAST BY END USE INDUSTRY 2019-2035 (USD BILLIONS)Â Â
TABLE 14. CANADA GREEN STEEL MARKET SIZE ESTIMATES & FORECAST BY FORM 2019-2035 (USD BILLIONS)Â Â
TABLE 15. CANADA GREEN STEEL MARKET SIZE ESTIMATES & FORECAST BY QUALITY GRADE 2019-2035 (USD BILLIONS)Â Â
TABLE 16. CANADA GREEN STEEL MARKET SIZE ESTIMATES & FORECAST BY REGIONAL 2019-2035 (USD BILLIONS)Â Â
TABLE 17. EUROPE GREEN STEEL MARKET SIZE ESTIMATES & FORECAST BY METHOD OF PRODUCTION 2019-2035 (USD BILLIONS)Â Â
TABLE 18. EUROPE GREEN STEEL MARKET SIZE ESTIMATES & FORECAST BY END USE INDUSTRY 2019-2035 (USD BILLIONS)Â Â
TABLE 19. EUROPE GREEN STEEL MARKET SIZE ESTIMATES & FORECAST BY FORM 2019-2035 (USD BILLIONS)Â Â
TABLE 20. EUROPE GREEN STEEL MARKET SIZE ESTIMATES & FORECAST BY QUALITY GRADE 2019-2035 (USD BILLIONS)Â Â
TABLE 21. EUROPE GREEN STEEL MARKET SIZE ESTIMATES & FORECAST BY REGIONAL 2019-2035 (USD BILLIONS)Â Â
TABLE 22. GERMANY GREEN STEEL MARKET SIZE ESTIMATES & FORECAST BY METHOD OF PRODUCTION 2019-2035 (USD BILLIONS)Â Â
TABLE 23. GERMANY GREEN STEEL MARKET SIZE ESTIMATES & FORECAST BY END USE INDUSTRY 2019-2035 (USD BILLIONS)Â Â
TABLE 24. GERMANY GREEN STEEL MARKET SIZE ESTIMATES & FORECAST BY FORM 2019-2035 (USD BILLIONS)Â Â
TABLE 25. GERMANY GREEN STEEL MARKET SIZE ESTIMATES & FORECAST BY QUALITY GRADE 2019-2035 (USD BILLIONS)Â Â
TABLE 26. GERMANY GREEN STEEL MARKET SIZE ESTIMATES & FORECAST BY REGIONAL 2019-2035 (USD BILLIONS)Â Â
TABLE 27. UK GREEN STEEL MARKET SIZE ESTIMATES & FORECAST BY METHOD OF PRODUCTION 2019-2035 (USD BILLIONS)Â Â
TABLE 28. UK GREEN STEEL MARKET SIZE ESTIMATES & FORECAST BY END USE INDUSTRY 2019-2035 (USD BILLIONS)Â Â
TABLE 29. UK GREEN STEEL MARKET SIZE ESTIMATES & FORECAST BY FORM 2019-2035 (USD BILLIONS)Â Â
TABLE 30. UK GREEN STEEL MARKET SIZE ESTIMATES & FORECAST BY QUALITY GRADE 2019-2035 (USD BILLIONS)Â Â
TABLE 31. UK GREEN STEEL MARKET SIZE ESTIMATES & FORECAST BY REGIONAL 2019-2035 (USD BILLIONS)Â Â
TABLE 32. FRANCE GREEN STEEL MARKET SIZE ESTIMATES & FORECAST BY METHOD OF PRODUCTION 2019-2035 (USD BILLIONS)Â Â
TABLE 33. FRANCE GREEN STEEL MARKET SIZE ESTIMATES & FORECAST BY END USE INDUSTRY 2019-2035 (USD BILLIONS)Â Â
TABLE 34. FRANCE GREEN STEEL MARKET SIZE ESTIMATES & FORECAST BY FORM 2019-2035 (USD BILLIONS)Â Â
TABLE 35. FRANCE GREEN STEEL MARKET SIZE ESTIMATES & FORECAST BY QUALITY GRADE 2019-2035 (USD BILLIONS)Â Â
TABLE 36. FRANCE GREEN STEEL MARKET SIZE ESTIMATES & FORECAST BY REGIONAL 2019-2035 (USD BILLIONS)Â Â
TABLE 37. RUSSIA GREEN STEEL MARKET SIZE ESTIMATES & FORECAST BY METHOD OF PRODUCTION 2019-2035 (USD BILLIONS)Â Â
TABLE 38. RUSSIA GREEN STEEL MARKET SIZE ESTIMATES & FORECAST BY END USE INDUSTRY 2019-2035 (USD BILLIONS)Â Â
TABLE 39. RUSSIA GREEN STEEL MARKET SIZE ESTIMATES & FORECAST BY FORM 2019-2035 (USD BILLIONS)Â Â
TABLE 40. RUSSIA GREEN STEEL MARKET SIZE ESTIMATES & FORECAST BY QUALITY GRADE 2019-2035 (USD BILLIONS)Â Â
TABLE 41. RUSSIA GREEN STEEL MARKET SIZE ESTIMATES & FORECAST BY REGIONAL 2019-2035 (USD BILLIONS)Â Â
TABLE 42. ITALY GREEN STEEL MARKET SIZE ESTIMATES & FORECAST BY METHOD OF PRODUCTION 2019-2035 (USD BILLIONS)Â Â
TABLE 43. ITALY GREEN STEEL MARKET SIZE ESTIMATES & FORECAST BY END USE INDUSTRY 2019-2035 (USD BILLIONS)Â Â
TABLE 44. ITALY GREEN STEEL MARKET SIZE ESTIMATES & FORECAST BY FORM 2019-2035 (USD BILLIONS)Â Â
TABLE 45. ITALY GREEN STEEL MARKET SIZE ESTIMATES & FORECAST BY QUALITY GRADE 2019-2035 (USD BILLIONS)Â Â
TABLE 46. ITALY GREEN STEEL MARKET SIZE ESTIMATES & FORECAST BY REGIONAL 2019-2035 (USD BILLIONS)Â Â
TABLE 47. SPAIN GREEN STEEL MARKET SIZE ESTIMATES & FORECAST BY METHOD OF PRODUCTION 2019-2035 (USD BILLIONS)Â Â
TABLE 48. SPAIN GREEN STEEL MARKET SIZE ESTIMATES & FORECAST BY END USE INDUSTRY 2019-2035 (USD BILLIONS)Â Â
TABLE 49. SPAIN GREEN STEEL MARKET SIZE ESTIMATES & FORECAST BY FORM 2019-2035 (USD BILLIONS)Â Â
TABLE 50. SPAIN GREEN STEEL MARKET SIZE ESTIMATES & FORECAST BY QUALITY GRADE 2019-2035 (USD BILLIONS)Â Â
TABLE 51. SPAIN GREEN STEEL MARKET SIZE ESTIMATES & FORECAST BY REGIONAL 2019-2035 (USD BILLIONS)Â Â
TABLE 52. REST OF EUROPE GREEN STEEL MARKET SIZE ESTIMATES & FORECAST BY METHOD OF PRODUCTION 2019-2035 (USD BILLIONS)Â Â
TABLE 53. REST OF EUROPE GREEN STEEL MARKET SIZE ESTIMATES & FORECAST BY END USE INDUSTRY 2019-2035 (USD BILLIONS)Â Â
TABLE 54. REST OF EUROPE GREEN STEEL MARKET SIZE ESTIMATES & FORECAST BY FORM 2019-2035 (USD BILLIONS)Â Â
TABLE 55. REST OF EUROPE GREEN STEEL MARKET SIZE ESTIMATES & FORECAST BY QUALITY GRADE 2019-2035 (USD BILLIONS)Â Â
TABLE 56. REST OF EUROPE GREEN STEEL MARKET SIZE ESTIMATES & FORECAST BY REGIONAL 2019-2035 (USD BILLIONS)Â Â
TABLE 57. APAC GREEN STEEL MARKET SIZE ESTIMATES & FORECAST BY METHOD OF PRODUCTION 2019-2035 (USD BILLIONS)Â Â
TABLE 58. APAC GREEN STEEL MARKET SIZE ESTIMATES & FORECAST BY END USE INDUSTRY 2019-2035 (USD BILLIONS)Â Â
TABLE 59. APAC GREEN STEEL MARKET SIZE ESTIMATES & FORECAST BY FORM 2019-2035 (USD BILLIONS)Â Â
TABLE 60. APAC GREEN STEEL MARKET SIZE ESTIMATES & FORECAST BY QUALITY GRADE 2019-2035 (USD BILLIONS)Â Â
TABLE 61. APAC GREEN STEEL MARKET SIZE ESTIMATES & FORECAST BY REGIONAL 2019-2035 (USD BILLIONS)Â Â
TABLE 62. CHINA GREEN STEEL MARKET SIZE ESTIMATES & FORECAST BY METHOD OF PRODUCTION 2019-2035 (USD BILLIONS)Â Â
TABLE 63. CHINA GREEN STEEL MARKET SIZE ESTIMATES & FORECAST BY END USE INDUSTRY 2019-2035 (USD BILLIONS)Â Â
TABLE 64. CHINA GREEN STEEL MARKET SIZE ESTIMATES & FORECAST BY FORM 2019-2035 (USD BILLIONS)Â Â
TABLE 65. CHINA GREEN STEEL MARKET SIZE ESTIMATES & FORECAST BY QUALITY GRADE 2019-2035 (USD BILLIONS)Â Â
TABLE 66. CHINA GREEN STEEL MARKET SIZE ESTIMATES & FORECAST BY REGIONAL 2019-2035 (USD BILLIONS)Â Â
TABLE 67. INDIA GREEN STEEL MARKET SIZE ESTIMATES & FORECAST BY METHOD OF PRODUCTION 2019-2035 (USD BILLIONS)Â Â
TABLE 68. INDIA GREEN STEEL MARKET SIZE ESTIMATES & FORECAST BY END USE INDUSTRY 2019-2035 (USD BILLIONS)Â Â
TABLE 69. INDIA GREEN STEEL MARKET SIZE ESTIMATES & FORECAST BY FORM 2019-2035 (USD BILLIONS)Â Â
TABLE 70. INDIA GREEN STEEL MARKET SIZE ESTIMATES & FORECAST BY QUALITY GRADE 2019-2035 (USD BILLIONS)Â Â
TABLE 71. INDIA GREEN STEEL MARKET SIZE ESTIMATES & FORECAST BY REGIONAL 2019-2035 (USD BILLIONS)Â Â
TABLE 72. JAPAN GREEN STEEL MARKET SIZE ESTIMATES & FORECAST BY METHOD OF PRODUCTION 2019-2035 (USD BILLIONS)Â Â
TABLE 73. JAPAN GREEN STEEL MARKET SIZE ESTIMATES & FORECAST BY END USE INDUSTRY 2019-2035 (USD BILLIONS)Â Â
TABLE 74. JAPAN GREEN STEEL MARKET SIZE ESTIMATES & FORECAST BY FORM 2019-2035 (USD BILLIONS)Â Â
TABLE 75. JAPAN GREEN STEEL MARKET SIZE ESTIMATES & FORECAST BY QUALITY GRADE 2019-2035 (USD BILLIONS)Â Â
TABLE 76. JAPAN GREEN STEEL MARKET SIZE ESTIMATES & FORECAST BY REGIONAL 2019-2035 (USD BILLIONS)Â Â
TABLE 77. SOUTH KOREA GREEN STEEL MARKET SIZE ESTIMATES & FORECAST BY METHOD OF PRODUCTION 2019-2035 (USD BILLIONS)Â Â
TABLE 78. SOUTH KOREA GREEN STEEL MARKET SIZE ESTIMATES & FORECAST BY END USE INDUSTRY 2019-2035 (USD BILLIONS)Â Â
TABLE 79. SOUTH KOREA GREEN STEEL MARKET SIZE ESTIMATES & FORECAST BY FORM 2019-2035 (USD BILLIONS)Â Â
TABLE 80. SOUTH KOREA GREEN STEEL MARKET SIZE ESTIMATES & FORECAST BY QUALITY GRADE 2019-2035 (USD BILLIONS)Â Â
TABLE 81. SOUTH KOREA GREEN STEEL MARKET SIZE ESTIMATES & FORECAST BY REGIONAL 2019-2035 (USD BILLIONS)Â Â
TABLE 82. MALAYSIA GREEN STEEL MARKET SIZE ESTIMATES & FORECAST BY METHOD OF PRODUCTION 2019-2035 (USD BILLIONS)Â Â
TABLE 83. MALAYSIA GREEN STEEL MARKET SIZE ESTIMATES & FORECAST BY END USE INDUSTRY 2019-2035 (USD BILLIONS)Â Â
TABLE 84. MALAYSIA GREEN STEEL MARKET SIZE ESTIMATES & FORECAST BY FORM 2019-2035 (USD BILLIONS)Â Â
TABLE 85. MALAYSIA GREEN STEEL MARKET SIZE ESTIMATES & FORECAST BY QUALITY GRADE 2019-2035 (USD BILLIONS)Â Â
TABLE 86. MALAYSIA GREEN STEEL MARKET SIZE ESTIMATES & FORECAST BY REGIONAL 2019-2035 (USD BILLIONS)Â Â
TABLE 87. THAILAND GREEN STEEL MARKET SIZE ESTIMATES & FORECAST BY METHOD OF PRODUCTION 2019-2035 (USD BILLIONS)Â Â
TABLE 88. THAILAND GREEN STEEL MARKET SIZE ESTIMATES & FORECAST BY END USE INDUSTRY 2019-2035 (USD BILLIONS)Â Â
TABLE 89. THAILAND GREEN STEEL MARKET SIZE ESTIMATES & FORECAST BY FORM 2019-2035 (USD BILLIONS)Â Â
TABLE 90. THAILAND GREEN STEEL MARKET SIZE ESTIMATES & FORECAST BY QUALITY GRADE 2019-2035 (USD BILLIONS)Â Â
TABLE 91. THAILAND GREEN STEEL MARKET SIZE ESTIMATES & FORECAST BY REGIONAL 2019-2035 (USD BILLIONS)Â Â
TABLE 92. INDONESIA GREEN STEEL MARKET SIZE ESTIMATES & FORECAST BY METHOD OF PRODUCTION 2019-2035 (USD BILLIONS)Â Â
TABLE 93. INDONESIA GREEN STEEL MARKET SIZE ESTIMATES & FORECAST BY END USE INDUSTRY 2019-2035 (USD BILLIONS)Â Â
TABLE 94. INDONESIA GREEN STEEL MARKET SIZE ESTIMATES & FORECAST BY FORM 2019-2035 (USD BILLIONS)Â Â
TABLE 95. INDONESIA GREEN STEEL MARKET SIZE ESTIMATES & FORECAST BY QUALITY GRADE 2019-2035 (USD BILLIONS)Â Â
TABLE 96. INDONESIA GREEN STEEL MARKET SIZE ESTIMATES & FORECAST BY REGIONAL 2019-2035 (USD BILLIONS)Â Â
TABLE 97. REST OF APAC GREEN STEEL MARKET SIZE ESTIMATES & FORECAST BY METHOD OF PRODUCTION 2019-2035 (USD BILLIONS)Â Â
TABLE 98. REST OF APAC GREEN STEEL MARKET SIZE ESTIMATES & FORECAST BY END USE INDUSTRY 2019-2035 (USD BILLIONS)Â Â
TABLE 99. REST OF APAC GREEN STEEL MARKET SIZE ESTIMATES & FORECAST BY FORM 2019-2035 (USD BILLIONS)Â Â
TABLE 100. REST OF APAC GREEN STEEL MARKET SIZE ESTIMATES & FORECAST BY QUALITY GRADE 2019-2035 (USD BILLIONS)Â Â
TABLE 101. REST OF APAC GREEN STEEL MARKET SIZE ESTIMATES & FORECAST BY REGIONAL 2019-2035 (USD BILLIONS)Â Â
TABLE 102. SOUTH AMERICA GREEN STEEL MARKET SIZE ESTIMATES & FORECAST BY METHOD OF PRODUCTION 2019-2035 (USD BILLIONS)Â Â
TABLE 103. SOUTH AMERICA GREEN STEEL MARKET SIZE ESTIMATES & FORECAST BY END USE INDUSTRY 2019-2035 (USD BILLIONS)Â Â
TABLE 104. SOUTH AMERICA GREEN STEEL MARKET SIZE ESTIMATES & FORECAST BY FORM 2019-2035 (USD BILLIONS)Â Â
TABLE 105. SOUTH AMERICA GREEN STEEL MARKET SIZE ESTIMATES & FORECAST BY QUALITY GRADE 2019-2035 (USD BILLIONS)Â Â
TABLE 106. SOUTH AMERICA GREEN STEEL MARKET SIZE ESTIMATES & FORECAST BY REGIONAL 2019-2035 (USD BILLIONS)Â Â
TABLE 107. BRAZIL GREEN STEEL MARKET SIZE ESTIMATES & FORECAST BY METHOD OF PRODUCTION 2019-2035 (USD BILLIONS)Â Â
TABLE 108. BRAZIL GREEN STEEL MARKET SIZE ESTIMATES & FORECAST BY END USE INDUSTRY 2019-2035 (USD BILLIONS)Â Â
TABLE 109. BRAZIL GREEN STEEL MARKET SIZE ESTIMATES & FORECAST BY FORM 2019-2035 (USD BILLIONS)Â Â
TABLE 110. BRAZIL GREEN STEEL MARKET SIZE ESTIMATES & FORECAST BY QUALITY GRADE 2019-2035 (USD BILLIONS)Â Â
TABLE 111. BRAZIL GREEN STEEL MARKET SIZE ESTIMATES & FORECAST BY REGIONAL 2019-2035 (USD BILLIONS)Â Â
TABLE 112. MEXICO GREEN STEEL MARKET SIZE ESTIMATES & FORECAST BY METHOD OF PRODUCTION 2019-2035 (USD BILLIONS)Â Â
TABLE 113. MEXICO GREEN STEEL MARKET SIZE ESTIMATES & FORECAST BY END USE INDUSTRY 2019-2035 (USD BILLIONS)Â Â
TABLE 114. MEXICO GREEN STEEL MARKET SIZE ESTIMATES & FORECAST BY FORM 2019-2035 (USD BILLIONS)Â Â
TABLE 115. MEXICO GREEN STEEL MARKET SIZE ESTIMATES & FORECAST BY QUALITY GRADE 2019-2035 (USD BILLIONS)Â Â
TABLE 116. MEXICO GREEN STEEL MARKET SIZE ESTIMATES & FORECAST BY REGIONAL 2019-2035 (USD BILLIONS)Â Â
TABLE 117. ARGENTINA GREEN STEEL MARKET SIZE ESTIMATES & FORECAST BY METHOD OF PRODUCTION 2019-2035 (USD BILLIONS)Â Â
TABLE 118. ARGENTINA GREEN STEEL MARKET SIZE ESTIMATES & FORECAST BY END USE INDUSTRY 2019-2035 (USD BILLIONS)Â Â
TABLE 119. ARGENTINA GREEN STEEL MARKET SIZE ESTIMATES & FORECAST BY FORM 2019-2035 (USD BILLIONS)Â Â
TABLE 120. ARGENTINA GREEN STEEL MARKET SIZE ESTIMATES & FORECAST BY QUALITY GRADE 2019-2035 (USD BILLIONS)Â Â
TABLE 121. ARGENTINA GREEN STEEL MARKET SIZE ESTIMATES & FORECAST BY REGIONAL 2019-2035 (USD BILLIONS)Â Â
TABLE 122. REST OF SOUTH AMERICA GREEN STEEL MARKET SIZE ESTIMATES & FORECAST BY METHOD OF PRODUCTION 2019-2035 (USD BILLIONS)Â Â
TABLE 123. REST OF SOUTH AMERICA GREEN STEEL MARKET SIZE ESTIMATES & FORECAST BY END USE INDUSTRY 2019-2035 (USD BILLIONS)Â Â
TABLE 124. REST OF SOUTH AMERICA GREEN STEEL MARKET SIZE ESTIMATES & FORECAST BY FORM 2019-2035 (USD BILLIONS)Â Â
TABLE 125. REST OF SOUTH AMERICA GREEN STEEL MARKET SIZE ESTIMATES & FORECAST BY QUALITY GRADE 2019-2035 (USD BILLIONS)Â Â
TABLE 126. REST OF SOUTH AMERICA GREEN STEEL MARKET SIZE ESTIMATES & FORECAST BY REGIONAL 2019-2035 (USD BILLIONS)Â Â
TABLE 127. MEA GREEN STEEL MARKET SIZE ESTIMATES & FORECAST BY METHOD OF PRODUCTION 2019-2035 (USD BILLIONS)Â Â
TABLE 128. MEA GREEN STEEL MARKET SIZE ESTIMATES & FORECAST BY END USE INDUSTRY 2019-2035 (USD BILLIONS)Â Â
TABLE 129. MEA GREEN STEEL MARKET SIZE ESTIMATES & FORECAST BY FORM 2019-2035 (USD BILLIONS)Â Â
TABLE 130. MEA GREEN STEEL MARKET SIZE ESTIMATES & FORECAST BY QUALITY GRADE 2019-2035 (USD BILLIONS)Â Â
TABLE 131. MEA GREEN STEEL MARKET SIZE ESTIMATES & FORECAST BY REGIONAL 2019-2035 (USD BILLIONS)Â Â
TABLE 132. GCC COUNTRIES GREEN STEEL MARKET SIZE ESTIMATES & FORECAST BY METHOD OF PRODUCTION 2019-2035 (USD BILLIONS)Â Â
TABLE 133. GCC COUNTRIES GREEN STEEL MARKET SIZE ESTIMATES & FORECAST BY END USE INDUSTRY 2019-2035 (USD BILLIONS)Â Â
TABLE 134. GCC COUNTRIES GREEN STEEL MARKET SIZE ESTIMATES & FORECAST BY FORM 2019-2035 (USD BILLIONS)Â Â
TABLE 135. GCC COUNTRIES GREEN STEEL MARKET SIZE ESTIMATES & FORECAST BY QUALITY GRADE 2019-2035 (USD BILLIONS)Â Â
TABLE 136. GCC COUNTRIES GREEN STEEL MARKET SIZE ESTIMATES & FORECAST BY REGIONAL 2019-2035 (USD BILLIONS)Â Â
TABLE 137. SOUTH AFRICA GREEN STEEL MARKET SIZE ESTIMATES & FORECAST BY METHOD OF PRODUCTION 2019-2035 (USD BILLIONS)Â Â
TABLE 138. SOUTH AFRICA GREEN STEEL MARKET SIZE ESTIMATES & FORECAST BY END USE INDUSTRY 2019-2035 (USD BILLIONS)Â Â
TABLE 139. SOUTH AFRICA GREEN STEEL MARKET SIZE ESTIMATES & FORECAST BY FORM 2019-2035 (USD BILLIONS)Â Â
TABLE 140. SOUTH AFRICA GREEN STEEL MARKET SIZE ESTIMATES & FORECAST BY QUALITY GRADE 2019-2035 (USD BILLIONS)Â Â
TABLE 141. SOUTH AFRICA GREEN STEEL MARKET SIZE ESTIMATES & FORECAST BY REGIONAL 2019-2035 (USD BILLIONS)Â Â
TABLE 142. REST OF MEA GREEN STEEL MARKET SIZE ESTIMATES & FORECAST BY METHOD OF PRODUCTION 2019-2035 (USD BILLIONS)Â Â
TABLE 143. REST OF MEA GREEN STEEL MARKET SIZE ESTIMATES & FORECAST BY END USE INDUSTRY 2019-2035 (USD BILLIONS)Â Â
TABLE 144. REST OF MEA GREEN STEEL MARKET SIZE ESTIMATES & FORECAST BY FORM 2019-2035 (USD BILLIONS)Â Â
TABLE 145. REST OF MEA GREEN STEEL MARKET SIZE ESTIMATES & FORECAST BY QUALITY GRADE 2019-2035 (USD BILLIONS)Â Â
TABLE 146. REST OF MEA GREEN STEEL MARKET SIZE ESTIMATES & FORECAST BY REGIONAL 2019-2035 (USD BILLIONS)Â Â
TABLE 147. PRODUCT LAUNCH/PRODUCT DEVELOPMENT/APPROVALÂ Â
TABLE 148. ACQUISITION/PARTNERSHIPÂ Â
Â
Â
Â
Â
Â
Â
Â
Â
Â
Â
Â
Â
Â
Â
Â
Â
Â
Â
Â
Â
Â
Â
Â
Â
Â
Â
Â
Â
Â
Â
Â
Â
Â
Â
Â
Â
Â
Â
Â
Â
Â
Â
Â
LIST OF FIGURES
Â
FIGURE 1. MARKET SYNOPSISÂ
FIGURE 2. NORTH AMERICA GREEN STEEL MARKET ANALYSISÂ
FIGURE 3. US GREEN STEEL MARKET ANALYSIS BY METHOD OF PRODUCTIONÂ
FIGURE 4. US GREEN STEEL MARKET ANALYSIS BY END USE INDUSTRYÂ
FIGURE 5. US GREEN STEEL MARKET ANALYSIS BY FORMÂ
FIGURE 6. US GREEN STEEL MARKET ANALYSIS BY QUALITY GRADEÂ
FIGURE 7. US GREEN STEEL MARKET ANALYSIS BY REGIONALÂ
FIGURE 8. CANADA GREEN STEEL MARKET ANALYSIS BY METHOD OF PRODUCTIONÂ
FIGURE 9. CANADA GREEN STEEL MARKET ANALYSIS BY END USE INDUSTRYÂ
FIGURE 10. CANADA GREEN STEEL MARKET ANALYSIS BY FORMÂ
FIGURE 11. CANADA GREEN STEEL MARKET ANALYSIS BY QUALITY GRADEÂ
FIGURE 12. CANADA GREEN STEEL MARKET ANALYSIS BY REGIONALÂ
FIGURE 13. EUROPE GREEN STEEL MARKET ANALYSISÂ
FIGURE 14. GERMANY GREEN STEEL MARKET ANALYSIS BY METHOD OF PRODUCTIONÂ
FIGURE 15. GERMANY GREEN STEEL MARKET ANALYSIS BY END USE INDUSTRYÂ
FIGURE 16. GERMANY GREEN STEEL MARKET ANALYSIS BY FORMÂ
FIGURE 17. GERMANY GREEN STEEL MARKET ANALYSIS BY QUALITY GRADEÂ
FIGURE 18. GERMANY GREEN STEEL MARKET ANALYSIS BY REGIONALÂ
FIGURE 19. UK GREEN STEEL MARKET ANALYSIS BY METHOD OF PRODUCTIONÂ
FIGURE 20. UK GREEN STEEL MARKET ANALYSIS BY END USE INDUSTRYÂ
FIGURE 21. UK GREEN STEEL MARKET ANALYSIS BY FORMÂ
FIGURE 22. UK GREEN STEEL MARKET ANALYSIS BY QUALITY GRADEÂ
FIGURE 23. UK GREEN STEEL MARKET ANALYSIS BY REGIONALÂ
FIGURE 24. FRANCE GREEN STEEL MARKET ANALYSIS BY METHOD OF PRODUCTIONÂ
FIGURE 25. FRANCE GREEN STEEL MARKET ANALYSIS BY END USE INDUSTRYÂ
FIGURE 26. FRANCE GREEN STEEL MARKET ANALYSIS BY FORMÂ
FIGURE 27. FRANCE GREEN STEEL MARKET ANALYSIS BY QUALITY GRADEÂ
FIGURE 28. FRANCE GREEN STEEL MARKET ANALYSIS BY REGIONALÂ
FIGURE 29. RUSSIA GREEN STEEL MARKET ANALYSIS BY METHOD OF PRODUCTIONÂ
FIGURE 30. RUSSIA GREEN STEEL MARKET ANALYSIS BY END USE INDUSTRYÂ
FIGURE 31. RUSSIA GREEN STEEL MARKET ANALYSIS BY FORMÂ
FIGURE 32. RUSSIA GREEN STEEL MARKET ANALYSIS BY QUALITY GRADEÂ
FIGURE 33. RUSSIA GREEN STEEL MARKET ANALYSIS BY REGIONALÂ
FIGURE 34. ITALY GREEN STEEL MARKET ANALYSIS BY METHOD OF PRODUCTIONÂ
FIGURE 35. ITALY GREEN STEEL MARKET ANALYSIS BY END USE INDUSTRYÂ
FIGURE 36. ITALY GREEN STEEL MARKET ANALYSIS BY FORMÂ
FIGURE 37. ITALY GREEN STEEL MARKET ANALYSIS BY QUALITY GRADEÂ
FIGURE 38. ITALY GREEN STEEL MARKET ANALYSIS BY REGIONALÂ
FIGURE 39. SPAIN GREEN STEEL MARKET ANALYSIS BY METHOD OF PRODUCTIONÂ
FIGURE 40. SPAIN GREEN STEEL MARKET ANALYSIS BY END USE INDUSTRYÂ
FIGURE 41. SPAIN GREEN STEEL MARKET ANALYSIS BY FORMÂ
FIGURE 42. SPAIN GREEN STEEL MARKET ANALYSIS BY QUALITY GRADEÂ
FIGURE 43. SPAIN GREEN STEEL MARKET ANALYSIS BY REGIONALÂ
FIGURE 44. REST OF EUROPE GREEN STEEL MARKET ANALYSIS BY METHOD OF PRODUCTIONÂ
FIGURE 45. REST OF EUROPE GREEN STEEL MARKET ANALYSIS BY END USE INDUSTRYÂ
FIGURE 46. REST OF EUROPE GREEN STEEL MARKET ANALYSIS BY FORMÂ
FIGURE 47. REST OF EUROPE GREEN STEEL MARKET ANALYSIS BY QUALITY GRADEÂ
FIGURE 48. REST OF EUROPE GREEN STEEL MARKET ANALYSIS BY REGIONALÂ
FIGURE 49. APAC GREEN STEEL MARKET ANALYSISÂ
FIGURE 50. CHINA GREEN STEEL MARKET ANALYSIS BY METHOD OF PRODUCTIONÂ
FIGURE 51. CHINA GREEN STEEL MARKET ANALYSIS BY END USE INDUSTRYÂ
FIGURE 52. CHINA GREEN STEEL MARKET ANALYSIS BY FORMÂ
FIGURE 53. CHINA GREEN STEEL MARKET ANALYSIS BY QUALITY GRADEÂ
FIGURE 54. CHINA GREEN STEEL MARKET ANALYSIS BY REGIONALÂ
FIGURE 55. INDIA GREEN STEEL MARKET ANALYSIS BY METHOD OF PRODUCTIONÂ
FIGURE 56. INDIA GREEN STEEL MARKET ANALYSIS BY END USE INDUSTRYÂ
FIGURE 57. INDIA GREEN STEEL MARKET ANALYSIS BY FORMÂ
FIGURE 58. INDIA GREEN STEEL MARKET ANALYSIS BY QUALITY GRADEÂ
FIGURE 59. INDIA GREEN STEEL MARKET ANALYSIS BY REGIONALÂ
FIGURE 60. JAPAN GREEN STEEL MARKET ANALYSIS BY METHOD OF PRODUCTIONÂ
FIGURE 61. JAPAN GREEN STEEL MARKET ANALYSIS BY END USE INDUSTRYÂ
FIGURE 62. JAPAN GREEN STEEL MARKET ANALYSIS BY FORMÂ
FIGURE 63. JAPAN GREEN STEEL MARKET ANALYSIS BY QUALITY GRADEÂ
FIGURE 64. JAPAN GREEN STEEL MARKET ANALYSIS BY REGIONALÂ
FIGURE 65. SOUTH KOREA GREEN STEEL MARKET ANALYSIS BY METHOD OF PRODUCTIONÂ
FIGURE 66. SOUTH KOREA GREEN STEEL MARKET ANALYSIS BY END USE INDUSTRYÂ
FIGURE 67. SOUTH KOREA GREEN STEEL MARKET ANALYSIS BY FORMÂ
FIGURE 68. SOUTH KOREA GREEN STEEL MARKET ANALYSIS BY QUALITY GRADEÂ
FIGURE 69. SOUTH KOREA GREEN STEEL MARKET ANALYSIS BY REGIONALÂ
FIGURE 70. MALAYSIA GREEN STEEL MARKET ANALYSIS BY METHOD OF PRODUCTIONÂ
FIGURE 71. MALAYSIA GREEN STEEL MARKET ANALYSIS BY END USE INDUSTRYÂ
FIGURE 72. MALAYSIA GREEN STEEL MARKET ANALYSIS BY FORMÂ
FIGURE 73. MALAYSIA GREEN STEEL MARKET ANALYSIS BY QUALITY GRADEÂ
FIGURE 74. MALAYSIA GREEN STEEL MARKET ANALYSIS BY REGIONALÂ
FIGURE 75. THAILAND GREEN STEEL MARKET ANALYSIS BY METHOD OF PRODUCTIONÂ
FIGURE 76. THAILAND GREEN STEEL MARKET ANALYSIS BY END USE INDUSTRYÂ
FIGURE 77. THAILAND GREEN STEEL MARKET ANALYSIS BY FORMÂ
FIGURE 78. THAILAND GREEN STEEL MARKET ANALYSIS BY QUALITY GRADEÂ
FIGURE 79. THAILAND GREEN STEEL MARKET ANALYSIS BY REGIONALÂ
FIGURE 80. INDONESIA GREEN STEEL MARKET ANALYSIS BY METHOD OF PRODUCTIONÂ
FIGURE 81. INDONESIA GREEN STEEL MARKET ANALYSIS BY END USE INDUSTRYÂ
FIGURE 82. INDONESIA GREEN STEEL MARKET ANALYSIS BY FORMÂ
FIGURE 83. INDONESIA GREEN STEEL MARKET ANALYSIS BY QUALITY GRADEÂ
FIGURE 84. INDONESIA GREEN STEEL MARKET ANALYSIS BY REGIONALÂ
FIGURE 85. REST OF APAC GREEN STEEL MARKET ANALYSIS BY METHOD OF PRODUCTIONÂ
FIGURE 86. REST OF APAC GREEN STEEL MARKET ANALYSIS BY END USE INDUSTRYÂ
FIGURE 87. REST OF APAC GREEN STEEL MARKET ANALYSIS BY FORMÂ
FIGURE 88. REST OF APAC GREEN STEEL MARKET ANALYSIS BY QUALITY GRADEÂ
FIGURE 89. REST OF APAC GREEN STEEL MARKET ANALYSIS BY REGIONALÂ
FIGURE 90. SOUTH AMERICA GREEN STEEL MARKET ANALYSISÂ
FIGURE 91. BRAZIL GREEN STEEL MARKET ANALYSIS BY METHOD OF PRODUCTIONÂ
FIGURE 92. BRAZIL GREEN STEEL MARKET ANALYSIS BY END USE INDUSTRYÂ
FIGURE 93. BRAZIL GREEN STEEL MARKET ANALYSIS BY FORMÂ
FIGURE 94. BRAZIL GREEN STEEL MARKET ANALYSIS BY QUALITY GRADEÂ
FIGURE 95. BRAZIL GREEN STEEL MARKET ANALYSIS BY REGIONALÂ
FIGURE 96. MEXICO GREEN STEEL MARKET ANALYSIS BY METHOD OF PRODUCTIONÂ
FIGURE 97. MEXICO GREEN STEEL MARKET ANALYSIS BY END USE INDUSTRYÂ
FIGURE 98. MEXICO GREEN STEEL MARKET ANALYSIS BY FORMÂ
FIGURE 99. MEXICO GREEN STEEL MARKET ANALYSIS BY QUALITY GRADEÂ
FIGURE 100. MEXICO GREEN STEEL MARKET ANALYSIS BY REGIONALÂ
FIGURE 101. ARGENTINA GREEN STEEL MARKET ANALYSIS BY METHOD OF PRODUCTIONÂ
FIGURE 102. ARGENTINA GREEN STEEL MARKET ANALYSIS BY END USE INDUSTRYÂ
FIGURE 103. ARGENTINA GREEN STEEL MARKET ANALYSIS BY FORMÂ
FIGURE 104. ARGENTINA GREEN STEEL MARKET ANALYSIS BY QUALITY GRADEÂ
FIGURE 105. ARGENTINA GREEN STEEL MARKET ANALYSIS BY REGIONALÂ
FIGURE 106. REST OF SOUTH AMERICA GREEN STEEL MARKET ANALYSIS BY METHOD OF PRODUCTIONÂ
FIGURE 107. REST OF SOUTH AMERICA GREEN STEEL MARKET ANALYSIS BY END USE INDUSTRYÂ
FIGURE 108. REST OF SOUTH AMERICA GREEN STEEL MARKET ANALYSIS BY FORMÂ
FIGURE 109. REST OF SOUTH AMERICA GREEN STEEL MARKET ANALYSIS BY QUALITY GRADEÂ
FIGURE 110. REST OF SOUTH AMERICA GREEN STEEL MARKET ANALYSIS BY REGIONALÂ
FIGURE 111. MEA GREEN STEEL MARKET ANALYSISÂ
FIGURE 112. GCC COUNTRIES GREEN STEEL MARKET ANALYSIS BY METHOD OF PRODUCTIONÂ
FIGURE 113. GCC COUNTRIES GREEN STEEL MARKET ANALYSIS BY END USE INDUSTRYÂ
FIGURE 114. GCC COUNTRIES GREEN STEEL MARKET ANALYSIS BY FORMÂ
FIGURE 115. GCC COUNTRIES GREEN STEEL MARKET ANALYSIS BY QUALITY GRADEÂ
FIGURE 116. GCC COUNTRIES GREEN STEEL MARKET ANALYSIS BY REGIONALÂ
FIGURE 117. SOUTH AFRICA GREEN STEEL MARKET ANALYSIS BY METHOD OF PRODUCTIONÂ
FIGURE 118. SOUTH AFRICA GREEN STEEL MARKET ANALYSIS BY END USE INDUSTRYÂ
FIGURE 119. SOUTH AFRICA GREEN STEEL MARKET ANALYSIS BY FORMÂ
FIGURE 120. SOUTH AFRICA GREEN STEEL MARKET ANALYSIS BY QUALITY GRADEÂ
FIGURE 121. SOUTH AFRICA GREEN STEEL MARKET ANALYSIS BY REGIONALÂ
FIGURE 122. REST OF MEA GREEN STEEL MARKET ANALYSIS BY METHOD OF PRODUCTIONÂ
FIGURE 123. REST OF MEA GREEN STEEL MARKET ANALYSIS BY END USE INDUSTRYÂ
FIGURE 124. REST OF MEA GREEN STEEL MARKET ANALYSIS BY FORMÂ
FIGURE 125. REST OF MEA GREEN STEEL MARKET ANALYSIS BY QUALITY GRADEÂ
FIGURE 126. REST OF MEA GREEN STEEL MARKET ANALYSIS BY REGIONALÂ
FIGURE 127. KEY BUYING CRITERIA OF GREEN STEEL MARKETÂ
FIGURE 128. RESEARCH PROCESS OF MRFRÂ
FIGURE 129. DRO ANALYSIS OF GREEN STEEL MARKETÂ
FIGURE 130. DRIVERS IMPACT ANALYSIS GREEN STEEL MARKETÂ
FIGURE 131. RESTRAINTS IMPACT ANALYSIS GREEN STEEL MARKETÂ
FIGURE 132. SUPPLY / VALUE CHAIN GREEN STEEL MARKETÂ
FIGURE 133. GREEN STEEL MARKET BY METHOD OF PRODUCTION 2025 (% SHARE)Â
FIGURE 134. GREEN STEEL BY METHOD OF PRODUCTION 2019 TO 2035 (USD Billions)Â
FIGURE 135. GREEN STEEL BY END USE INDUSTRY 2025 (% SHARE)Â
FIGURE 136. GREEN STEEL BY END USE INDUSTRY 2019 TO 2035 (USD Billions)Â
FIGURE 137. GREEN STEEL BY FORM 2025 (% SHARE)Â
FIGURE 138. GREEN STEEL BY FORM 2019 TO 2035 (USD Billions)Â
FIGURE 139. GREEN STEEL BY QUALITY GRADE 2025 (% SHARE)Â
FIGURE 140. GREEN STEEL BY QUALITY GRADE 2019 TO 2035 (USD Billions)Â
FIGURE 141. GREEN STEEL BY REGIONAL 2025 (% SHARE)Â
FIGURE 142. GREEN STEEL BY REGIONAL 2019 TO 2035 (USD Billions)Â
FIGURE 143. BENCHMARKING OF MAJOR COMPETITORSÂ
Â