Head Mounted Display Market

Key Players: Meta Platforms, Sony Group, Apple Inc., Microsoft Corporation, ByteDance (Pico), Samsung Electronics, Vuzix Corporation, RealWear Inc.

Head Mounted Display Market

Head Mounted Display Market Size, Share and Research Report By Technology (Virtual Reality, Augmented Reality, Mixed Reality), By Connectivity (Wired/Tethered, Wireless/Standalone), By Product Type (Helmet-Mounted Displays, Wearable Glasses/Eyewear), By End User (Consumer, Enterprise & Industrial), By Application (Gaming, Media & Entertainment, Healthcare, Defense & Aerospace, Manufacturing & Field Service, Education & Training) and By Regional (North America, Europe, South America, Asia Pacific, Middle East and Africa) - Industry Forecast to 2035
ID: MRFR/SEM/10177-HCR
200 Pages
Aarti Dhapte, Aarti Dhapte
Last Updated: June 17, 2026
 

Head Mounted Display Market Summary

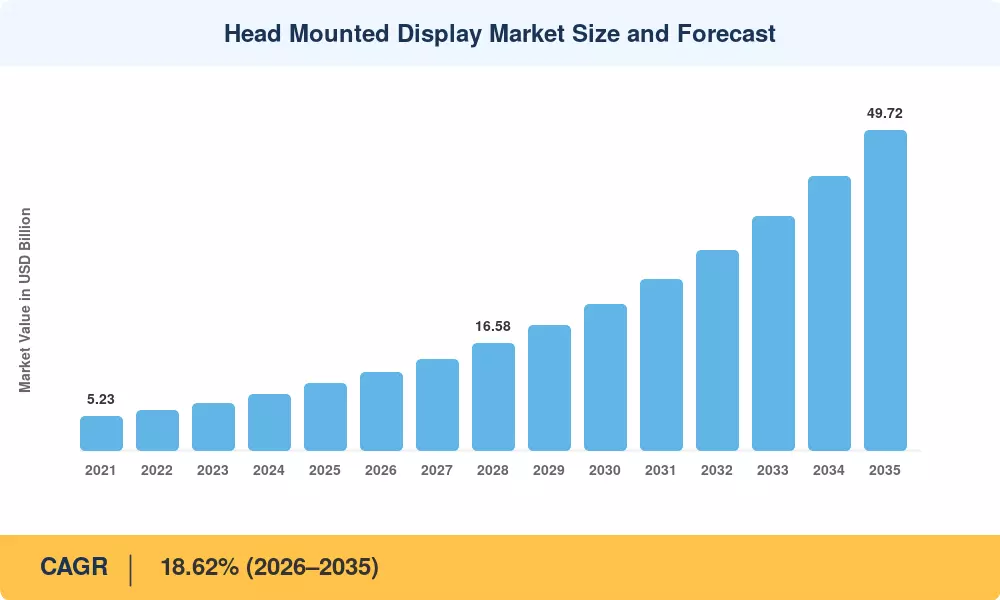
The Head Mounted Display Market reached USD 10.36 billion in 2025, with the forecast period beginning at USD 12.14 billion in 2026 and climbing to USD 49.72 billion by 2035 at an 18.62% CAGR. Defense modernization spending across NATO and Indo-Pacific alliances — exceeding USD 14 billion in combined mixed-reality helmet procurement budgets through 2030 — anchors this trajectory alongside expanding industrial metaverse programs that create diversified demand for immersive HMD devices[2]. The Head Mounted Display Market benefits from simultaneous pull across military, healthcare, and consumer entertainment verticals, a rare convergence that insulates the growth path from single-sector cyclicality.

A generational shift in near-eye display systems is replacing legacy binocular night-vision goggles and basic safety visors with sensor-fused, AI-enhanced headsets. The U.S. Army's Integrated Visual Augmentation System alone carries a USD 21.9 billion ceiling contract, while the European Commission's Horizon Europe program has earmarked over EUR 1.2 billion for XR research through 2027 [3][4]. Micro-OLED panels, foveated rendering engines, and pancake lens stacks are collapsing device weight below 300 grams, making wearable display technology practical for eight-hour surgical and field-service shifts.

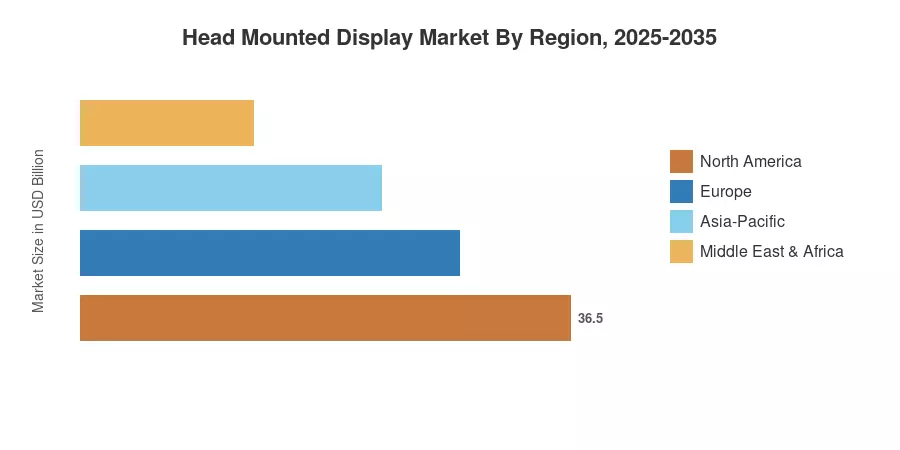
Asia-Pacific dominates with roughly 35.4% of global revenue, driven by Chinese OEM scale and Japan's precision optics supply chain. North America is the fastest-growing region at a 19.08% CAGR, powered by Pentagon procurement and Silicon Valley R&D. Europe holds the second-largest share, near 27.8%, buoyed by Airbus and BAE Systems partnerships embedding AR VR headset displays into aerospace maintenance workflows The Head Mounted Display Market is positioned for sustained double-digit expansion as 5G-native smart glasses display platforms unlock untethered enterprise use cases through the decade.


Key Report Takeaways

• By Technology

  • Virtual Reality commanded 65.2% of the Head Mounted Display Market in 2025, supported by gaming ecosystem maturity and esports subscription revenue
  • Augmented Reality is forecast to expand at a 20.48% CAGR through 2035, fueled by enterprise field-service adoption of smart glasses display form factors

• By Connectivity

  • Wired/ Tethered systems held USD 5.94 billion in revenue during 2025, though Wireless/ Standalone units are growing at a 22.85% CAGR as 5G and Wi-Fi 7 enable untethered immersive HMD devices


• By Product Type

  • Wired/tethered systems held USD 5.94 billion in revenue during 2025, though wireless/standalone units are growing at a 22.85% CAGR as 5G and Wi-Fi 7 enable untethered immersive HMD devices
  • Helmet-mounted displays represented 82.1% of the Head Mounted Display Market size in 2025, while Wearable Glasses are advancing at a 23.45% CAGR

• By End User

  • Consumer applications accounted for 73.8% of demand in 2025


• By Application

  • Consumer applications accounted for 73.8% of demand in 2025
  • Healthcare is progressing at a 22.07% CAGR, driven by surgical navigation and medical training simulators that rely on near-eye display systems

• By Region

  • Asia-Pacific captured 35.4% of global revenue in 2025
  • North America shows the strongest growth at a 19.08% CAGR to 2035, reflecting defense budget allocations for AR VR headset displays
  • The Head Mounted Display Market in Europe held 27.8% share, with Germany and the UK leading adoption


Market Size and Forecast (2021–2035)

MRFR's proprietary estimation framework triangulates vendor revenue disclosures, component shipment data from panel and sensor suppliers, and demand-side surveys across defense, healthcare, and consumer electronics channels. Historical figures draw on audited financials and customs trade data, while the forecast applies a bottom-up build validated against top-down macro benchmarks for the Head Mounted Display Market.

Head Mounted Display Market Size and Forecast
Our Impact
Enabled $4.3B Revenue Impact for Fortune 500 and Leading Multinationals
Partnering with 2000+ Global Organizations Each Year
30K+ Citations by Top-Tier Firms in the Industry
 

Driver Impact Analysis

Driver ~% Impact on CAGR Geographic Relevance Impact Timeline
Defense & military modernization ~22% North America, Europe, Asia-Pacific Short-term
Enterprise AR/MR adoption in manufacturing ~18% Global Medium-term
Consumer VR gaming & esports ecosystems ~16% North America, Asia-Pacific Short-term
Micro-OLED & pancake lens cost reduction ~14% Asia-Pacific, Europe Medium-term
5G/Wi-Fi 7 untethered connectivity ~12% Global Medium-term
Healthcare surgical navigation & training ~10% North America, Europe Long-term
Automotive AR-HUD convergence ~8% Europe, Asia-Pacific Long-term


Defense and Military Modernization

The U.S. Army's IVAS program — built on Microsoft HoloLens architecture — carries a USD 21.9 billion ceiling contract covering 121,000 mixed-reality headsets for close-combat squads [3]. NATO allies are following: South Korea's DAPA earmarked KRW 900 billion for networked helmet displays through 2029 [4]. These procurement pipelines guarantee multi-year revenue floors for the Head Mounted Display Market, insulating top-line growth from consumer sentiment swings.

Enterprise AR and Industrial Metaverse

The installation of more than 45,000 AR VR headset displays has been carried out across assembly and maintenance lines of manufacturing giants such as Boeing, Airbus, and Toyota, with a reported 25-35% decrease in mistake rates, and 20% quicker task completion [7]. PTC’s Vuforia and Teamcenter platforms now have native integrations with smart glasses display hardware from RealWear and Vuzix, enabling remote-expert overlay workflows that save field-service travel expenses an estimated USD 4,200 per technician per year [12]. The enterprise segment of the Head Mounted Display Market is moving away from pilot programs and towards fleet-wide deployment.


Consumer VR Gaming and Content Ecosystems

Meta's Quest ecosystem surpassed 20 million cumulative headset sales by late 2024, with the Quest 3 driving a 40% increase in monthly active VR users. Sony's PlayStation VR2, Valve's forthcoming standalone device, and ByteDance's Pico division collectively pushed consumer near-eye display systems into mainstream retail channels. Esports leagues began hosting VR-native tournaments in 2024 with aggregate prize pools, sustaining premium price points and platform stickiness across the Head Mounted Display Market [6].

Micro-OLED and Component Advances

Sony Semiconductor Solutions and BOE Technology are ramping micro-OLED production lines that can produce sub-1-inch panel sizes with 4K-per-eye resolution, targeting a 30% cost reduction by 2027 [9]. These developments in wearable display technology, including foveated rendering, which can reduce GPU load by as much as 60%, will enable lighter, cooler headsets that can be worn comfortably not only for 30 minutes, but for professional sessions lasting many hours. Component innovation is the single biggest unlock to turn casual users into daily active participants in the Head Mounted Display Market.


Restraints Impact Analysis

The restraint estimates below reflect directional headwinds to the Head Mounted Display Market CAGR. They are not linearly subtractive from the growth rate and represent analytical judgment informed by supply-chain and regulatory data.

Restraint ~% Drag on CAGR Geographic Relevance Impact Timeline
High consumer price sensitivity ~−6% Global Short-term
Motion sickness & user comfort limitations ~−5% Global Medium-term
Taiwan semiconductor supply-chain concentration ~−4% Asia-Pacific, Global Short-term
EU Cyber Resilience Act compliance costs ~−3% Europe Medium-term
Content scarcity beyond gaming ~−2% Global Long-term


Consumer Price Sensitivity

However, the flagship immersive HMD devices by Apple and Meta are still priced between USD 499 and USD 3,499 despite the dropping bill-of-materials prices, and are therefore not in the impulse-purchase area for most homes. In the inflationary environment of 2024, consumer adoption stabilized in certain European areas, with installment financing options still lagging behind those for smartphones. The price-performance expectations from mobile gaming remain a constant drag on the volume trajectory of the Head Mounted Display Market in the consumer tier.


Supply-Chain Concentration and Geopolitical Risk

More than 65% of advanced SoCs used in AR VR headset displays are made by TSMC and ASE Technology in Taiwan, presenting a single-point-of-failure risk [16]. U.S.-China trade limitations on advanced lithography equipment have further restricted wafer allocation for XR chipsets, resulting in 12-18 week lead times during peak demand windows. Qualcomm’s relationship with GlobalFoundries, Samsung’s XR-dedicated Pyeongtaek fabrication plant, etc. These diversification initiatives in the Head Mounted Display Market supply network will take until 2028 to meaningfully mitigate this exposure.


Regulatory Compliance Burdens

The EU's Cyber Resilience Act and upcoming AI Act impose mandatory security-by-design and transparency obligations on connected wearable display technology sold in the European Economic Area [17]. Compliance certification timelines of 9–14 months add cost and slow time-to-market, disproportionately burdening mid-tier OEMs. Combined with GDPR's strict biometric data provisions — relevant because modern HMDs capture eye-tracking and spatial-mapping data — European regulatory overhead shaves an estimated 1.5–2 percentage points from the region's potential Head Mounted Display Market growth rate.


Head Mounted Display Market Opportunities

Surgical Navigation and Medical Training Platforms

Healthcare systems globally spend over USD 350 billion annually on medical education, yet cadaveric and simulation training remain constrained by cost and access [10]. Near-eye display systems that overlay 3D anatomical models during live surgery — such as Medivis's SurgicalAR — reduce procedure times by 15–20% in orthopedic settings. As FDA 510(k) and CE-MDR pathways for AR surgical aids mature, the Head Mounted Display Market stands to capture a growing share of MedTech capital budgets

Drone-as-a-Service and Remote Operations

First-person-view piloting through immersive HMD devices is enabling precision agriculture, infrastructure inspection, and search-and-rescue missions at costs 40% below manned alternatives [12]. DJI already bundles FPV goggle kits with commercial drone platforms, and regulatory bodies, including the FAA and EASA, are certifying beyond-visual-line-of-sight operations that depend on low-latency head-tracked video feeds. This convergence creates a recurring-revenue opportunity for the Head Mounted Display Market tied to drone fleet expansion

Spatial Computing OS and App Store Monetization

Apple’s visionOS and Meta’s Horizon OS are building platform economics on the back of smartphone app stores, and 30% revenue-share frameworks incentivizing third-party developer investment [6]. In the first 12 months after the launch of Vision Pro, over 2,500 visionOS applications were launched and generated an estimated USD 180 million in developer income. As these ecosystems mature, software attach rates will fuel the recurring revenue that will push up the average revenue per immersive HMD device sold, benefiting the overall Head Mounted Display Market


Emerging Market Industrial Adoption

Southeast Asian automotive and electronics plants are piloting AR-guided quality inspection at scale, with Vietnam and Thailand emerging as adoption hotspots. These markets offer greenfield growth for the Head Mounted Display Market, where labor-cost savings from AR-assisted workflows justify faster payback periods than in mature economies

Data Monetization through Spatial Analytics

Enterprise HMD deployments generate terabytes of spatial, gaze, and workflow-efficiency data that employers can monetize through process-optimization consulting and insurance risk modeling [12]. This data-layer revenue model — analogous to telematics in fleet management — adds a high-margin income stream that strengthens the Head Mounted Display Market's value proposition for enterprise buyers


Head Mounted Display Market Future Outlook

AI-Native Headsets and On-Device Intelligence

By 2028, edge AI processors from Qualcomm (Snapdragon XR series) and MediaTek will enable real-time object recognition, language translation, and contextual coaching directly on near-eye display systems without cloud round-trips [8]. This shift reduces latency below 5 ms for enterprise-critical overlays, making the Head Mounted Display Market viable for time-sensitive workflows in surgery, air-traffic control, and hazardous-materials handling.

Platform Economics and Recurring Revenue

Apple's visionOS and Meta's Horizon OS are replicating smartphone-era platform economics, with developer revenue-share models generating an estimated USD 1.2 billion in annual app-store revenue by 2030 [6]. As software-attach rates climb from 1.8x to an anticipated 3.5x per device, the Head Mounted Display Market's revenue mix will shift from hardware-centric to services-augmented, improving gross margins across the value chain for immersive HMD devices.

Sustainability and Circular Design

EU Ecodesign for Sustainable Products Regulation requirements — under the official 2025-2030 Working Plan — will mandate digital product passports and recyclability scoring for wearable display technology sold in Europe [17]. OEMs are already exploring modular lens cartridges and battery-swap designs that extend device lifespans from 2.5 years to 4+ years. These circular-economy approaches could unlock a secondary Head Mounted Display Market in refurbished enterprise headsets worth an estimated USD 3–4 billion by 2033.

Spatial Web Standards and Interoperability

The Khronos Group's OpenXR and WebXR standards are converging toward a unified spatial computing stack that allows AR VR headset displays from different vendors to share content and peripherals [13]. Enterprise buyers cite vendor lock-in as a top-three procurement barrier, and interoperability standards directly address this friction. As open standards mature, the Head Mounted Display Market will benefit from accelerated enterprise adoption driven by reduced switching costs and multi-vendor deployment flexibility.


Head Mounted Display Market Segmentation

By Technology

Segment Key Metric Primary Demand Driver
Virtual Reality 65.2% share (2025) Gaming, esports, and immersive entertainment
Augmented Reality 20.48% CAGR Enterprise field service and surgical navigation
Mixed Reality USD 0.62 Billion (2025) Defense situational awareness


Virtual Reality continues to dominate the Head Mounted Display Market by revenue, sustained by Meta Quest, PlayStation VR2, and a growing library of over 5,000 titles across gaming and fitness categories. Consumer-grade VR headsets now ship with inside-out tracking and passthrough cameras that blur the boundary with mixed reality, extending session lengths and use-case breadth for immersive HMD devices.

Augmented Reality is the fastest-growing technology segment in the Head Mounted Display Market, driven by enterprise deployments of near-eye display systems from Microsoft (HoloLens 2), Magic Leap, and RealWear. Surgical navigation platforms, warehouse pick-and-pack guidance, and aerospace maintenance overlays deliver measurable ROI within 6–12 months, accelerating procurement approvals for smart glasses display hardware across Fortune 500 manufacturers [7].

By Connectivity

Segment Key Metric Primary Demand Driver
Wired/Tethered 57.9% share (2025) High-fidelity PC VR and simulation
Wireless/Standalone 22.85% CAGR 5G/Wi-Fi 7 and mobile freedom


Wired systems retain a revenue-share lead within the Head Mounted Display Market because PC-tethered setups from Valve, Varjo, and HP deliver the visual fidelity required for military simulation and professional design review [3]. Wireless standalone headsets — led by the Meta Quest lineup and Pico 4 — are closing the performance gap as Snapdragon XR2 Gen 2 chipsets approach desktop-class rendering, fueling the fastest CAGR in the connectivity dimension for wearable display technology.

By Product Type

Segment Key Metric Primary Demand Driver
Helmet-Mounted Displays 82.1% share (2025) Defense helmets, consumer VR headsets
Wearable Glasses/Eyewear 23.45% CAGR Lightweight enterprise AR, consumer smart glasses


Helmet-mounted displays command the bulk of the Head Mounted Display Market because both consumer VR headsets and military systems adopt the over-head form factor for stability and optics volume. Wearable glasses — including AR VR headset displays from Xreal, Rokid, and Ray-Ban Meta — are expanding rapidly as waveguide optics shrink to prescription-frame dimensions, opening lifestyle and all-day-wear use cases.

By End User

Segment Key Metric Primary Demand Driver
Consumer 73.8% share (2025) Gaming, fitness, social VR
Enterprise & Industrial 18.05% CAGR Manufacturing, logistics, field service


Consumer demand shapes the volume story of the Head Mounted Display Market, with gaming and media consumption driving over 70% of unit shipments. Enterprise and industrial users, however, generate higher average selling prices and longer contract durations, making the segment disproportionately valuable on a revenue-per-device basis for near-eye display systems.

By Application

Segment Key Metric Primary Demand Driver
Gaming, Media & Entertainment 36.8% share (2025) Esports, VR cinema, live sports
Healthcare 22.07% CAGR Surgical AR, medical training
Defense & Aerospace USD 1.76 Billion (2025) Situational awareness helmets
Manufacturing & Field Service 19.6% CAGR AR-guided assembly and inspection
Education & Training USD 0.52 Billion (2025) Immersive simulation platforms


Gaming, media, and entertainment remain the largest applications in the Head Mounted Display Market, sustained by subscription-based content libraries and live VR broadcasting of major sports events. Healthcare applications of immersive HMD devices are gaining regulatory traction, with the FDA clearing 14 AR/VR medical devices in 2024 alone, signaling a rapid expansion of clinical use cases for wearable display technology [10].


Regional Market Share Analysis

Region Key Metric Primary Investment Themes
North America 19.08% CAGR Defense modernization, Silicon Valley R&D
Europe USD 2.88 Billion (2025) Aerospace MRO, Cyber Resilience Act compliance
Asia-Pacific 35.4% share (2025) OEM manufacturing scale, 5G rollout
South America USD 0.41 Billion (2025) Mining & oil field services
Middle East & Africa 16.22% CAGR Smart city initiatives, defense procurement
Total USD 10.36 Billion (2025)

The Head Mounted Display Market spans five macro-regions, each shaped by distinct regulatory regimes, defense spending profiles, and consumer electronics maturity levels. Asia-Pacific leads in absolute revenue, while North America's defense-driven procurement is accelerating its CAGR beyond all other regions.


North America

Country Key Metric Key Driver
US 78.3% of regional share IVAS program, consumer VR installed base
Canada 12.46% CAGR Mining & remote field-service AR pilots
Mexico USD 0.11 Billion (2025) Nearshoring electronics assembly


The U.S. accounts for the vast majority of North America's Head Mounted Display Market revenue, propelled by the Pentagon's USD 21.9 billion IVAS ceiling contract and consumer spending on Meta Quest and Apple Vision Pro ecosystems [3][6]. Canada's mining sector is deploying AR VR headset displays for underground safety inspections, while Mexico is attracting nearshore HMD component assembly from Foxconn and Pegatron as OEMs diversify away from Taiwan-centric supply chains.

Europe

Country Key Metric Key Driver
Germany 23.7% of regional share Automotive and industrial AR adoption
UK 17.85% CAGR Project Morpheus defense procurement
France USD 0.38 Billion (2025) Aerospace MRO with Airbus & Dassault
Italy 14.9% CAGR Fashion and retail AR try-on platforms
Spain USD 0.16 Billion (2025) Tourism AR experiences
Nordic Countries 16.1% CAGR Healthcare and telemedicine AR pilots
Russia USD 0.09 Billion (2025) Domestic defense self-sufficiency
Rest of Europe 11.8% of regional share Varied industrial applications


Germany's automotive giants — BMW, Mercedes-Benz, and Volkswagen — have embedded wearable display technology into assembly-line workflows across 18 plants, while the UK's Ministry of Defence is channeling GBP 1.5 billion into soldier-worn near-eye display systems through Project Morpheus [4]. France's aerospace cluster around Toulouse uses smart glasses display hardware from Vuzix and RealWear for A350 maintenance, contributing to Europe's position as the second-largest Head Mounted Display Market region.

Asia-Pacific

Country Key Metric Key Driver
China 42.6% of regional share Domestic OEM scale (Pico, Nreal, Rokid)
India 21.34% CAGR PLI scheme for XR component assembly
Japan USD 0.72 Billion (2025) Micro-OLED panel supply chain
South Korea 18.9% CAGR Samsung XR chip fab investment
ASEAN USD 0.31 Billion (2025) Manufacturing AR pilot deployments
Rest of Asia-Pacific 14.7% CAGR Emerging defense modernization


China's ByteDance (Pico), Nreal, and Rokid collectively shipped over 4 million immersive HMD devices in 2024, leveraging aggressive pricing and domestic 5G infrastructure to dominate the consumer tier. Japan's Sony Semiconductor Solutions supplies the majority of global micro-OLED panels, giving the Head Mounted Display Market in Asia-Pacific a structural advantage in component cost optimization. India's PLI incentives are drawing Foxconn and Tata Electronics into local AR VR headset display assembly, positioning the subcontinent as a volume growth engine through 2035 [19].

South America

Country Key Metric Key Driver
Brazil 58.5% of regional share Oil & gas remote-assistance AR
Argentina 14.22% CAGR Agricultural technology pilots
Rest of South America USD 0.07 Billion (2025) Mining inspection use cases


Petrobras and Vale are piloting smart glasses display solutions for offshore platform inspections and underground mine safety, making Brazil the dominant Head Mounted Display Market in South America. Argentina's agritech sector is testing AR-overlaid crop analytics, though macroeconomic instability constrains capital expenditure cycles.

Middle East & Africa

Country Key Metric Key Driver
Saudi Arabia 38.2% of regional share NEOM smart city XR integration
UAE 17.54% CAGR Dubai Metaverse Strategy
South Africa USD 0.04 Billion (2025) Mining safety compliance
Egypt 15.3% CAGR Military modernization programs
Rest of MEA USD 0.06 Billion (2025) Oil & gas field services


Saudi Arabia's NEOM project has committed over USD 500 million to immersive HMD devices for construction visualization and visitor experience design, while the UAE's Dubai Metaverse Strategy targets 40,000 XR-related jobs by 2030 [20]. The Head Mounted Display Market in MEA remains nascent but benefits from concentrated sovereign wealth fund investment and rapid smart-city buildouts.


Head Mounted Display Market By Region, 2025-2035
 

Competitive Benchmarking

The Head Mounted Display Market exhibits medium concentration, with an estimated HHI of 1,150–1,350. The top five players — Meta Platforms, Sony, Apple, Microsoft, and ByteDance (Pico) — collectively hold approximately 58–65% of global revenue. The remaining share fragments across defense specialists, enterprise AR pure-plays, and emerging Chinese OEMs competing on price and 5G integration for smart glasses display products.

Company Est. Revenue Share Range Key Offerings for Head Mounted Display Market Strategic Positioning
Meta Platforms ~18–22% Quest 3, Quest Pro, Horizon OS Consumer volume leader, platform economics
Sony Group ~10–14% PlayStation VR2, micro-OLED panels Console ecosystem + component supplier
Apple Inc. ~8–12% Vision Pro, visionOS Premium spatial computing pioneer
Microsoft Corporation ~6–9% HoloLens 2, IVAS (with U.S. Army) Enterprise & defense AR anchor
ByteDance (Pico) ~5–8% Pico 4, Pico Neo series China consumer market, aggressive pricing
Samsung Electronics ~3–5% XR chipsets, upcoming headset Silicon + display vertical integration
Vuzix Corporation ~2–4% M400, Vuzix Shield Enterprise smart glasses specialist
RealWear Inc. ~1–3% Navigator 520 Rugged industrial AR headsets
Magic Leap ~1–3% Magic Leap 2 Enterprise-only AR platform
Varjo Technologies ~1–2% XR-4, VR-3 Ultra-high-resolution professional VR


Recent News & Developments

  • Meta Platforms (September 2024): Launched Quest 3S at USD 299, the lowest entry price for a mixed-reality headset, targeting first-time buyers and expanding the Head Mounted Display Market's addressable consumer base.
  • Apple Inc. (June 2024): Released visionOS 2.0 with enterprise device management and spatial SharePlay for multi-user collaboration, signaling deeper B2B commitment for its immersive HMD devices [6].


  • European Commission (November 2024): Published Cyber Resilience Act implementing guidelines requiring mandatory vulnerability disclosure for connected AR VR headset displays sold in the EU [17].
  • Qualcomm (October 2024): Unveiled Snapdragon XR2+ Gen 2 platform with on-device generative AI capabilities, enabling real-time language translation and object recognition for smart glasses display products [8].


Head Mounted Display Market Report Scope

Parameter Detail
Market Scope Head Mounted Display Market — hardware, software, and services
Study Period 2021–2035
CAGR Window 2026–2035
Market Size (2025) USD 10.36 Billion
Market Size (2035) USD 49.72 Billion
Fastest Growing Segment Augmented Reality (by technology); Wireless/Standalone (by connectivity)
Companies Profiled Meta, Sony, Apple, Microsoft, ByteDance (Pico), Samsung, Vuzix, RealWear, Magic Leap, Varjo
Valuation Currency USD Billion


FAQs

How does eye-tracking accuracy vary across Head Mounted Display Market products, and why does it matter for enterprise buyers?

Enterprise-grade headsets from Varjo and Apple achieve sub-0.5° gaze accuracy, while consumer units typically range from 1–2°. Higher precision enables foveated rendering and attention analytics critical for surgical and training applications [15].

What total cost of ownership should enterprises budget when deploying AR VR headset displays at scale?

Fleet deployments averaging 500 units typically cost USD 2,800–4,500 per seat annually, covering hardware amortization, MDM licensing, content subscriptions, and IT support [7]. Budget 15–20% above hardware cost alone.

Which Head Mounted Display Market segments carry the highest gross margins for device manufacturers?

Defense helmet-mounted displays yield 42–55% gross margins due to long-cycle contracts and customization premiums. Consumer VR headsets operate at 15–25% margins as OEMs subsidize hardware to build platform ecosystems [3].

How do waveguide and pancake lens architectures differ in the Head Mounted Display Market?

Waveguides enable transparent see-through for AR smart glasses display use, but sacrifice the field-of-view beyond 52°. Pancake lenses compress VR optics by 40% in depth, trading slight light-efficiency losses for dramatically thinner immersive HMD devices [9].

What cybersecurity risks should procurement teams evaluate before purchasing near-eye display systems?

HMDs capture biometric gaze data, spatial room maps, and voice input — all classified as sensitive personal data under GDPR and CCPA. Require vendors to demonstrate encrypted telemetry, on-device processing options, and SOC 2 Type II compliance [17].

Can the Head Mounted Display Market sustain growth if consumer VR adoption stalls?

Enterprise and defense verticals already contribute over 26% of revenue and are growing at nearly double the consumer rate. Even a two-year consumer plateau would reduce the overall CAGR by only 2–3 percentage points[12].

What interoperability standards should buyers require when sourcing wearable display technology from multiple vendors?

Mandate OpenXR 1.1 runtime compliance, WebXR compatibility, and Bluetooth LE accessory pairing per Khronos Group specifications. These standards prevent vendor lock-in and ensure content portability across the Head Mounted Display Market [13].


Author
Author
Author Profile
Aarti Dhapte LinkedIn
AVP - Research
A consulting professional focused on helping businesses navigate complex markets through structured research and strategic insights. I partner with clients to solve high-impact business problems across market entry strategy, competitive intelligence, and opportunity assessment. Over the course of my experience, I have led and contributed to 100+ market research and consulting engagements, delivering insights across multiple industries and geographies, and supporting strategic decisions linked to $500M+ market opportunities. My core expertise lies in building robust market sizing, forecasting, and commercial models (top-down and bottom-up), alongside deep-dive competitive and industry analysis. I have played a key role in shaping go-to-market strategies, investment cases, and growth roadmaps, enabling clients to make confident, data-backed decisions in dynamic markets.
Co-Author
Co-Author Profile
Aarti Dhapte LinkedIn
AVP - Research
A consulting professional focused on helping businesses navigate complex markets through structured research and strategic insights. I partner with clients to solve high-impact business problems across market entry strategy, competitive intelligence, and opportunity assessment. Over the course of my experience, I have led and contributed to 100+ market research and consulting engagements, delivering insights across multiple industries and geographies, and supporting strategic decisions linked to $500M+ market opportunities. My core expertise lies in building robust market sizing, forecasting, and commercial models (top-down and bottom-up), alongside deep-dive competitive and industry analysis. I have played a key role in shaping go-to-market strategies, investment cases, and growth roadmaps, enabling clients to make confident, data-backed decisions in dynamic markets.

Research Approach


Secondary Research

The secondary research process involved comprehensive analysis of regulatory databases, patent repositories, industry standards documentation, and authoritative technology research organizations. Key sources included the US Federal Communications Commission (FCC) equipment authorization database, National Institute of Standards and Technology (NIST) cybersecurity frameworks, US Department of Defense (DoD) procurement databases, European Telecommunications Standards Institute (ETSI), International Electrotechnical Commission (IEC) standards database, Consumer Technology Association (CTA.org), International Data Corporation (IDC) technology trackers, IEEE Xplore Digital Library, US Patent and Trademark Office (USPTO), European Patent Office (EPO), World Intellectual Property Organization (WIPO), National Telecommunications and Information Administration (NTIA), US Food & Drug Administration (FDA) 510(k) clearances for medical HMDs, International Organization for Standardization (ISO) technical committees, National Aeronautics and Space Administration (NASA) technology transfer reports, US Army Combat Capabilities Development Command (DEVCOM), and national statistics bureaus from key manufacturing markets. These sources were used to collect shipment data, regulatory compliance information, patent landscape analysis, standardization trends, and technology adoption metrics across augmented reality, virtual reality, mixed reality headsets, smart glasses, and component ecosystems including displays, sensors, processors, and optical systems.


Primary Research

In order to gather both qualitative and quantitative insights, supply-side and demand-side stakeholders were interviewed during the primary research process. CEOs, CTOs, VPs of Hardware Engineering, leaders of AR/VR product divisions, and supply chain directors from semiconductor suppliers, optical component suppliers, and HMD manufacturers were examples of supply-side sources. Chief information officers, training simulation directors, defense procurement officers, healthcare technology managers, executives from gaming studios, and enterprise solutions architects from defense contractors, healthcare systems, educational institutions, industrial manufacturing facilities, and immersive entertainment companies were examples of demand-side sources. Market segmentation, product roadmap timelines, pricing elasticity, content ecosystem development, and enterprise implementation problems were all confirmed by primary research.

Primary Respondent Breakdown:

By Designation: C-level Primaries (32%), Director Level (31%), Others (37%)

By Region: North America (38%), Europe (25%), Asia-Pacific (28%), Rest of World (9%)


Market Size Estimation

Global market valuation was derived through shipment volume analysis and revenue mapping across the value chain. The methodology included:

Identification of 50+ key manufacturers and ecosystem players across North America, Europe, Asia-Pacific, and Latin America

Product mapping across augmented reality headsets, virtual reality headsets, mixed reality devices, smart glasses, and component categories including microdisplays, optical waveguides, motion sensors, eye-tracking systems, and haptic interfaces

Analysis of reported and modeled annual revenues specific to HMD product portfolios and component segments

Coverage of manufacturers and suppliers representing 75-80% of global market share in 2024

Extrapolation using bottom-up (unit shipments × ASP by country and end-use segment) and top-down (manufacturer revenue validation) approaches to derive segment-specific valuations, with additional triangulation against third-party shipment trackers and semiconductor bill-of-materials estimates

Download Free Sample

Kindly complete the form below to receive a free sample of this Report

Download PDF ×

We do not share your information with anyone. However, we may send you emails based on your report interest from time to time. You may contact us at any time to opt-out.