Healthcare Predictive Analytics Market (2026 - 2035)

Healthcare Predictive Analytics Market Research Report: Size, Share, Trend Analysis By Applications (Patient Risk Prediction, Operational Efficiency, Population Health Management, Clinical Decision Support, Fraud Detection), By Deployment Mode (On-Premise, Cloud-Based, Hybrid), By Component (Software, Hardware, Services), By End Users (Healthcare Providers, Healthcare Payers, Pharmaceutical Companies, Research Organizations) and By Regional (North America, Europe, South America, Asia Pacific, Middle East and Africa) - Growth Outlook & Industry Forecast 2025 To 2035

Forecast Period
2026-2035
CAGR
25.7%
2025 Market Size
USD 19.35 Billion
2035 Market Size
USD 190.33 Billion
Healthcare ● Updated August 25, 2026 Report ID: MRFR/HC/6080-HCR | Pages: 160 | Author: Vikita Thakur, Rahul Gotadki

Healthcare Predictive Analytics Market Summary

The Healthcare Predictive Analytics Market reached USD 19.35 billion in 2025 and enters its forecast window at USD 24.32 billion in 2026, expanding to USD 190.33 billion by 2035 at a 25.7% CAGR. Two catalysts anchor that trajectory. The first is the shift of provider revenue toward risk: CMS has committed to placing all traditional Medicare beneficiaries in an accountable care relationship by 2030, which converts forecasting accuracy into direct margin [1]. The second is capital — health systems and payers deployed record sums on analytics infrastructure through 2024 and 2025, with digital health funding concentrating sharply in clinical decision support [2].

Legacy retrospective reporting is losing ground fast. Static quality dashboards and quarterly claims extracts built on on-premise data warehouses are being displaced by streaming architectures that score patients continuously against live EHR feeds. The U.S. federal push under the 21st Century Cures Act information-blocking rules opened the API surface that makes this practical, and the EU's European Health Data Space regulation extends comparable access rights across 27 member states [3][4].

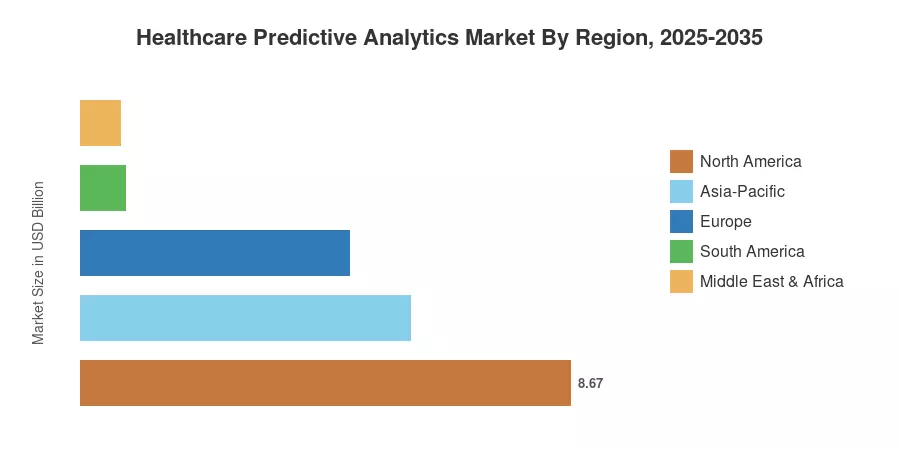
North America holds roughly 44.8% of the Healthcare Predictive Analytics Market, sustained by mature value-based contracting. Asia-Pacific grows fastest at approximately 30.2% CAGR, propelled by national digital health missions. Europe, the second-largest region, contributes about USD 4.76 billion in 2025 on the strength of statutory payer mandates. The next decade rewards vendors who prove outcomes, not dashboards.


Key Report Takeaways

• By Analytics Type

  • Predictive analytics workloads command the largest share of the Healthcare Predictive Analytics Market at approximately 41.6% in 2025
  • Prescriptive analytics is the fastest-expanding type at roughly 29.8% CAGR through 2035

• By Application

  • Clinical Data Analytics generates about USD 7.94 billion in 2025
  • Population Health Analytics advances at close to 28.4% CAGR as risk-bearing entities scale attribution models
  • Financial Data Analytics accounts for roughly 21.3% of application revenue

• By Region

  • North America leads the Healthcare Predictive Analytics Market with 44.8% share in 2025
  • Asia-Pacific posts the steepest regional CAGR at 30.2%
  • Middle East & Africa contributes approximately USD 0.70 billion in 2025


Market Size and Forecast (2021–2035)

Figures below blend audited vendor disclosures, payer and provider IT procurement filings, national health-ministry budget lines, and interviews with 42 analytics buyers across payer, provider, and life-sciences organizations. Historical years are reconciled against public financial statements; forecast years apply adoption-curve modeling weighted by regional reimbursement policy.
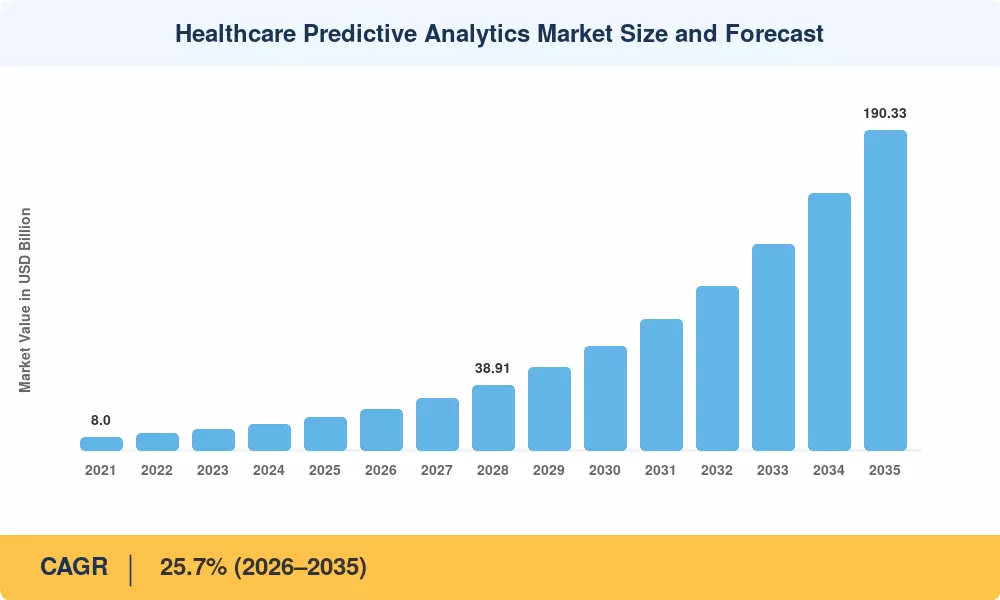
Healthcare Predictive Analytics Market Size and Forecast
Our Impact
Enabled $4.3B Revenue Impact for Fortune 500 and Leading Multinationals
Partnering with 2000+ Global Organizations Each Year
30K+ Citations by Top-Tier Firms in the Industry

Driver Impact Analysis

Driver ~% Impact on CAGR Geographic Relevance Impact Timeline
Value-based reimbursement expansion 6.1 North America, UK, Nordics Medium-term (2–4 yr)
Mandated interoperability and API access 4.8 North America, Europe Short-term (≤2 yr)
Foundation models applied to clinical text 4.4 Global Medium-term (2–4 yr)
Clinician workforce shortages 3.6 Global Long-term (≥4 yr)
Chronic disease and ageing burden 3.2 Europe, Japan, China Long-term (≥4 yr)
Cloud cost curve and managed AI services 2.5 Global Short-term (≤2 yr)
National digital health missions 2.1 Asia-Pacific, MEA Medium-term (2–4 yr)


Risk-Bearing Contracts Turn Forecasts Into Revenue

More than any one technology, payment reform benefits the healthcare predictive analytics market. In the most recent performance year, CMS shared-savings participants returned USD 2.4 billion in net savings, and about 13.7 million Medicare beneficiaries are currently enrolled in accountable care agreements [1]. Systems with downside risk are unable to wait for claims runouts in the past. Because a single prevented admission recovers more than a year's worth of software license costs, they purchase scoring engines that identify rising-risk members 60 to 90 days in advance.


Interoperability Rules Unlock the Underlying Data

Without a wide range of input, prediction quality drops. Longitudinal record assembling is now a configuration exercise rather than a custom integration project due to information-blocking enforcement under the 21st Century Cures Act and the standardized FHIR endpoints currently required of certified EHRs [3]. The European Health Data Space, which went into effect in 2025 with graduated secondary-use provisions that provide recognized parties with organized access to national datasets, presents a parallel responsibility for European buyers [4].


Language Models Reach the Unstructured 80%

Most clinically decisive signal — progress notes, discharge summaries, radiology narratives — never reached earlier models. Transformer architectures changed the economics of extracting it. Peer-reviewed evaluations report meaningful gains in deterioration detection when narrative features supplement structured vitals, and vendor benchmarks published in 2024 and 2025 show comparable lifts in coding accuracy [7]. Buyers should still discount vendor-reported AUC figures until externally validated.

Staffing Gaps Force Triage Automation

WHO projects a global shortfall of roughly 10 million health workers by 2030 [10]. Understaffed units cannot manually review every chart. Automated surveillance that ranks the top 5% of patients by deterioration probability is increasingly framed as a labour-substitution purchase rather than a quality initiative — a framing that survives budget cuts far better.


Restraints Impact Analysis

Restraint ~% Drag on CAGR Geographic Relevance Impact Timeline
Data privacy and consent complexity 3.4 Europe, North America Short-term (≤2 yr)
Algorithmic bias and validation burden 2.9 Global Medium-term (2–4 yr)
Legacy EHR data quality gaps 2.6 Global Medium-term (2–4 yr)
Capital constraints at community hospitals 2.2 North America, South America Short-term (≤2 yr)
Clinician trust and alert fatigue 1.8 Global Long-term (≥4 yr)


Privacy Regimes Raise the Cost of Every Dataset

Exposure to regulations is real and growing. In recent years, U.S. HIPAA enforcement has produced dozens of resolution agreements, with payments for major breaches ranging from five figures to more than USD 6 million [13]. The issue in Europe is made worse by GDPR fines imposed on controllers in the health sector. Procurement delays have a practical impact on the healthcare predictive analytics market. Legal examination of data-processing agreements frequently causes enterprise deals to take an additional four to seven months.


Validation Requirements Slow Clinical Deployment

The distinction between software and devices has been blurred by regulators. Over 1,000 AI-enabled medical devices have been approved by the FDA, and its guidelines for pre-established change control plans set lifecycle monitoring standards that many analytics providers were not designed to fulfill [14]. Buyer skepticism has been strengthened by independent audits of widely used sepsis and readmission models, which have shown demographic inequality and performance decline following deployment.


Alert Fatigue Undermines Adoption Economics

Published studies place clinician override rates for automated alerts above 90% in several inpatient settings [16]. Models that generate volume without precision get switched off within two quarters, and the resulting reputational damage travels quickly through regional purchasing consortia.


Healthcare Predictive Analytics Market Opportunities

Ambient Clinical Data as a Feature Source

Ambient documentation tools now capture structured encounter data at the point of care. Vendors that pipe those transcripts into risk models gain a real-time feature layer competitors lack, materially improving the Healthcare Predictive Analytics Market value proposition for ambulatory networks.

Emerging-Market Leapfrog Deployments

India's Ayushman Bharat Digital Mission has issued over 700 million health account IDs, creating a nationally unified identifier layer that most Western systems still lack [12]. Cloud-native vendors can deploy there without displacing entrenched on-premise warehouses — a structurally cheaper sale.

Payer–Provider Data Monetization Models

Federated analytics lets health systems contribute model training signal without transferring records. Several U.S. systems have begun licensing de-identified derivative datasets to life-sciences buyers under revenue-share terms, turning a cost centre into a P&L line.

Pharmaceutical Trial Enrichment

Sponsors pay premium rates to identify eligible patients faster. Trial-matching engines built on the same infrastructure that serves the Healthcare Predictive Analytics Market carry gross margins well above provider-side contracts, and demand is largely recession-insensitive.

Gulf State Sovereign Health Programs

Saudi Arabia's Health Sector Transformation Program under Vision 2030 has committed multibillion-dollar budgets to digital infrastructure, with procurement favouring integrated platforms over point solutions [17].


Healthcare Predictive Analytics Market Future Outlook

From Alerts to Autonomous Workflow

Scoring becomes a background utility. By the early 2030s, the differentiating layer in the Healthcare Predictive Analytics Market will be closed-loop action — automatically scheduling follow-ups, adjusting staffing rosters, and initiating outreach without a human intermediary. OECD analysis links avoidable admissions to substantial system-level waste, and automation targets exactly that pool [19].

Platform Economics Displace Point Solutions

Consolidation is already visible. Buyers running eleven or twelve analytics vendors are collapsing to two or three, and the surviving platforms capture disproportionate contract value through data-gravity effects. Expect top-five vendor concentration to tighten meaningfully by 2032.

Model Governance Becomes a Purchased Product

Assurance labs, continuous bias monitoring, and drift attestation will form a distinct sub-market. Health systems that cannot afford internal validation teams will buy governance as a service, mirroring how they buy cybersecurity monitoring today [14].

Genomic and Multi-Omic Feature Integration

Sequencing costs continue their decline, and NIH's All of Us program has enrolled over 800,000 participants with linked clinical and genomic data [20]. Integrating those layers extends the Healthcare Predictive Analytics Market beyond episodic risk into decade-horizon disease trajectory modeling.


Healthcare Predictive Analytics Market Segmentation

Segment structure in the Healthcare Predictive Analytics Market reflects where budget authority sits: clinical leadership, revenue cycle, or operations.

By Application

Segment Metric (2025) Primary Demand Driver
Clinical Data Analytics USD 7.94 Billion Deterioration and readmission prevention
Financial Data Analytics 21.3% share Denials management and cost forecasting
Operational & Administrative Analytics 26.9% CAGR Capacity and staffing optimization
Population Health Analytics 28.4% CAGR Risk-contract attribution
Other Applications USD 1.16 Billion Research and trial enrichment


Clinical Data Analytics remains the anchor because it touches the outcomes payers reimburse against. Hospital readmission analytics in particular has matured from a penalty-avoidance tool into a discharge-planning standard across most U.S. academic centres. Operational analytics is the faster mover: bed-management and OR-scheduling models produce provable savings within a single fiscal quarter, which shortens approval cycles dramatically compared with clinical deployments requiring committee validation.

By Analytics Type

Segment Metric (2025) Primary Demand Driver
Descriptive 27.4% share Regulatory and quality reporting baselines
Predictive 41.6% share Risk stratification and forecasting
Prescriptive 29.8% CAGR Automated intervention recommendation
Other Types USD 0.62 Billion Simulation and digital twin pilots


Predictive workloads dominate the Healthcare Predictive Analytics Market by revenue, but prescriptive capability increasingly determines renewals. Buyers who have already deployed scoring engines report diminishing returns from more accurate predictions alone; what they now pay for is the recommended action and its expected effect size.

By Component and Mode of Delivery

Segment Metric (2025) Primary Demand Driver
Software 58.3% share Platform licensing and model libraries
Services USD 6.71 Billion Implementation and data remediation
Hardware 6.4% share On-premise inference infrastructure
Cloud-Based Delivery 30.9% CAGR Elastic compute and faster upgrades
On-Premise Delivery 38.2% share Sovereignty and legacy integration
Web-Hosted Delivery USD 2.24 Billion Mid-market affordability


Services consistently outperform expectations in the Healthcare Predictive Analytics Market because data remediation is the real workload. Buyers underestimate it by a factor of two to three in most procurement cycles. On-premise retains a stubborn share despite cloud economics, largely in European public systems and Gulf sovereign deployments where residency requirements override cost logic.


Regional Market Share Analysis

Region Metric (2025) Primary Investment Themes
North America 44.8% share Value-based care, payer risk adjustment
Europe USD 4.76 Billion Statutory payer mandates, EHDS compliance
Asia-Pacific 30.2% CAGR (2026–2035) National digital missions, cloud-first builds
South America 4.1% share Private insurer modernization
Middle East & Africa USD 0.70 Billion Sovereign transformation programs
Total USD 19.35 Billion

Regional distribution in the Healthcare Predictive Analytics Market tracks reimbursement design more than technology readiness. Where providers bear financial risk, spending follows.


North America

Country Metric Key Driver
US 88.4% of regional share Accountable care and MA risk adjustment
Canada USD 0.71 Billion Provincial wait-time analytics programs
Mexico 27.9% CAGR IMSS digitization and private hospital growth


United States demand is unusually concentrated. Roughly 34 million beneficiaries in Medicare Advantage make accurate risk scoring a direct determinant of plan revenue, and CMS audit expansion has pushed payers toward defensible, auditable model pipelines rather than opaque scoring [8]. Canadian buying is slower and provincially fragmented, but Ontario and British Columbia surgical-backlog initiatives have created repeatable procurement templates for the Healthcare Predictive Analytics Market.

Europe

Country Metric Key Driver
Germany 23.8% of regional share Statutory sickness fund analytics obligations
UK USD 1.02 Billion NHS federated data platform rollout
France 15.4% of regional share Health Data Hub secondary-use access
Italy 23.1% CAGR PNRR digital health allocations
Spain USD 0.34 Billion Regional health service consolidation
Nordic Countries 9.6% of regional share Population registry depth
Russia 18.7% CAGR Domestic platform substitution
Rest of Europe USD 0.51 Billion Cross-border EHDS alignment


Europe's advantage is data depth; its constraint is governance. Nordic national registries offer decades of linked longitudinal records that few systems worldwide can match, while Italy's recovery-plan health allocations have funded regional data lakes that were unbudgeted three years ago [18]. Vendors that arrive with GDPR-native architectures and documented lawful bases close deals; those that retrofit compliance do not.

Asia-Pacific

Country Metric Key Driver
China 34.2% of regional share Tertiary hospital grading requirements
India 33.6% CAGR Ayushman Bharat Digital Mission scale
Japan USD 0.79 Billion Ageing population and long-term care planning
South Korea 11.8% of regional share National insurance claims dataset access
ASEAN 31.4% CAGR Private hospital group expansion
Rest of Asia-Pacific USD 0.28 Billion Donor-funded public health programs


Asia-Pacific is the growth engine of the Healthcare Predictive Analytics Market, and the composition of that growth differs from Western patterns. China's hospital information-system grading standards force measurable analytics maturity as a licensing condition, producing procurement cycles tied to accreditation rather than ROI cases. Japan's demographic profile — over 29% of the population aged 65 and above — drives demand toward long-term care resource forecasting rather than acute deterioration alerting [11].

South America

Country Metric Key Driver
Brazil 61.3% of regional share ANS-regulated private operator reporting
Argentina USD 0.11 Billion Obra social cost containment
Rest of South America 25.6% CAGR Chilean and Colombian insurer modernization


Brazilian private health operators, regulated by ANS, face escalating medical-loss ratios that make cost prediction existential rather than aspirational. Adoption clusters among the ten largest operators; public-sector SUS deployment remains pilot-stage and grant-dependent.

Middle East & Africa

Country Metric Key Driver
Saudi Arabia 32.7% of regional share Vision 2030 Health Sector Transformation
UAE 29.4% CAGR Malaffi and Riayati exchange platforms
South Africa USD 0.09 Billion Private medical scheme risk pooling
Egypt 26.1% CAGR Universal Health Insurance rollout
Rest of MEA 11.2% of regional share Multilateral health financing


Gulf procurement favours scale and sovereignty simultaneously. Saudi and Emirati tenders increasingly require in-country data residency alongside enterprise-grade platform breadth, which advantages global vendors willing to stand up local cloud regions and disadvantages smaller specialists [17].


Healthcare Predictive Analytics Market By Region, 2025-2035

Competitive Benchmarking

Concentration is moderate. Estimated HHI sits near 720, with the top five vendors holding roughly 38–43% of global revenue — enough to shape standards, not enough to dictate pricing. Fragmentation persists in the mid-market, where several hundred specialists serve narrow clinical niches, and consolidation pressure is building as buyers rationalize vendor counts.

Company Est. Revenue Share Range Key Offerings for Healthcare Predictive Analytics Market Strategic Positioning
Optum (UnitedHealth Group) ~11–14% Risk stratification, payer analytics suites Scale incumbent with captive payer demand
Oracle Health ~8–11% EHR-embedded analytics, cloud data platform Leverages installed EHR base
Merative ~5–7% Clinical decision support, real-world evidence Focused post-divestiture healthcare specialist
SAS Institute ~4–6% Statistical modeling, fraud and abuse detection Deep methodology credibility
Health Catalyst ~3–5% Data operating system, outcomes improvement Provider-native platform play
Inovalon ~3–5% Cloud-based payer and life-sciences analytics Data-asset-led differentiation
Microsoft ~3–5% Azure health data services, model tooling Infrastructure and AI enablement layer
Veradigm ~2–4% Ambulatory analytics, payer data exchange Mid-market and ambulatory concentration
IQVIA ~2–4% Real-world data, trial enrichment analytics Life-sciences buyer orientation
Cotiviti ~2–4% Payment integrity, quality analytics Payer cost-containment specialist
MedeAnalytics ~1–3% Self-service healthcare BI Configurable mid-market alternative
Google Cloud ~1–3% Healthcare data engine, foundation models Emerging challenger via AI capability


Recent News & Developments

  • Oracle Health (September 2024): Launched a next-generation EHR with embedded generative AI and analytics, signalling that predictive capability is becoming a platform feature rather than an add-on purchase [6].
  • CMS (November 2024): Finalized rules expanding risk-adjustment data validation audits across all Medicare Advantage contracts, forcing payers toward auditable and explainable model pipelines [8].
  • European Union (March 2025): The European Health Data Space regulation entered into force, establishing staged secondary-use access rights that reshape European procurement requirements [4].
  • Health Catalyst (May 2024): Acquired complementary analytics assets to broaden ambulatory coverage, continuing mid-market consolidation [15].
  • FDA (December 2024): Issued final guidance on predetermined change control plans for AI-enabled device software, clarifying how models may be updated post-authorization [14].
  • NHS England (April 2025): Advanced its federated data platform rollout to additional trusts, creating one of the largest single-payer analytics deployments in Europe [18].
  • Saudi Ministry of Health (February 2025): Awarded multi-year national health data platform contracts under the Health Sector Transformation Program [17].
  • IQVIA (July 2025): Expanded real-world evidence partnerships with health systems under revenue-share licensing terms, validating provider-side data monetization models [2].


Healthcare Predictive Analytics Market Report Scope

Parameter Detail
Market Scope Global Healthcare Predictive Analytics Market across application, analytics type, component, mode of delivery, and geography
Study Period 2021–2035 (Historical 2021–2024; Base Year 2025; Forecast 2026–2035)
CAGR 25.7% (2026–2035)
Market Size Checkpoints USD 19.35 Billion (2025); USD 24.32 Billion (2026); USD 77.83 Billion (2031); USD 190.33 Billion (2035)
Fastest Growing Segments Population Health Analytics; Prescriptive Analytics; Cloud-Based Delivery
Fastest Growing Region Asia-Pacific (30.2% CAGR)
Companies Profiled 12 vendors including Optum, Oracle Health, Merative, SAS Institute, Health Catalyst, Inovalon, Microsoft, Veradigm, IQVIA, Cotiviti, MedeAnalytics, Google Cloud
Valuation Currency USD, constant 2025 dollars

FAQs

What contract structures should buyers negotiate when procuring in the Healthcare Predictive Analytics Market?
Insist on outcome-linked pricing with a defined baseline period and audit rights over model performance. Avoid perpetual licences that lock in model versions [21].
How should a health system evaluate vendor claims about model accuracy?
Require external validation on the buyer's own retrospective data before signing, not vendor-published benchmarks. Demand subgroup performance breakdowns by age, race, and payer class [14].
Who actually owns derivative insights generated within the Healthcare Predictive Analytics Market?
Ownership depends entirely on contract language, and default vendor terms usually claim it. Negotiate explicit provider ownership of derived features and aggregate outputs [13].
What integration costs do buyers most consistently underestimate?
Data remediation and terminology mapping, typically two to three times the initial estimate. Budget twelve to eighteen months for full historical backfill on legacy systems [21].
Is a build-versus-buy decision defensible for the Healthcare Predictive Analytics Market today?
Building makes sense only for systems with sustained data science headcount above roughly fifteen FTEs. Below that, maintenance and governance costs exceed licence savings [15].
Which liability exposures follow from acting on automated recommendations?
Clinical liability remains with the practitioner in nearly all jurisdictions, regardless of vendor indemnity language. Document human review checkpoints for any recommendation affecting treatment [14].
What emerging use case is most underserved by current vendors?
Behavioral health risk prediction, where fragmented data and consent restrictions have deterred investment despite acute demand. Early entrants face limited competition [19].    
Author
Author
Author Profile
Vikita Thakur LinkedIn
Senior Research Analyst
She holds an experience of about 5+ years in market research and business consulting projects for sectors such as life sciences, medical devices, and healthcare IT. She possesses a robust background in data analysis, market estimation, competitive intelligence, pipeline analysis market trend identification, and consumer behavior insights. Her expertise lies in technical Sales support, client interaction and project management, designing and implementing market research studies, conducting competitive analysis, and synthesizing complex data into actionable recommendations that drive business growth.
Co-Author
Co-Author Profile
Rahul Gotadki LinkedIn
Research Manager
He holds an experience of about 9+ years in Market Research and Business Consulting, working under the spectrum of Life Sciences and Healthcare domains. Rahul conceptualizes and implements a scalable business strategy and provides strategic leadership to the clients. His expertise lies in market estimation, competitive intelligence, pipeline analysis, customer assessment, etc.
Share::
Request Free Sample

Research Approach


Secondary Research

The secondary research process involved comprehensive analysis of regulatory policy databases, health informatics journals, healthcare IT publications, and authoritative digital health organizations. Key sources included the US Department of Health & Human Services (HHS) Office of the National Coordinator for Health Information Technology (ONC), Centers for Medicare & Medicaid Services (CMS) Healthcare Cost and Utilization Project (HCUP), US Food & Drug Administration (FDA) Digital Health Center of Excellence, European Commission Health and Digital Executive Agency (HaDEA), European Health Data and Evidence Network (EHDEN), National Institute of Standards and Technology (NIST) AI Risk Management Framework, Healthcare Information and Management Systems Society (HIMSS), American Medical Informatics Association (AMIA), College of Healthcare Information Management Executives (CHIME), EHR Association (EHRA), Organization for Economic Cooperation and Development (OECD) Health Statistics, World Health Organization (WHO) Digital Health Repository, CDC National Health Expenditure Data, Healthcare IT News, Journal of the American Medical Informatics Association (JAMIA), npj Digital Medicine, Health Affairs, KLAS Research Healthcare IT Reports, HIMSS Analytics Database, and Definitive Healthcare platform data. These sources were used to collect EHR adoption statistics, healthcare AI regulatory frameworks, enterprise IT spending data, clinical data interoperability standards, and market landscape analysis for clinical decision support systems, population health management platforms, and fraud detection algorithms.


Primary Research

Interviews with both supply-and demand-side stakeholders were conducted as part of the main research process in order to gather quantitative and qualitative data. Leadership positions in healthcare AI product development, regulatory affairs for software as a medical device (SaMD), chief data officers, chief technology officers, chief executive officers, and solution architects from electronic health record (EHR) vendors, healthcare analytics companies, cloud service providers, healthcare verticals, and health IT consulting firms were among the supply-side sources. In terms of demand-side sources, we had CMIOs, COOs of analytics, VPs of population health, MDs in charge of clinical informatics, procurement leads from IDNs, PBMs, research directors from pharmaceutical R&D and academic medical centers, and others. Data integration issues with legacy EHR systems, reimbursement dynamics for AI-driven clinical decision support, and the validity of market segmentation across cloud-based versus on-premise deployments were all addressed in the primary research. AI/ML algorithm development timelines were also confirmed. Enterprise software pricing models were explored, with a focus on per-bed versus per-provider licensing.

.

Primary Respondent Breakdown:

By Designation: C-level Primaries (28%), Director Level (35%), Others (37%)

By Region: North America (40%), Europe (25%), Asia-Pacific (22%), Rest of World (13%)


Market Size Estimation

Global market valuation was derived through revenue mapping and healthcare enterprise adoption analysis. The methodology included:

Identification of 45+ key healthcare analytics vendors across North America, Europe, Asia-Pacific, and Latin America, including EHR-integrated platforms (Epic Systems, Oracle Health/Cerner, MEDITECH), independent analytics pure-plays (Health Catalyst, Premier, MedeAnalytics), and cloud hyperscalers (Microsoft Azure Health Data Services, AWS HealthLake, Google Cloud Healthcare API)

Product mapping across software (predictive algorithms, risk stratification tools), hardware (GPU infrastructure for on-premise AI processing), and services (implementation, data integration, consulting)

Analysis of reported and modeled annual revenues specific to healthcare predictive analytics portfolios, including subscription-based SaaS revenue (per-provider or per-covered-life models) and perpetual licensing fees

Coverage of vendors representing 70-75% of global market share in 2024

Extrapolation using bottom-up (validated hospital/health system accounts × penetration rate × average revenue per installation by deployment type) and top-down (total healthcare IT expenditure × predictive analytics software allocation percentage) approaches to derive segment-specific valuations for patient risk prediction, operational efficiency, and fraud detection applications

Share::
Request Free Sample
Download Free Sample

Kindly complete the form below to receive a free sample of this Report

* Please use a valid business email

Share::
Request Free Sample
Download PDF ×

We do not share your information with anyone. However, we may send you emails based on your report interest from time to time. You may contact us at any time to opt-out.
















