Healthcare Software as a service Market (2026 - 2035)

Healthcare Software-as-a-service Market Research Report: Size, Share, Trend Analysis By Deployment Model (Cloud-based, On-premises), By Applications (Electronic Health Records (EHRs), Practice Management, Revenue Cycle Management, Patient Engagement, Telemedicine), By End-user (Hospitals, Clinics, Ambulatory Surgery Centers, Long-term Care Facilities, Physician Practices), By Functionality (Scheduling, Billing, Medical Records Management, Patient Communication, Decision Support) and By Regional (North America, Europe, South America, Asia Pacific, Middle East and Africa) - Growth Outlook & Industry Forecast 2025 To 2035

Forecast Period
2026-2035
CAGR
15.8%
2025 Market Size
USD 34.48 Billion
2035 Market Size
USD 150.97 Billion
Healthcare ● Updated August 24, 2026 Report ID: MRFR/HC/28018-HCR | Pages: 128 | Author: Rahul Gotadki, Kinjoll Dey

Healthcare Software as a service Market Summary

The Healthcare Software-as-a-Service Market reached USD 34.48 billion in 2025 and opens the forecast window at USD 40.32 billion in 2026, climbing to USD 150.97 billion by 2035 at a 15.8% CAGR. Two catalysts anchor that trajectory. The 21st Century Cures Act information-blocking provisions force vendors to publish standardized FHIR APIs, which erodes the economics of on-premise licensing [1]. Meanwhile, CMS interoperability and prior-authorization rules push payers toward hosted platforms that can be patched centrally [2]. Subscription pricing wins because compliance deadlines move faster than capital budgets.

Replacement cycles are doing the heavy lifting. Hospitals are retiring client-server EHR estates, on-premise revenue-cycle engines, and bolt-on scheduling tools, swapping them for multi-tenant platforms with embedded analytics. Providers deploying AI-assisted revenue-cycle software report days-in-accounts-receivable falling from roughly 90 to 40 [3]. That payback math explains why U.S. health systems committed an estimated USD 14.6 billion to cloud health IT contracts during 2024 alone [4].

North America holds 51.0% of 2025 revenue, supported by dense payer-provider integration. Asia-Pacific grows fastest at 17.6% CAGR as India's Ayushman Bharat Digital Mission and Japan's standardized EHR program scale [5][6]. Europe ranks second, propelled by the European Health Data Space regulation. The next decade rewards vendors who treat compliance as a product feature, not a checkbox.


Key Report Takeaways

• By Application

  • Non-clinical information systems commanded 57.4% of the Healthcare Software-as-a-service Market in 2025, led by revenue-cycle and supply-chain workloads.
  • Clinical information systems post the faster trajectory at a 16.9% CAGR through 2035

• By Deployment Model

  • Private cloud generated USD 17.00 billion in 2025 revenue, favored by systems with legacy data-residency covenants.
  • Hybrid and virtual private cloud is the fastest-expanding deployment tier at 17.1% CAGR.

• By End-User

  • Healthcare providers held 73.1% share of the Healthcare Software-as-a-service Market in 2025


• By Healthcare PayersLife- Sciences & CROs

  • Healthcare payers are forecast to reach USD 24.9 billion by 2035 on automation of claims adjudication.

• By Region

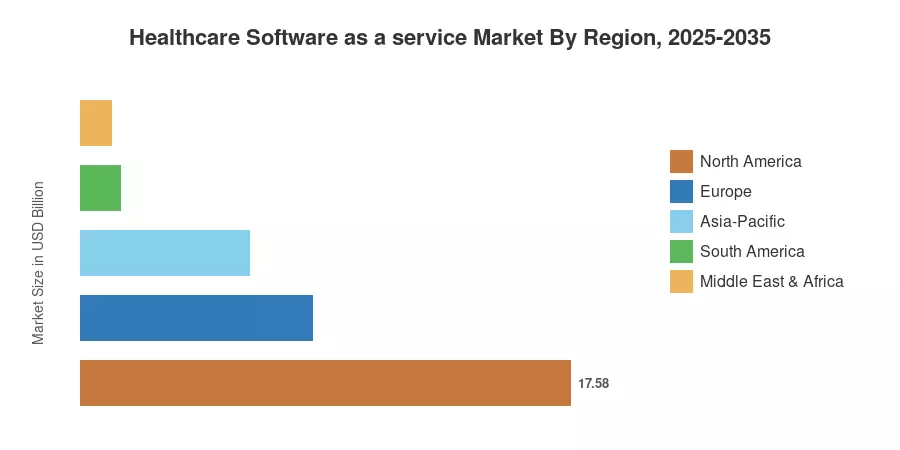
  • North America contributed USD 17.58 billion in 2025
  • Asia-Pacific advances at 17.6% CAGR, the steepest regional curve
  • Europe accounts for 24.2% of global revenue


Market Size and Forecast (2021–2035)

Figures blend vendor subscription-revenue disclosures, hospital IT procurement filings, national digital-health budget allocations, and a bottom-up install-base model covering roughly 41,000 acute and ambulatory facilities across 38 countries. Historical years reconcile against audited annual reports; forecast years apply cohort-based migration rates for the Healthcare Software-as-a-service Market.
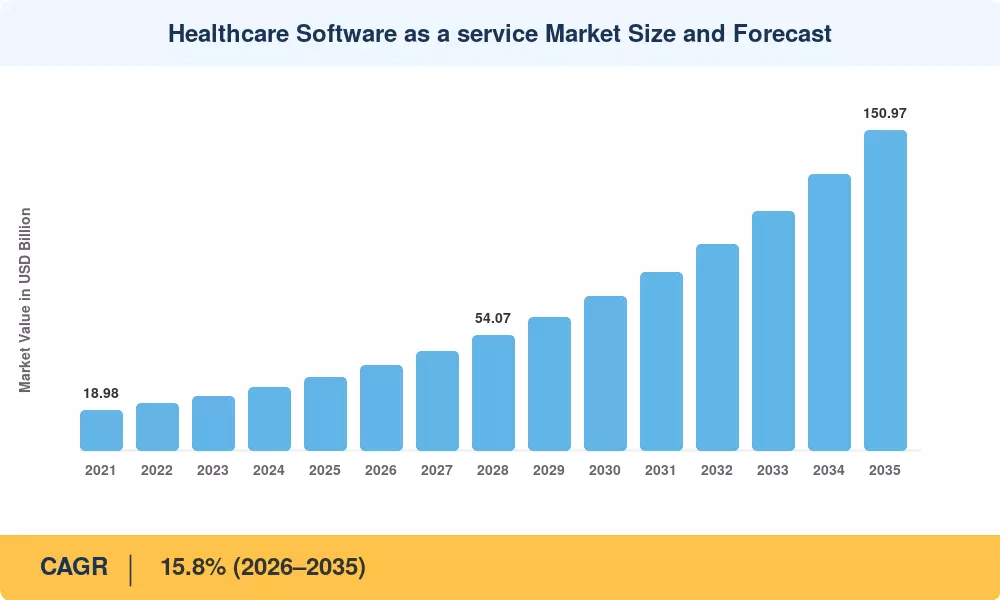
Healthcare Software as a service Market Size and Forecast
Our Impact
Enabled $4.3B Revenue Impact for Fortune 500 and Leading Multinationals
Partnering with 2000+ Global Organizations Each Year
30K+ Citations by Top-Tier Firms in the Industry

Driver Impact Analysis

Driver ~% Impact on CAGR Geographic Relevance Impact Timeline
Interoperability and API mandates ~3.6 North America, Europe Short-term (≤2 yr)
Revenue-cycle automation economics ~3.1 North America Short-term (≤2 yr)
Cybersecurity and zero-trust migration ~2.4 Global Medium-term (2–4 yr)
Clinical AI and ambient documentation ~2.2 North America, Europe, Japan Medium-term (2–4 yr)
National digital-health programs ~1.9 Asia-Pacific, MEA Long-term (≥4 yr)
Clinician shortage and burnout relief ~1.5 Global Long-term (≥4 yr)
Value-based care contracting ~1.1 North America, UK Long-term (≥4 yr)


Interoperability Mandates Rewrite Procurement Criteria

Regulation now dictates architecture. The ONC HTI-1 rule requires certified health IT to support USCDI v3 and standardized FHIR endpoints, and non-compliant developers risk decertification [1]. Health systems responded by writing API conformance directly into RFPs, which structurally advantages the Healthcare Software-as-a-service Market over perpetual-license incumbents. Cloud vendors ship conformance updates across their entire tenant base in a single release cycle; an on-premise customer running a three-year-old build must schedule a project. HHS OCR enforcement actions against information blocking added USD 1.2 million in penalties during 2024, sharpening board-level attention [15].

Revenue-Cycle Automation Delivers Measurable Payback

These contracts are increasingly being signed by finance leaders rather than CIOs. Within four quarters, denial rates at deployed systems decreased by an average of 23%, while automated eligibility checking, claim cleaning, and denial-appeal writing reduced payment realization from around 90 days to 40 [3]. Even single-digit efficiency capture justifies membership prices multiple times more when compared to the estimated USD 1.05 trillion in yearly hospital administrative spending in the United States [16]. Vendors have seen that pricing on a percentage of collections, as opposed to per-user seats, locks in renewal and grows with client success.


Security Economics Push Workloads Off Premise

The risk calculation was altered by ransomware. Healthcare businesses reported at least one cyberattack in 2024, with an average cost of USD 9.8 million, the highest of any industry for the fourteenth year in a row [9][17]. Approximately 92% of the surveyed businesses reported at least one cyberattack. A 24-hour security operations center cannot be staffed by small and mid-sized hospitals. Compared to developing comparable capacity internally, hosted solutions with SOC 2 Type II attestation, HITRUST certification, and continuous patching are more affordable.


Ambient Clinical Intelligence Enters Standard Workflow

Documentation burden drives attrition, and vendors have made it a wedge. Ambient scribing tools embedded in cloud EHR workflows cut after-hours charting by an average of 38 minutes per clinician per day in multi-site evaluations [11]. Because inference models require frequent retraining and GPU capacity, delivery is effectively cloud-only — which converts an AI purchase into a subscription commitment.


Restraints Impact Analysis

Restraint ~% Drag on CAGR Geographic Relevance Impact Timeline
Data residency and sovereignty rules ~1.8 Europe, Asia-Pacific, MEA Medium-term (2–4 yr)
Legacy integration and migration cost ~1.6 North America, Europe Short-term (≤2 yr)
Recurring-cost fatigue in capital budgets ~1.2 Global Medium-term (2–4 yr)
Clinician change-management resistance ~0.9 Global Short-term (≤2 yr)
Connectivity gaps in rural facilities ~0.7 Asia-Pacific, South America, MEA Long-term (≥4 yr)


Sovereignty Rules Fragment the Delivery Model

Real costs are imposed by localization regulations. While India's DPDP Act allows government-designated country limits, the European Health Data Space and GDPR Article 44 restrict cross-border processing of health records [10][18]. Vendors are required to maintain divergent release trains, duplicate compliance checks, and establish in-country regions. The development and certification costs of each new sovereign territory are expected to be between USD 8 and USD 14 million, which delays entry into mid-sized national markets and keeps opportunities for domestic competitors.


Migration Complexity Delays Contract Value Realization

Going live is slower than signing. Approximately one in five migrations report post-go-live revenue impact exceeding 5% for at least one quarter, and large multi-hospital EHR transitions typically take 18 to 30 months [19]. Budget that never reaches the vendor is used for dual-running expenses, historical data conversion, and interface correction across dozens of ancillary systems. Phased payments linked to milestone acceptance are becoming more and more common among procurement teams.


Subscription Fatigue Meets Constrained Operating Margins

Hospitals operating on thin margins scrutinize every renewal. Aggregate U.S. hospital operating margins hovered near 1.0% through much of 2024, making a five-year total cost of ownership that exceeds a comparable license-plus-maintenance path a genuine barrier [16]. Vendors counter with consumption-based tiers, but CFOs remain wary of costs that escalate with clinical volume.


Healthcare Software as a service Market Opportunities

Composable Platforms for Mid-Market Hospitals

Enterprise suites priced for academic medical centers continue to underserve community hospitals with 100–400 beds. Modular deployments reduce entry costs below USD 250,000 per year and increase the addressable base of the healthcare software-as-a-service market by an estimated 11,000 facilities worldwide. These deployments begin with scheduling and revenue cycle before overlaying clinical modules.


Emerging-Market Public Health Infrastructure

Greenfield demand is being generated by government initiatives. Over 700 million health account IDs have been granted by India's Ayushman Bharat Digital Mission, while Saudi Arabia's Vision 2030 health transformation allots multibillion-riyal expenditures to unified patient information [5][12]. Vendors who localize language, code standards, and payment integration early get ten years of incumbency, and these deployments completely avoid the on-premise generation.


De-Identified Data Monetization and Real-World Evidence

Platform operators sit on longitudinal datasets that pharmaceutical sponsors will pay for. Real-world evidence spending by life-sciences companies is projected to exceed USD 3.4 billion annually by 2030, and HIPAA Safe Harbor de-identification provides a workable legal path [21]. Revenue-sharing arrangements with provider customers turn a compliance cost center into a second income line.

Payer-Provider Convergence Platforms

Shared-risk contracts require both sides to see the same data. Platforms that host eligibility, prior authorization, quality measurement, and settlement in one tenancy remove reconciliation friction that currently consumes an estimated 3–5% of contract value [14]. This is among the least-contested white spaces in the Healthcare Software-as-a-service Market.

Embedded Regulatory Reporting as a Service

Quality reporting obligations multiply annually across CMS, NHS England, and comparable bodies. Automating measure calculation and submission inside the workflow — rather than as a quarterly scramble — is a low-churn attach product with gross margins above 80%.


Healthcare Software as a service Market Future Outlook

Autonomous Administrative Operations

By 2030, expect a meaningful share of routine administrative transactions — eligibility verification, coding, prior authorization, denial appeals — to execute without human review. Vendors are already reporting straight-through processing rates above 70% for low-complexity claims [3]. The competitive question shifts from feature parity to model accuracy, and the Healthcare Software-as-a-service Market begins pricing on outcomes rather than access.

Platform Economics and Ecosystem Lock-In

App marketplaces built on SMART on FHIR are becoming the defensive moat. Once a health system runs 30 or more third-party applications against a single platform tenancy, switching cost stops being a data-migration problem and becomes an ecosystem problem. Expect platform vendors to trade core-module margin for marketplace take-rates approaching 15–20%.

Regulatory Convergence on AI Assurance

Oversight of clinical algorithms is tightening. The EU AI Act classifies many diagnostic-support tools as high-risk with conformity-assessment obligations beginning in 2026, and FDA continues expanding its predetermined change control pathway [24]. Vendors that build model documentation, drift monitoring, and audit trails into the platform will absorb compliance costs that smaller competitors cannot.

Sustainability and Total Cost Transparency

Health systems in Europe and the UK now report Scope 3 emissions that include IT services, and NHS England requires suppliers to publish carbon reduction plans [25]. Cloud consolidation typically reduces per-workload energy intensity relative to underutilized hospital data centers. Sustainability disclosure will function as a procurement filter in the Healthcare Software-as-a-service Market well before it functions as a differentiator.


Healthcare Software as a service Market Segmentation

Segmentation of the Healthcare Software-as-a-service Market follows three commercially meaningful axes: what the software does, how it is hosted, and who signs the contract.

By Application

Segment Metric Primary Demand Driver
Non-Clinical Information Systems SaaS 57.4% share (2025) Revenue-cycle automation and supply-chain visibility
Clinical Information Systems SaaS 16.9% CAGR (2026–2035) Ambient documentation and decision support


Money follows money. Non-clinical workloads dominate the Healthcare Software-as-a-service Market because their return on investment is legible to a CFO within two quarters — denials fall, collections accelerate, staffing needs drop. Clinical systems carry longer sales cycles, heavier validation requirements, and physician governance committees. They grow faster because the ambient AI wave landed squarely in clinical documentation, and because clinical modules attach naturally once a platform relationship exists.

By Deployment Model

Segment Metric Primary Demand Driver
Private Cloud USD 17.00 Billion (2025) Data residency and legacy compliance covenants
Public Cloud 30.4% share (2025) Elastic scaling for analytics and imaging workloads
Hybrid & Virtual Private Cloud 17.1% CAGR (2026–2035) Phased migration from on-premise estates


Private cloud leads because risk committees find it easier to approve. Hybrid grows fastest for a practical reason: nobody migrates a 20-year EHR estate in one motion, so the interim architecture becomes the purchased architecture — often for five years or more. Public cloud share within the Healthcare Software-as-a-service Market climbs as hyperscaler HIPAA-eligible service catalogs expand.

By End-User

Segment Metric Primary Demand Driver
Healthcare Providers 73.1% share (2025) EHR replacement and clinician productivity
Healthcare Payers 17.3% CAGR (2026–2035) Prior-authorization API and claims automation
Other End Users USD 3.34 Billion (2025) Life sciences, pharmacy, and public health agencies


Providers dominate on sheer facility count, and they also grow quickly because replacement cycles are concentrated in this decade. Payers represent the higher-margin opportunity — fewer buyers, larger contracts, harder compliance deadlines. Life-sciences and public-health buyers form a smaller but strategically valuable tier within the Healthcare Software-as-a-service Market, since they anchor the real-world evidence opportunity described earlier.


Regional Market Share Analysis

Region Metric (2025) Primary Investment Themes
North America 51.0% share Revenue-cycle automation, ambient AI documentation
Europe USD 8.34 Billion Health data space compliance, cross-border records
Asia-Pacific 17.6% CAGR (2026–2035) National digital missions, mobile-first care delivery
South America USD 1.45 Billion Private-network claims processing, telehealth
Middle East & Africa 3.2% share Sovereign hospital digitization programs
Total USD 34.48 Billion

Regional performance across the Healthcare Software-as-a-Service Market tracks the maturity of national interoperability policy more closely than it tracks healthcare spending per capita.


North America

Country Share of Region Key Driver
US 88.4% Cures Act API enforcement and payer mandates
Canada 8.1% Provincial EHR consolidation programs
Mexico 3.5% IMSS digital claims modernization


Scale and regulation reinforce each other here. The U.S. hosts roughly 6,100 hospitals operating under a single federal certification regime, letting vendors amortize compliance investment across an enormous installed base. Canada Health Infoway funding continues to underwrite provincial interoperability layers, while Mexico's social security institute has begun tendering cloud claims platforms. Regional dominance of the Healthcare Software-as-a-service Market looks durable through 2030, though growth moderates as replacement cycles complete.

Europe

Country Metric Key Driver
Germany USD 2.09 Billion Hospital Future Act digitization funding
UK 22.6% of region NHS Federated Data Platform rollout
France 12.4% of region Ségur du Numérique en Santé program
Italy 8.9% of region PNRR recovery-fund health IT allocation
Spain 7.2% of region Regional health service cloud tenders
Nordic Countries 9.1% of region Shared Nordic record interoperability
Russia 3.8% of region Domestic-vendor mandated platforms
Rest of Europe 11.0% of region EHDS harmonization spending


Germany's Krankenhauszukunftsgesetz committed roughly EUR 4.3 billion to hospital digital infrastructure, with disbursement extending into the late 2020s [22]. The European Health Data Space regulation adds a second wave by requiring standardized exchange formats across member states [10]. Fragmented procurement across 27 jurisdictions keeps deal sizes smaller than U.S. equivalents, but renewal rates run notably higher once systems are embedded.

Asia-Pacific

Country Metric Key Driver
China 31.2% of region Tertiary hospital grading digitization requirements
India 19.4% CAGR Ayushman Bharat Digital Mission scale-up
Japan 21.7% of region Standardized EHR national rollout
South Korea 11.3% of region Smart hospital designation program
ASEAN 10.8% of region Universal coverage claims automation
Rest of Asia-Pacific 6.6% of region Private hospital chain expansion


Growth here is policy-manufactured. Japan's Ministry of Health is standardizing electronic records nationally with a target of near-universal adoption by 2030, and India has issued more than 700 million digital health IDs [6][5]. Neither market carries substantial legacy on-premise debt, so buyers evaluate cloud platforms as the default rather than the alternative. Pricing pressure is severe — average contract values run 40–60% below North American comparables — but volume within the Healthcare Software-as-a-service Market compensates.

South America

Country Share of Region Key Driver
Brazil 58.3% ANS supplementary health claims digitization
Argentina 16.1% Provincial hospital network upgrades
Rest of South America 25.6% Private insurer platform adoption


Brazil's regulated private health insurance sector covers roughly 51 million lives and operates under standardized TISS exchange rules, creating an unusually clean integration target [23]. Public-sector adoption lags due to budget constraints. Currency volatility complicates multi-year USD-denominated contracts, prompting several vendors to price locally.

Middle East & Africa

Country Metric Key Driver
Saudi Arabia 34.7% of region Vision 2030 health cluster transformation
UAE 24.2% of region Malaffi and Riayati exchange networks
South Africa 14.6% of region Private hospital group standardization
Egypt 9.8% of region Universal health insurance rollout
Rest of MEA 16.7% of region Donor-funded primary care systems


Gulf states buy differently — sovereign programs procure at national scale with short timelines and strong preference for vendors willing to host locally. Saudi Arabia's health transformation program has restructured hospital operations into regional clusters, each requiring unified patient records [12]. Sub-Saharan adoption remains concentrated in private chains and donor-funded primary care networks.


Healthcare Software as a service Market By Region, 2025-2035

Competitive Benchmarking

Concentration sits in the medium band. The estimated Herfindahl-Hirschman Index for the Healthcare Software-as-a-service Market falls near 780, with the top five vendors holding a combined 38–44% of revenue. Two ends of a barbell define competition: entrenched EHR platforms extending into adjacent workflows, and specialist vendors dominating a single high-value function such as denials management or clinical documentation.

Company Est. Revenue Share Range Key Offerings Strategic Positioning
Epic Systems ~11–14% Cloud-hosted EHR, Cosmos analytics, payer platform Academic and large IDN incumbency; ecosystem gravity
Oracle Health ~9–12% Cloud EHR, clinical AI agent, revenue cycle Leveraging OCI migration and federal contracts
UnitedHealth Group (Optum) ~7–10% Claims, payment integrity, analytics services Payer-side scale with vertically integrated data
Veradigm ~4–6% Ambulatory EHR, practice management, data services Mid-market ambulatory and life-sciences data pivot
athenahealth ~4–6% Network-based EHR, RCM, patient engagement Percentage-of-collections pricing model
MEDITECH ~3–5% Expanse cloud EHR, community hospital suite Community and rural hospital specialization
Waystar ~3–5% Revenue-cycle automation, denial prevention Pure-play RCM with strong AI attach rates
Innovaccer ~2–4% Healthcare data platform, population health Cloud-native data layer above incumbent EHRs
NextGen Healthcare ~2–4% Ambulatory EHR, behavioral health modules Specialty practice focus
Philips ~2–4% Clinical informatics, imaging workflow Device-adjacent clinical software integration
Salesforce ~2–3% Health Cloud CRM, patient engagement Non-clinical engagement and payer workflows
Microsoft ~2–3% Dragon Copilot, Fabric healthcare data solutions Ambient AI and platform infrastructure layer


Recent News & Developments


  • Oracle Health (September 2024): Unveiled a rebuilt cloud EHR with an embedded clinical AI agent, signaling a full architectural break from legacy Cerner Millennium deployments [26]
  • CMS (January 2024): Finalized the Interoperability and Prior Authorization rule requiring impacted payers to operate FHIR-based APIs by January 2027, triggering broad payer platform procurement [2]
  • Waystar (June 2024): Completed a Nasdaq IPO raising roughly USD 968 million, validating public-market appetite for pure-play healthcare revenue-cycle software [27]
  • European Commission (March 2025): European Health Data Space regulation entered into force, establishing phased obligations for standardized electronic record exchange across member states [10]


  • Epic Systems (August 2024): Expanded its payer platform to include real-time prior-authorization decisioning, moving directly into territory historically held by clearinghouses [26]
  • Saudi Ministry of Health (November 2024): Awarded multi-cluster unified health record contracts under the Vision 2030 health transformation, one of the largest sovereign digital health tenders to date [12]


Healthcare Software as a service Market Report Scope

Parameter Detail
Market Scope Global Healthcare Software-as-a-service Market across application, deployment model, end-user, and geography
Study Period 2021–2035 (Historical 2021–2024; Base Year 2025; Forecast 2026–2035)
CAGR 15.8% (2026–2035)
Market Size Checkpoints USD 34.48 Billion (2025); USD 40.32 Billion (2026); USD 150.97 Billion (2035)
Fastest Growing Segments Clinical Information Systems SaaS (application); Hybrid & Virtual Private Cloud (deployment); Healthcare Payers (end-user); Asia-Pacific (geography)
Companies Profiled 12 major vendors including Epic Systems, Oracle Health, Optum, Veradigm, athenahealth, MEDITECH, Waystar, Innovaccer, NextGen Healthcare, Philips, Salesforce, Microsoft
Valuation Currency USD Billion

FAQs

How should buyers structure exit clauses when contracting in the Healthcare Software-as-a-service Market?
Insist on machine-readable data export in FHIR format at no incremental cost, with a defined 180-day post-termination access window. Contracts lacking a specified export format leave you negotiating from zero leverage [1].
What is the realistic total cost of ownership beyond the subscription line?
Budget 1.4 to 2.1 times the annual subscription for year-one implementation, interface development, and dual-running. Most overruns trace to ancillary system interfaces that were scoped optimistically [19].
Do smaller vendors in the Healthcare Software-as-a-service Market pose acquisition risk to buyers?
Yes. Specialist vendors are consolidation targets, and post-acquisition roadmaps frequently deprioritize inherited products. Request contractual continuity commitments surviving a change of control [27].
How do liability terms differ for AI-assisted clinical features?
Most vendors classify clinical AI output as decision support, placing liability on the clinician. Under the EU AI Act, high-risk classification adds vendor conformity obligations but does not transfer clinical responsibility [24].
Which certifications actually matter when evaluating the Healthcare Software-as-a-service Market?
HITRUST CSF certification and SOC 2 Type II carry the most weight with risk committees. ONC certification is table stakes for clinical systems, not a differentiator [1].
Is single-vendor consolidation better than best-of-breed integration?
Consolidation lowers integration cost but raises pricing exposure at renewal. Systems running more than 40 applications generally find a platform-plus-marketplace approach outperforms either extreme [4].
What emerging use case is most underestimated by buyers today?
Automated regulatory quality reporting. Measure calculation and submission consume substantial analyst time quarterly, and embedded automation delivers faster payback than most clinical modules [14].    
Author
Author
Author Profile
Rahul Gotadki LinkedIn
Research Manager
He holds an experience of about 9+ years in Market Research and Business Consulting, working under the spectrum of Life Sciences and Healthcare domains. Rahul conceptualizes and implements a scalable business strategy and provides strategic leadership to the clients. His expertise lies in market estimation, competitive intelligence, pipeline analysis, customer assessment, etc.
Co-Author
Co-Author Profile
Kinjoll Dey LinkedIn
Senior Research Analyst
He is an extremely curious individual currently working in Healthcare and Medical Devices Domain. Kinjoll is comfortably versed in data centric research backed by healthcare educational background. He leverages extensive data mining and analytics tools such as Primary and Secondary Research, Statistical Analysis, Machine Learning, Data Modelling. His key role also involves Technical Sales Support, Client Interaction and Project management within the Healthcare team. Lastly, he showcases extensive affinity towards learning new skills and remain fascinated in implementing them.
Share::
Request Free Sample

Research Approach


Secondary Research

The secondary research process involved comprehensive analysis of regulatory databases, peer-reviewed health informatics journals, clinical publications, government health IT initiatives, and authoritative healthcare technology organizations. Key sources included the US Department of Health and Human Services (HHS), Office of the National Coordinator for Health Information Technology (ONC), Centers for Medicare & Medicaid Services (CMS), US Food and Drug Administration (FDA) Digital Health Center of Excellence, European Commission eHealth Network, European Medicines Agency (EMA) Health Technology Assessment (HTA) Database, National Health Service (NHS) Digital (UK), National Institutes of Health (NIH) National Library of Medicine, National Center for Biotechnology Information (NCBI/PubMed), Healthcare Information and Management Systems Society (HIMSS), American Medical Informatics Association (AMIA), American Hospital Association (AHA) Annual Survey Database, Organization for Economic Co-operation and Development (OECD) Health Statistics, World Health Organization (WHO) Digital Health Repository, International Telecommunication Union (ITU) ICT Statistics, Eurostat Healthcare Database, Asian Development Bank (ADB) Health Sector Data, and national e-health agency reports from key markets including Canada Health Infoway, Australian Digital Health Agency, and Japan's Ministry of Health, Labour and Welfare (MHLW) e-Japan Strategy.

Health IT adoption statistics, regulatory compliance information (HIPAA, GDPR, HITECH Act), interoperability standards (FHIR, HL7), clinical safety studies, healthcare digitization trends, and competitive landscape analysis for Electronic Health Records (EHR), Revenue Cycle Management (RCM), Practice Management, Telemedicine platforms, and other healthcare SaaS technologies were gathered from these sources.


Primary Research

In order to gather both qualitative and quantitative insights, supply-side and demand-side stakeholders were interviewed during the primary research process. CEOs, CTOs, VPs of Product Development, Chief Information Security Officers (CISOs), heads of regulatory affairs, and commercial directors from healthcare SaaS providers, EHR developers, telehealth platform providers, and healthcare IT integrators were examples of supply-side sources. Chief Information Officers (CIOs), Chief Medical Information Officers (CMIOs), IT directors, procurement leads, and clinical workflow managers from hospital systems, multispecialty clinics, ambulatory surgery centers, long-term care facilities, and physician practice groups were among the demand-side sources. Primary research verified product development roadmaps and AI integration timelines, validated market segmentation across deployment models (cloud-based vs. on-premises), and obtained information on clinical adoption trends, interoperability issues, cybersecurity investment priorities, subscription pricing models, and reimbursement dynamics for digital health solutions.

Primary Respondent Breakdown:

By Designation: C-level Primaries (32%), Director Level (31%), Others (37%)

By Region: North America (32%), Europe (29%), Asia-Pacific (33%), Rest of World (6%)


Market Size Estimation

Global market valuation was derived through revenue mapping and healthcare IT expenditure analysis. The methodology included:

Identification of 50+ key healthcare SaaS vendors across North America, Europe, Asia-Pacific, and Latin America

Product mapping across Electronic Health Records (EHR), Revenue Cycle Management (RCM), Practice Management, Patient Engagement, Telemedicine, and other application categories

Analysis of reported and modeled annual revenues specific to healthcare SaaS portfolios, including subscription-based recurring revenue (ARR) and software licensing transitions to SaaS models

Coverage of vendors representing 72-78% of global market share in 2024

Extrapolation using bottom-up (healthcare provider IT budget allocation × SaaS adoption rate by country) and top-down (vendor revenue validation against total health IT spending) approaches to derive segment-specific valuations across deployment models, end-user facilities, and functional modules

Share::
Request Free Sample
Download Free Sample

Kindly complete the form below to receive a free sample of this Report

* Please use a valid business email

Share::
Request Free Sample
Download PDF ×

We do not share your information with anyone. However, we may send you emails based on your report interest from time to time. You may contact us at any time to opt-out.
















