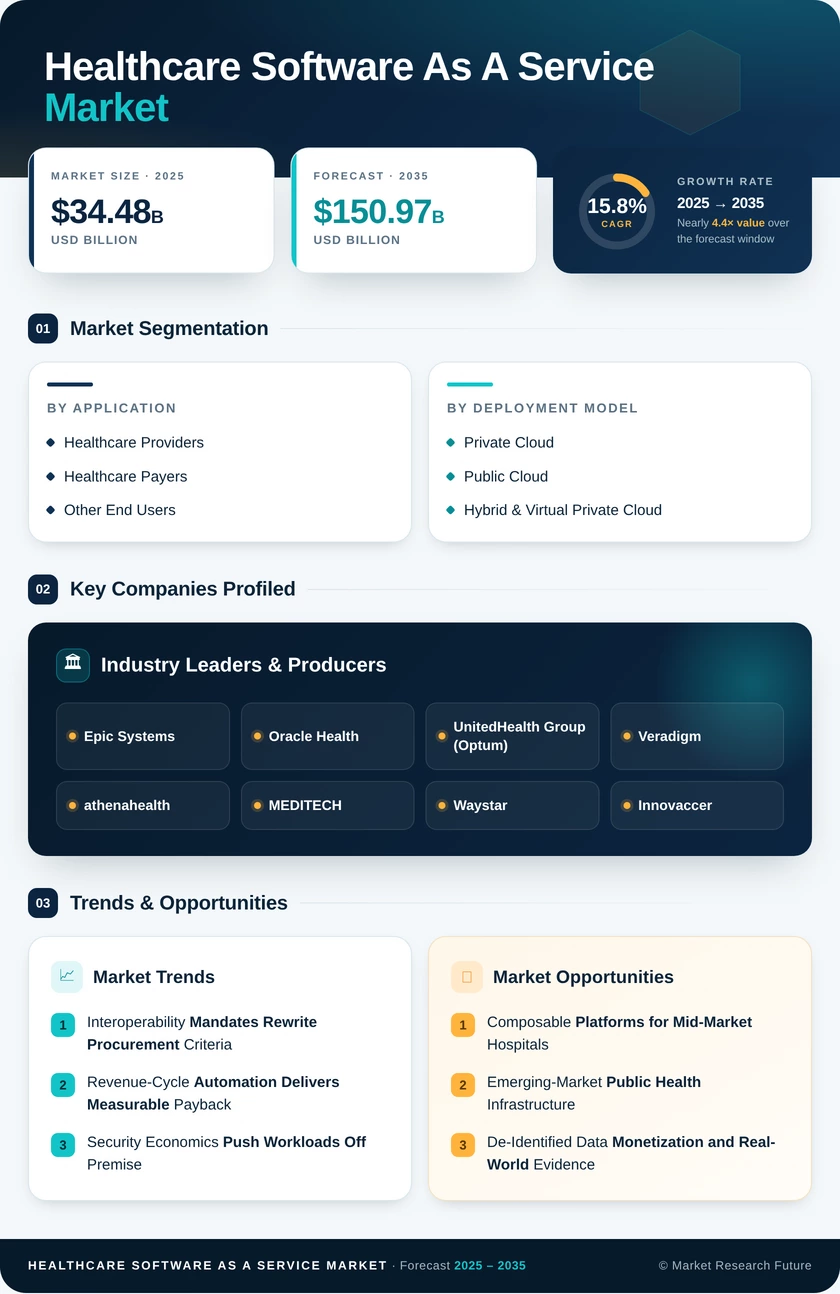
Healthcare Software as a service Market (2026 - 2035)

Healthcare Software-as-a-service Market Research Report: Size, Share, Trend Analysis By Deployment Model (Cloud-based, On-premises), By Applications (Electronic Health Records (EHRs), Practice Management, Revenue Cycle Management, Patient Engagement, Telemedicine), By End-user (Hospitals, Clinics, Ambulatory Surgery Centers, Long-term Care Facilities, Physician Practices), By Functionality (Scheduling, Billing, Medical Records Management, Patient Communication, Decision Support) and By Regional (North America, Europe, South America, Asia Pacific, Middle East and Africa) - Growth Outlook & Industry Forecast 2025 To 2035

Forecast Period
2026-2035
CAGR
15.8%
2025 Market Size
USD 34.48 Billion
2035 Market Size
USD 150.97 Billion
Healthcare ● Updated August 2026 Report ID: MRFR/HC/28018-HCR | Pages: 128 | Author: Rahul Gotadki, Kinjoll Dey
  1. 1 Market Overview |
    1. 1.1 Study Assumptions & Market Definition |
    2. 1.2 Scope of the Study |
    3. 1.3 Research Methodology
  2. 2 Market Summary & Key Report Takeaways |
    1. 2.1 By Application |
    2. 2.2 By Deployment Model |
    3. 2.3 By End-User |
    4. 2.4 By Geography
  3. 3 Global Market Size & Forecast (2021–2035) |
    1. 3.1 Historical Market Size (2021–2025) |
    2. 3.2 Current & Forecast Market Size (2026–2035) |
    3. 3.3 Market Size by Revenue (USD Billion) |
    4. 3.4 Year-over-Year Growth Analysis
  4. 4 Driver Impact Analysis |
    1. 4.1 Interoperability Mandates Rewrite Procurement Criteria |
    2. 4.2 Revenue-Cycle Automation Delivers Measurable Payback |
    3. 4.3 Security Economics Push Workloads Off Premise |
    4. 4.4 Ambient Clinical Intelligence Enters Standard Workflow
  5. 5 Restraints Impact Analysis |
    1. 5.1 Sovereignty Rules Fragment the Delivery Model |
    2. 5.2 Migration Complexity Delays Contract Value Realization |
    3. 5.3 Subscription Fatigue Meets Constrained Operating Margins
  6. 6 Market Opportunity Analysis |
    1. 6.1 Composable Platforms for Mid-Market Hospitals |
    2. 6.2 Emerging-Market Public Health Infrastructure |
    3. 6.3 De-Identified Data Monetization and Real-World Evidence |
    4. 6.4 Payer-Provider Convergence Platforms |
    5. 6.5 Embedded Regulatory Reporting as a Service |
    6. 6.6 Industry Value Chain Analysis |
    7. 6.7 Porter's Five Forces Analysis
  7. 7 Regional Market Share & Country-Level Analysis |
    1. 7.1 North America | |
      1. 7.1.1 US | |
      2. 7.1.2 Canada | |
      3. 7.1.3 Mexico |
    2. 7.2 Europe | |
      1. 7.2.1 Germany | |
      2. 7.2.2 UK | |
      3. 7.2.3 France | |
      4. 7.2.4 Italy | |
      5. 7.2.5 Spain | |
      6. 7.2.6 Nordic Countries | |
      7. 7.2.7 Russia | |
      8. 7.2.8 Rest of Europe |
    3. 7.3 Asia-Pacific | |
      1. 7.3.1 China | |
      2. 7.3.2 India | |
      3. 7.3.3 Japan | |
      4. 7.3.4 South Korea | |
      5. 7.3.5 ASEAN | |
      6. 7.3.6 Rest of Asia-Pacific |
    4. 7.4 South America | |
      1. 7.4.1 Brazil | |
      2. 7.4.2 Argentina | |
      3. 7.4.3 Rest of South America |
    5. 7.5 Middle East & Africa | |
      1. 7.5.1 Saudi Arabia | |
      2. 7.5.2 UAE | |
      3. 7.5.3 South Africa | |
      4. 7.5.4 Egypt | |
      5. 7.5.5 Rest of Middle East & Africa
  8. 8 Future Outlook (2026–2035) |
    1. 8.1 Autonomous Administrative Operations |
    2. 8.2 Platform Economics and Ecosystem Lock-In |
    3. 8.3 Regulatory Convergence on AI Assurance |
    4. 8.4 Sustainability and Total Cost Transparency
  9. 9 Market Segmentation Analysis |
    1. 9.1 By Application | |
      1. 9.1.1 Clinical Information Systems SaaS | |
      2. 9.1.2 Non-Clinical Information Systems SaaS |
    2. 9.2 By Deployment Model | |
      1. 9.2.1 Public Cloud | |
      2. 9.2.2 Private Cloud | |
      3. 9.2.3 Hybrid & Virtual Private Cloud |
    3. 9.3 By End-User | |
      1. 9.3.1 Healthcare Providers | |
      2. 9.3.2 Healthcare Payers | |
      3. 9.3.3 Other End Users
  10. 10 Competitive Landscape |
    1. 10.1 Market Concentration Analysis (2026) |
    2. 10.2 Competitive Benchmarking Matrix |
    3. 10.3 Company Profiles | |
      1. 10.3.1 Epic Systems | |
      2. 10.3.2 Oracle Health | |
      3. 10.3.3 UnitedHealth Group (Optum) | |
      4. 10.3.4 Veradigm | |
      5. 10.3.5 athenahealth | |
      6. 10.3.6 MEDITECH | |
      7. 10.3.7 Waystar | |
      8. 10.3.8 Innovaccer | |
      9. 10.3.9 NextGen Healthcare | |
      10. 10.3.10 Philips | |
      11. 10.3.11 Salesforce | |
      12. 10.3.12 Microsoft
  11. 11 Recent News & Developments
  12. 12 Report Scope & Methodology |
    1. 12.1 Study Period & Base Year |
    2. 12.2 Data Sources & Citations |
    3. 12.3 Abbreviations
  13. 13 Detailed Sources and Citations
  14. 14 Frequently Asked Questions
  15. 15 LIST OF TABLES |
  16. TABLE 1 Global Healthcare Software-as-a-service Market Size & Forecast, by Revenue (USD Billion), 2021–2035 |
  17. TABLE 2 Global Market – Year-over-Year Growth Analysis, 2021–2035 |
  18. TABLE 3 Driver Impact Analysis Matrix, 2026–2035 |
  19. TABLE 4 Restraint Impact Analysis Matrix, 2026–2035 |
  20. TABLE 5 Global Market Size, by Application, 2021–2035 (USD Billion) |
  21. TABLE 6 Global Market Size, by Deployment Model, 2021–2035 (USD Billion) |
  22. TABLE 7 Global Market Size, by End-User, 2021–2035 (USD Billion) |
  23. TABLE 8 Global Market Size, by Region, 2021–2035 (USD Billion) |
  24. TABLE 9 North America Market Size, by Country, 2021–2035 (USD Billion) |
  25. TABLE 10 Europe Market Size, by Country, 2021–2035 (USD Billion) |
  26. TABLE 11 Asia-Pacific Market Size, by Country, 2021–2035 (USD Billion) |
  27. TABLE 12 South America Market Size, by Country, 2021–2035 (USD Billion) |
  28. TABLE 13 Middle East & Africa Market Size, by Country, 2021–2035 (USD Billion) |
  29. TABLE 14 North America Market Size, by Application, 2021–2035 (USD Billion) |
  30. TABLE 15 North America Market Size, by Deployment Model, 2021–2035 (USD Billion) |
  31. TABLE 16 North America Market Size, by End-User, 2021–2035 (USD Billion) |
  32. TABLE 17 Europe Market Size, by Application, 2021–2035 (USD Billion) |
  33. TABLE 18 Europe Market Size, by Deployment Model, 2021–2035 (USD Billion) |
  34. TABLE 19 Europe Market Size, by End-User, 2021–2035 (USD Billion) |
  35. TABLE 20 Asia-Pacific Market Size, by Application, 2021–2035 (USD Billion) |
  36. TABLE 21 Asia-Pacific Market Size, by Deployment Model, 2021–2035 (USD Billion) |
  37. TABLE 22 Asia-Pacific Market Size, by End-User, 2021–2035 (USD Billion) |
  38. TABLE 23 South America Market Size, by Application, 2021–2035 (USD Billion) |
  39. TABLE 24 South America Market Size, by Deployment Model, 2021–2035 (USD Billion) |
  40. TABLE 25 South America Market Size, by End-User, 2021–2035 (USD Billion) |
  41. TABLE 26 Middle East & Africa Market Size, by Application, 2021–2035 (USD Billion) |
  42. TABLE 27 Middle East & Africa Market Size, by Deployment Model, 2021–2035 (USD Billion) |
  43. TABLE 28 Middle East & Africa Market Size, by End-User, 2021–2035 (USD Billion) |
  44. TABLE 29 US Market Size, by Application and End-User, 2021–2035 (USD Billion) |
  45. TABLE 30 Germany Market Size, by Application and End-User, 2021–2035 (USD Billion) |
  46. TABLE 31 UK Market Size, by Application and End-User, 2021–2035 (USD Billion) |
  47. TABLE 32 China Market Size, by Application and End-User, 2021–2035 (USD Billion) |
  48. TABLE 33 India Market Size, by Application and End-User, 2021–2035 (USD Billion) |
  49. TABLE 34 Japan Market Size, by Application and End-User, 2021–2035 (USD Billion) |
  50. TABLE 35 Brazil Market Size, by Application and End-User, 2021–2035 (USD Billion) |
  51. TABLE 36 Saudi Arabia Market Size, by Application and End-User, 2021–2035 (USD Billion) |
  52. TABLE 37 Competitive Benchmarking Matrix, 2026 |
  53. TABLE 38 Company Profiles – Key Players |
  54. TABLE 39 Recent Developments & Strategic Announcements, 2023–2025 |
  55. TABLE 40 Report Scope & Methodology Summary |
  56. TABLE 41 Detailed Sources and Citations Index
  57. 16 LIST OF FIGURES |
  58. FIGURE 1 Global Healthcare Software-as-a-service Market Dynamics – Drivers, Restraints, Opportunities |
  59. FIGURE 2 Industry Value Chain Analysis |
  60. FIGURE 3 Porter's Five Forces Analysis |
  61. FIGURE 4 Global Market Size Trend, 2021–2035 (USD Billion) |
  62. FIGURE 5 Year-over-Year Growth Curve, 2022–2035 (%) |
  63. FIGURE 6 Driver Impact Contribution Chart |
  64. FIGURE 7 Restraint Drag Contribution Chart |
  65. FIGURE 8 Market Share by Application, 2025 vs 2035 (%) |
  66. FIGURE 9 Market Share by Deployment Model, 2025 vs 2035 (%) |
  67. FIGURE 10 Market Share by End-User, 2025 vs 2035 (%) |
  68. FIGURE 11 Regional Revenue Share, 2025 (%) |
  69. FIGURE 12 Regional CAGR Comparison, 2026–2035 (%) |
  70. FIGURE 13 North America Country Share Breakdown, 2025 (%) |
  71. FIGURE 14 Europe Country Share Breakdown, 2025 (%) |
  72. FIGURE 15 Asia-Pacific Country Share Breakdown, 2025 (%) |
  73. FIGURE 16 Competitive Landscape – Vendor Positioning Quadrant, 2026 |
  74. FIGURE 17 Estimated Revenue Share Ranges of Leading Vendors, 2025 (%) |
  75. FIGURE 18 Market Concentration Index Trend, 2021–2035
Share::
Request Free Sample

Segmentation Quick Reference

DimensionSub-SegmentsDominant SegmentFastest Growing Segment
By ApplicationClinical Information Systems SaaS; Non-Clinical Information Systems SaaSNon-Clinical Information Systems SaaSClinical Information Systems SaaS
By Deployment ModelPublic Cloud; Private Cloud; Hybrid & Virtual Private CloudPrivate CloudHybrid & Virtual Private Cloud
By End-UserHealthcare Providers; Healthcare Payers; Other End UsersHealthcare ProvidersHealthcare Payers
By GeographyNorth America; Europe; Asia-Pacific; South America; Middle East & AfricaNorth AmericaAsia-Pacific


Market Segmentation Overview

By Application

Sub-SegmentKey Trend
Clinical Information Systems SaaSAmbient documentation and decision-support modules attach to existing platform tenancies.
Non-Clinical Information Systems SaaSRevenue-cycle, scheduling, and supply-chain workloads move first because payback is measurable within quarters.


Application choice tracks who controls the budget. Administrative modules clear finance committees quickly; clinical modules require physician governance, validation cycles, and longer proof periods — which delays revenue but deepens retention once live.

By Deployment Model

Sub-SegmentKey Trend
Public CloudHyperscaler HIPAA-eligible service catalogs expand, drawing analytics and imaging workloads.
Private CloudPreferred where data-residency covenants or legacy audit commitments constrain architecture
Hybrid & Virtual Private CloudBecomes the durable end-state for large systems mid-migration, often for five years or longer


Deployment preference is a risk decision more than a technical one. Committees approve the model they can explain to auditors, which is why hybrid architectures intended as transitional keep getting renewed.

By End-User

Sub-SegmentKey Trend
Healthcare ProvidersConcentrated EHR replacement cycles through 2032 sustain the largest revenue pool.
Healthcare PayersPrior-authorization API deadlines force platform procurement on fixed regulatory timelines
Other End UsersLife sciences, pharmacy networks, and public health agencies adopt for evidence generation and surveillance.


Buyer type determines deal shape. Providers negotiate on total cost and clinician disruption; payers negotiate on compliance certainty and throughput guarantees; life-sciences buyers negotiate on data rights above all else.


Opus 5 High

Share::
Request Free Sample
Download PDF ×

We do not share your information with anyone. However, we may send you emails based on your report interest from time to time. You may contact us at any time to opt-out.