Heat Pump Market (2026 - 2035)

Heat Pump Market Research Report By Technology (Air Source, Ground Source (Geothermal), Water Source, Hybrid (Boiler-Paired)), By Application (Residential, Commercial, Industrial), By Rated Capacity (Up to 10 kW, 10–30 kW, Above 30 kW), By Refrigerant (R32, R410A and Other HFCs, R290 (Propane), CO2 (R744), Others) and By Regional (North America, Europe, South America, Asia Pacific, Middle East and Africa) - Forecast to 2035
ID: MRFR/EnP/5547-HCR
200 Pages
Chitranshi Jaiswal
Last Updated: August 27, 2026
Heat Pump Market
Market Size
Forecast Period2026-2035
CAGR (2026-2035)9.3%
2025 Market SizeUSD 92.5 Billion
2035 Market SizeUSD 225.1 Billion
Key Players
Daikin Industries
Midea Group
Mitsubishi Electric
Gree Electric
Carrier Global
Bosch Home Comfort
Opportunities
  • Retrofit-First Hybrid Deployment
  • Industrial Steam Replacement
  • Emerging-Market Water Heating

Heat Pump Market Summary

The Heat Pump Market reached USD 92.5 billion in 2025 and enters the forecast window at USD 101.1 billion in 2026, expanding to USD 225.1 billion by 2035 at a 9.3% CAGR. Two catalysts anchor that trajectory. The European Union's revised Energy Performance of Buildings Directive requires member states to end fossil-fuel boiler subsidies from January 2025 and phase standalone boilers out of new construction, while the U.S. Inflation Reduction Act channels roughly USD 8.8 billion into home energy rebates administered through state energy offices [1][6].

Electrified thermal equipment is displacing an installed base that is overwhelmingly combustion-based. Gas and oil boilers, resistance electric heaters, and separate chiller-boiler pairings are giving way to reversible inverter units, cascade systems, and high-temperature industrial heat pump platforms capable of delivering 90–150 °C process steam. The International Energy Agency estimates global heat pump manufacturing investment exceeded USD 4 billion between 2022 and 2024, with roughly two-thirds directed at European and Chinese plants [2].

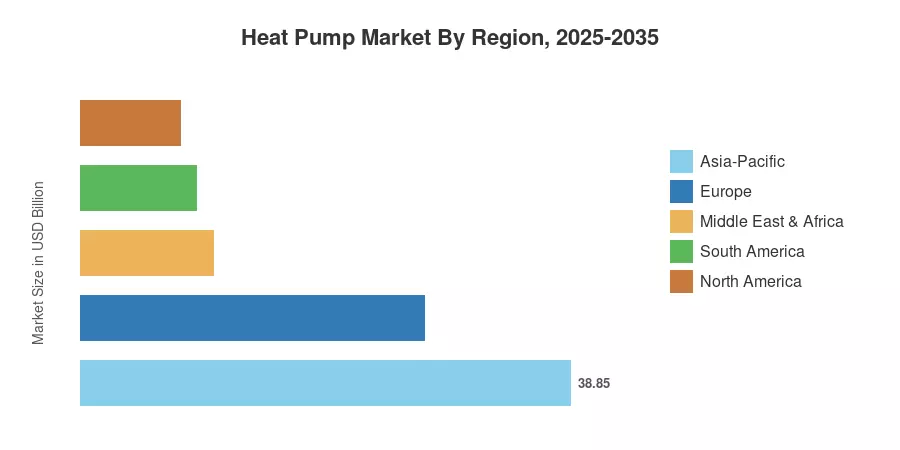
Regionally, Asia-Pacific holds 42.0% of 2025 revenue, powered by China's dual role as the largest producer and largest consumer. Middle East & Africa grows fastest at 11.4% CAGR from a modest base, driven by Gulf water-heating retrofits. Europe ranks second at 29.5%, where policy is the demand engine rather than climate. The next decade will hinge on whether electricity pricing reform keeps pace with equipment cost declines.


Key Report Takeaways

• By Technology

  • Air-source systems command 71.5% of 2025 Heat Pump Market revenue, reflecting lower installed cost and retrofit flexibility
  • Ground-source installations post a 10.1% CAGR through 2035 as district-scale and campus projects scale.
  • Hybrid configurations pairing an electric unit with an existing boiler advance at 12.3% CAGR in retrofit-heavy Europe.

• By Application

  • Residential accounts for 58.0% of installed value, the largest single demand pool.
  • Commercial buildings contribute USD 24.98 billion in 2025 across offices, retail, and hospitality.
  • Industrial process heat is the fastest-expanding sector at 13.8% CAGR.

• By Region

  • Asia-Pacific leads the Heat Pump Market with 42.0% revenue share in 2025.
  • Europe generated USD 27.29 billion in 2025.
  • North America grows at 8.6% CAGR, tempered by uneven state-level incentive continuity.


Market Size and Forecast (2021–2035)

Figures below blend shipment data from national trade associations, customs-level trade flows, manufacturer disclosures, and installer-channel surveys, reconciled against public incentive-program uptake records. Historical values reflect realized revenue; forecast values apply unit-volume projections against a declining blended average selling price. Currency is nominal USD.
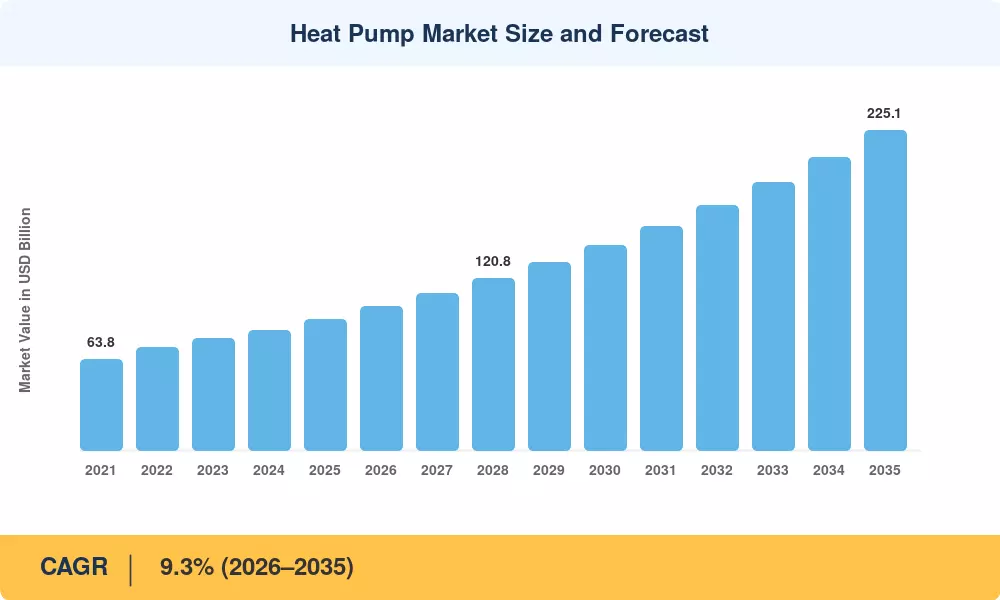
Heat Pump Market Size and Forecast
Our Impact
Enabled $4.3B Revenue Impact for Fortune 500 and Leading Multinationals
Partnering with 2000+ Global Organizations Each Year
30K+ Citations by Top-Tier Firms in the Industry

Driver Impact Analysis

Driver ~% Impact on CAGR Geographic Relevance Impact Timeline
Building decarbonization mandates and boiler phase-outs +2.1 Europe, North America Long-term (≥4 yr)
China clean heating program and urban HVAC replacement +1.9 Asia-Pacific Medium-term (2–4 yr)
Electricity-to-gas price ratio reform +1.6 Europe, Japan Medium-term (2–4 yr)
Industrial process heat electrification +1.4 Global Long-term (≥4 yr)
Retrofit tax credits and rebate programs +1.2 North America, UK Short-term (≤2 yr)
Cooling demand convergence on reversible units +1.1 APAC, MEA, South America Short-term (≤2 yr)
Low-GWP refrigerant transition +0.8 EU, US, Japan Medium-term (2–4 yr)


Building Decarbonization Mandates

Regulation now defines the minimum demand. The recast EPBD, which took effect in May 2024, requires member states to publish national boiler phase-out roadmaps and bans fossil-fuel-only systems in new buildings by 2030 [1]. Denmark and the Netherlands took earlier steps; the Dutch hybrid mandate alone covers around 7 million households. In the US, a pact of nine states in 2023 targets 65% of residential heating shipments to be electrified by 2030, and 90% by 2040 [5].


China's Clean Heating Buildout

Over 35 million households in the north of Beijing have switched from coal since 2017 as part of the clean heating initiative, with air-source equipment being the main source for rural conversions [7]. Provincial procurement is on multi-year tenders offering domestic manufacturers volume certainty that Western suppliers rarely enjoy. The scale advantage reduces global unit prices. That’s why Chinese export volumes to Europe and South America surged substantially through 2024.


Industrial Process Heat Electrification

Thermal loads for manufacturing below 200 °C account for around 30% of industrial energy demand, and the technology envelope has expanded sufficiently to cover most of it [2]. Early adopters include food processors, chemicals, pulp & paper, and district energy operators. The EU Innovation Fund allocated approximately EUR 400 million to projects including large-scale electric heat recovery for 2023–2024 [11]. Several dairy businesses already declare payback in less than five years at prevailing tariff margins.


Consumer Incentive Architecture

Rebates affect buying behavior faster than mandates. In the US, section 25C of the tax law allows for a 30% credit (up to USD 2,000 per year) on qualified equipment, in addition to state Home Electrification reimbursements of up to USD 8,000 for low-income households [6]. The UK’s Boiler Upgrade Scheme increased its payment to GBP 7,500 in October 2023, and the monthly application volumes nearly tripled in a year [10].


Restraints Impact Analysis

Restraint weightings follow the same directional convention as Section 4. They quantify drag on the growth rate of the Heat Pump Market rather than absolute revenue loss, and they are not additive.

Restraint ~% Impact on CAGR Geographic Relevance Impact Timeline
Installed-cost premium and retrofit disruption −1.5 Global Short-term (≤2 yr)
Unfavourable electricity-to-gas price spread −1.3 Europe Short-term (≤2 yr)
Skilled installer shortage −1.1 Europe, North America Medium-term (2–4 yr)
Grid capacity and winter peak constraints −0.7 North America, Europe Long-term (≥4 yr)
Cold-climate performance perception −0.6 Northern Europe, Canada Medium-term (2–4 yr)


The Installed-Cost Gap

The bill includes more than just equipment. A typical UK retrofit costs GBP 10,000–14,000 before grant, against GBP 3,000–4,000 for a replacement gas boiler, with emitter modifications and hot-water cylinder installation accounting for a third of the delta [8]. The grants are bridging the deficit in certain markets, and just narrowing the gap in others. Until installation labor productivity improves, upfront cost will continue to be the most-cited reason families delay.


Electricity Pricing Distortion

Tariff structure often works against the technology. German household electricity averaged roughly 4.0 times the gas rate through 2024, meaning a seasonal coefficient of performance above 4.0 was needed simply to break even on running cost [3]. Countries that shifted levies off electricity — Finland and Sweden among them — show markedly higher adoption at comparable climates. Pricing reform, not equipment innovation, is the binding constraint in several large European economies.

Workforce Capacity

Installer supply limits how fast policy can convert into shipments. The European Heat Pump Association estimates the sector needs roughly 500,000 additional trained installers by 2030 to meet stated national targets [10]. Certification pathways take six to eighteen months, and poor-quality early installs generate reputational damage that outlasts the individual job. Manufacturers are responding by funding training academies, though capacity additions still lag policy ambition.


Heat Pump Market Opportunities

Retrofit-First Hybrid Deployment

Pairing a modestly sized electric unit with a retained boiler removes the emitter-upgrade barrier and suits older, poorly insulated housing stock. Dutch and Belgian utilities have built propositions around this configuration, and it opens the addressable base well beyond new construction.

Industrial Steam Replacement

Above-100 °C delivery unlocks food, beverage, and chemical loads previously reserved for gas boilers. Vendors that package heat recovery, storage, and controls as a turnkey retrofit will capture margin that pure equipment sales cannot.

Emerging-Market Water Heating

India, Brazil, Indonesia, and the Gulf states present large sanitary hot-water demand with negligible space-heating requirement. Commercial units serving hotels, hospitals, and residential towers offer three-to-five-year paybacks against resistance heating, and financing rather than technology is the gating factor.

Flexibility and Data Monetization

Connected units are dispatchable thermal assets. Aggregators in the UK, France, and California already pay households for load-shifting, and manufacturers holding the telemetry layer can monetize fleet performance data through predictive maintenance subscriptions and warranty analytics.

Low-GWP Platform Leadership

The R290 propane heat pump refrigerant shift rewards early movers with charge-limit engineering expertise. Suppliers that certify compact outdoor units under EN 378 safety envelopes ahead of tightening F-gas quotas will hold a durable specification advantage in Europe.


Heat Pump Market Future Outlook

Thermal Assets Join the Grid Edge

By 2035, a meaningful share of installed units will operate under dynamic tariffs or aggregator control. The IEA projects global installed capacity supporting demand-side flexibility to grow several-fold this decade, and thermal storage buffers make heating loads among the cheapest flexibility available [2]. Utilities that treat these as dispatchable capacity, rather than as new load to be feared, will avoid substantial network reinforcement spending.

Industrial Steam Becomes the Growth Frontier

Process heat represents the largest untapped pool in the Heat Pump Market. IRENA estimates that electrifying sub-200 °C industrial heat could abate roughly 1.1 gigatonnes of CO2 annually at scale [18]. Expect vendor consolidation as HVAC incumbents acquire industrial refrigeration specialists to reach the temperature envelope customers require.

Refrigerant Regulation Reshapes Product Portfolios

The EU F-gas Regulation adopted in 2024 bans most HFCs in small monobloc units from 2027 and in larger split systems from 2035, while the U.S. AIM Act steps HFC production down 85% by 2036 [12]. Manufacturers face a compressed redesign cycle across entire portfolios, and those already shipping natural-refrigerant lines will convert regulatory pressure into share.

Service Economics Overtake Equipment Margin

Hardware margins compress as Chinese capacity scales, pushing value toward commissioning, monitoring, and performance guarantees. Fleet telemetry allows suppliers to underwrite seasonal efficiency contractually — a shift from selling a box to selling delivered heat. Companies with installed-base data advantages will price risk better than pure manufacturers.


Heat Pump Market Segmentation

By Technology

Air-source equipment dominates the Heat Pump Market on installed-cost and retrofit grounds, while ground-source holds a performance edge in campus and district applications.

Segment Metric (2025) Primary Demand Driver
Air Source 71.5% share Lowest installed cost, retrofit flexibility
Ground Source (Geothermal) 10.1% CAGR (2026–2035) Campus and district-scale projects
Water Source USD 8.33 Billion Industrial and large commercial loads
Hybrid (Boiler-Paired) 12.3% CAGR (2026–2035) Retrofit of older housing stock


Air-source dominance reflects economics rather than physics: no borehole drilling, no water rights, and installation crews already familiar with split-system practice. Ground-source, though a fraction of unit volume, delivers higher seasonal efficiency and far more stable winter output, which makes it the default for universities, hospitals, and Nordic district schemes where 25-year lifecycle cost governs the decision.

By Application

Residential volume anchors the Heat Pump Market, but industrial applications carry the steepest growth trajectory.

Segment Metric (2025) Primary Demand Driver
Residential 58.0% share Boiler phase-outs, consumer rebates
Commercial USD 24.98 Billion Building codes, hospitality retrofit
Industrial 13.8% CAGR (2026–2035) Process heat electrification, carbon pricing


Residential purchasing is fragmented across millions of individual decisions, which makes it responsive to grants and vulnerable to policy uncertainty — the German 2024 slump illustrated both. Industrial buyers behave differently, running discounted cash-flow analysis against carbon prices and gas forward curves, so their commitments tend to be larger, slower, and far stickier once made.

By Rated Capacity

Capacity mix within the Heat Pump Market maps closely to building typology and installer channel.

Segment Metric (2025) Primary Demand Driver
Up to 10 kW 46.0% share Single-family dwellings, apartments
10–30 kW 11.5% CAGR (2026–2035) Small commercial, multi-family
Above 30 kW USD 19.43 Billion Industrial, district, large commercial


The Up to 10 kW segment leads the Heat Pump Market by rated capacity with a 46.0% share in 2025, operating as the default sizing standard for single-family residences, row houses, and urban apartments undergoing decarbonization retrofits. Meanwhile, the 10–30 kW segment represents the fastest-expanding capacity class, projecting a market-leading CAGR of 11.5% over the forecast period (2026–2035), propelled by expanding multi-family housing developments, small office complexes, and light commercial space heating needs.


By Refrigerant

Segment Metric (2025) Primary Demand Driver
R32 38.0% share Mainstream split and monobloc platforms
R410A and other HFCs USD 31.45 Billion Legacy installed base and replacement parts
R290 (Propane) 18.9% CAGR (2026–2035) F-gas quota compliance in Europe
CO2 (R744) 8.0% share High-temperature water heating, Japan
Others 4.0% share Ammonia industrial systems, blends


The R32 segment leads the Heat Pump Market by refrigerant type with a 38.0% share in 2025, serving as the dominant mid-GWP transitional refrigerant across residential split systems and monobloc units globally. Meanwhile, R290 (Propane) represents the fastest-growing refrigerant segment, projecting a market-leading CAGR of 18.9% over the forecast period (2026–2035).


Regional Market Share Analysis

Region Metric (2025 unless noted) Primary Investment Themes
North America 8.6% CAGR (2026–2035) Cold-climate product lines, utility rebate stacking
Europe USD 27.29 Billion Boiler phase-out compliance, hybrid retrofit, installer training
Asia-Pacific 42.0% share Manufacturing capacity, rural coal conversion, export platforms
South America 9.9% CAGR (2026–2035) Hotel and hospital water heating, pool and leisure systems
Middle East & Africa 11.4% CAGR (2026–2035) Sanitary hot water, district energy, efficiency standards
Total USD 92.5 Billion

Demand in the Heat Pump Market splits along three distinct logics: policy-pushed replacement in Europe, industrial-scale manufacturing plus rural conversion in Asia-Pacific, and incentive-driven premium retrofit in North America.


North America

Country Metric Key Driver
United States 82.0% of regional revenue 25C tax credit and state electrification rebates
Canada USD 2.24 Billion Greener Homes financing, cold-climate mandates
Mexico 10.7% CAGR Commercial water heating, industrial retrofit


Shipment mix in the United States tilted decisively after 2022, with electric units outselling gas furnaces by roughly 21% in 2024 according to trade-association data [4]. The Department of Energy's Cold Climate Challenge validated units maintaining full capacity at −15 °C, dismantling the main technical objection in northern states [15]. Policy risk remains the live variable, since rebate administration sits with individual state energy offices and disbursement schedules diverge widely.

Europe

Country Metric Key Driver
Germany 21.5% of regional revenue GEG 65% renewable heating requirement
France USD 5.19 Billion MaPrimeRénov' and oil boiler replacement
United Kingdom 12.8% CAGR Boiler Upgrade Scheme, Future Homes Standard
Italy 11.0% of regional revenue Superbonus legacy, reversible cooling demand
Nordics USD 3.41 Billion Mature ground-source base, low electricity tariffs
Rest of Europe 9.4% CAGR National EPBD transposition


Germany's Gebäudeenergiegesetz, effective January 2024, requires new heating systems to run on at least 65% renewable energy, with municipal heat planning deadlines of 2026 for large cities and 2028 elsewhere [9]. Sales nonetheless fell sharply in 2024 as households waited for planning clarity and subsidy detail. Nordic markets show the counterfactual: Norway and Sweden exceed one unit per three households, largely because electricity carries far lighter levies than in continental Europe.

Asia-Pacific

Country Metric Key Driver
China 58.5% of regional revenue Clean heating program, export manufacturing
Japan USD 6.61 Billion EcoCute CO2 water heaters, ZEH targets
India 13.6% CAGR Commercial hot water, industrial drying
South Korea 6.2% of regional revenue Green New Deal building retrofits
Australia USD 1.98 Billion Victoria gas substitution roadmap, STC rebates
Rest of Asia-Pacific 10.8% CAGR Hospitality and residential tower construction


Japan's Eco Cute programme has installed over nine million CO2-refrigerant water heaters since 2001, giving the country the deepest per-capita experience with transcritical systems anywhere [12]. China's manufacturing base, meanwhile, supplies roughly 40% of global unit output and has become the swing factor in European pricing. Australia's Victorian government banned gas connections in new homes from January 2024, an early template other states are studying.

South America

Country Metric Key Driver
Brazil 61.0% of regional revenue Hotel and hospital sanitary hot water
Chile USD 0.42 Billion Santiago air-quality wood-burner replacement
Rest of South America 9.1% CAGR Commercial construction, pool heating


Brazil's demand profile centres on displacing electric resistance showers and boilers in multi-family and hospitality buildings, where running-cost savings alone justify the investment. Chile offers a policy-led niche: the Ministry of Environment's decontamination plans in southern cities subsidize replacement of residential wood stoves, a programme that has grown steadily since 2021 [16]. Financing access, rather than awareness, limits faster uptake across the region.

Middle East & Africa

Country Metric Key Driver
Saudi Arabia 33.5% of regional revenue Saudi Energy Efficiency Program building codes
United Arab Emirates USD 0.89 Billion Dubai Green Building Regulations, hotel retrofits
South Africa 12.4% CAGR Load-shedding-driven efficiency, geyser replacement
Rest of Middle East & Africa 10.6% CAGR Commercial construction, district energy


Gulf demand runs almost entirely through domestic hot water and pool applications rather than space heating, with hotel and labour-accommodation retrofits leading. South Africa presents an unusual case where chronic grid constraint makes efficiency a resilience measure; Eskom's residential programmes have promoted replacement of resistive geysers for over a decade [17]. Regional standards harmonization remains patchy, which slows multinational product rollouts.


Heat Pump Market By Region, 2025-2035

Competitive Benchmarking

Concentration sits in moderate territory. Market Research Future estimates a Herfindahl-Hirschman Index of roughly 780 for 2025, with the top five suppliers holding an aggregate 38–43% of global revenue. The structure is best described as regionally consolidated but globally fragmented: Daikin, Midea, and Gree dominate Asian volume, while European incumbents retain specification advantage in hydronic applications where installer relationships and boiler-replacement channels matter more than unit economics. Hundreds of regional assemblers and OEM-rebranding firms populate the long tail.

Company Est. Revenue Share Range Key Offerings for Heat Pump Market Strategic Positioning
Daikin Industries ~11–14% Altherma hydronic, VRV, R32 platforms Broadest global footprint; European manufacturing buildout
Midea Group ~8–11% Monobloc, split, commercial modular Cost leadership; large OEM supply relationships
Mitsubishi Electric ~6–8% Ecodan, cold-climate hydronic Cold-climate engineering reputation
Gree Electric ~5–7% Residential and commercial air-source Chinese domestic scale; export expansion
Carrier Global ~5–7% Cold-climate residential, Viessmann portfolio Acquisition-led European entry
Bosch Home Comfort ~4–6% Compress series, hybrid boiler pairings Retrofit channel strength via boiler base
Panasonic ~4–5% Aquarea, R290 monobloc lines Early natural-refrigerant mover
Trane Technologies ~3–5% Commercial and industrial hydronic Applied and district energy focus
NIBE Industrier ~3–4% Ground-source, exhaust-air systems Nordic geothermal specialist
Vaillant Group ~2–4% aroTHERM, hybrid packages Installer-network depth in DACH region


Recent News & Developments

The following milestones shaped competitive positioning in the Heat Pump Market across the 2023–2025 window.


  • Carrier Global (January 2024): Completed its EUR 12 billion acquisition of Viessmann Climate Solutions, instantly establishing a top-tier European hydronic position [19]


  • UK Government (October 2023): Raised the Boiler Upgrade Scheme grant by 50% to GBP 7,500, triggering a sharp increase in monthly applications [10]


  • Bosch (July 2024): Agreed to acquire Johnson Controls' residential and light commercial HVAC business, including the Hitachi joint venture, expanding its North American and Asian reach [19]
  • Victoria, Australia (January 2024): Banned new gas connections for residential dwellings requiring a planning permit, creating a de facto electric heating mandate [20]


Heat Pump Market Report Scope

Parameter Detail
Market Scope Global residential, commercial, and industrial heat pump equipment revenue, including air-source, ground-source, water-source, and hybrid configurations across space heating, cooling, and water heating applications
Study Period 2021–2035 (Historical 2021–2024; Base Year 2025; Forecast 2026–2035)
CAGR 9.3% (2026–2035)
Market Size Checkpoints USD 92.5 Billion (2025); USD 101.1 Billion (2026); USD 144.3 Billion (2030); USD 225.1 Billion (2035)
Fastest Growing Segments Industrial application (13.8% CAGR); Hybrid technology (12.3% CAGR); R290 refrigerant platforms (18.9% CAGR)
Companies Profiled Daikin, Midea, Mitsubishi Electric, Gree, Carrier, Bosch, Panasonic, Trane, NIBE, Vaillant, Samsung, LG, Viessmann, Stiebel Eltron
Valuation Currency Nominal USD, manufacturer revenue basis

FAQs

How should buyers evaluate vendor performance claims when procuring in the Heat Pump Market?
Insist on third-party certified data at multiple ambient temperatures rather than single-point ratings. Verify Eurovent, AHRI, or JRAIA listings and require site-specific sizing calculations before contract award. [15]
What warranty and service structures are typical in the Heat Pump Market?
Compressors generally carry five to ten years of coverage, with two to five years on remaining components. Extended contracts increasingly bundle remote diagnostics and mandatory annual leak checks for larger refrigerant charges. [12]
Do noise regulations meaningfully constrain outdoor unit siting?
Yes. Many European municipalities cap boundary sound at 40–45 dB(A) overnight. Compliance shapes compressor selection, acoustic enclosure design, and minimum setback distances from neighbouring property lines. [13]
How do supply-chain lead times affect project planning in the Heat Pump Market?
Commercial units above 100 kW commonly run 16–28 week lead times versus four to eight weeks for residential stock. Specify approved alternates early and lock compressor allocation at design freeze. [19]
What cybersecurity exposure comes with connected units?
Cloud-linked controllers and aggregation platforms widen the attack surface considerably. The EU Cyber Resilience Act requires manufacturers to supply security updates throughout the declared support period, which is reshaping controller architecture. [21]
Is installer certification a genuine bottleneck?
Yes. Schemes such as MCS in the United Kingdom and NATE in the United States take months to complete. Firms funding in-house apprenticeships are capturing installation margin that subcontractors previously held. [10]
Which financing models are gaining traction?
Heat-as-a-service subscriptions, on-bill repayment, and utility tariff-based financing shift capital burden away from households. Several European utilities now sell fixed monthly comfort contracts covering equipment, installation, and maintenance. [22]    
Author
Author
Author Profile
Chitranshi Jaiswal LinkedIn
Team Lead - Research
Chitranshi is a Team Leader in the Chemicals & Materials (CnM) and Energy & Power (EnP) domains, with 6+ years of experience in market research. She leads and mentors teams to deliver cross-domain projects that equip clients with actionable insights and growth strategies. She is skilled in market estimation, forecasting, competitive benchmarking, and both primary & secondary research, enabling her to turn complex data into decision-ready insights. An engineer and MBA professional, she combines technical expertise with strategic acumen to solve dynamic market challenges. Chitranshi has successfully managed projects that support market entry, investment planning, and competitive positioning, while building strong client relationships. Certified in Advanced Excel & Power BI she leverages data-driven approaches to ensure accuracy, clarity, and impactful outcomes.

Research Approach


Secondary Research

The secondary research process involved comprehensive analysis of regulatory databases, energy efficiency standards, peer-reviewed engineering journals, and authoritative energy organizations. Key sources included the US Department of Energy (DOE), Environmental Protection Agency (EPA) ENERGY STAR program, International Energy Agency (IEA) Heat Pump Centre, European Heat Pump Association (EHPA), Air-Conditioning, Heating, and Refrigeration Institute (AHRI), European Committee of Air Handling and Refrigeration Equipment Manufacturers (Eurovent), ASHRAE (American Society of Heating, Refrigerating and Air-Conditioning Engineers), National Renewable Energy Laboratory (NREL), Lawrence Berkeley National Laboratory (LBNL) Building Technologies & Urban Systems Division, Oak Ridge National Laboratory (ORNL) Building Technologies Research & Integration Center, US Energy Information Administration (EIA), Eurostat Energy Database, International Renewable Energy Agency (IRENA), and national energy ministry reports from key markets including Germany's Federal Ministry for Economic Affairs and Climate Action (BMWK), Japan's Agency for Natural Resources and Energy (ANRE), and China's National Development and Reform Commission (NDRC). These sources were used to collect installation statistics, energy efficiency certification data, carbon emission reduction studies, regulatory incentive programs, and market penetration analysis for air source heat pumps (ASHP), ground source heat pumps (GSHP), water source heat pumps (WSHP), and hybrid heating technologies.


Primary Research

To gather both qualitative and quantitative information, the primary research process involved interviewing players from both the supply and demand sides. Participants from the supply side included chief executive officers, vice presidents of product development, sustainability department leaders, and commercial directors from original equipment manufacturers (OEMs) of heat pumps, compressors, and refrigerants. Commercial and industrial end-users' sustainability officers, building facility managers, mechanical engineers, HVAC contractors, procurement leads from construction and real estate development businesses, and energy auditors made up the demand-side sources. We acquired information on specification trends, distribution channel dynamics, and the effectiveness of the utility rebate program through primary research. The data also validated our product development roadmaps for low-GWP refrigerant transitions and market segmentation across installation types (new build vs. retrofit).

Primary Respondent Breakdown:

By Designation: C-level Primaries (40%), Director Level (32%), Others (28%)

By Region: North America (32%), Europe (30%), Asia-Pacific (28%), Rest of World (10%)


Market Size Estimation

Global market valuation was derived through revenue mapping and installation volume analysis. The methodology included:

Identification of 50+ key manufacturers across North America, Europe, Asia-Pacific, and Latin America spanning residential, commercial, and industrial heat pump systems

Product mapping across air source (ducted/ductless), ground source (vertical/horizontal loop), water source, and hybrid heat pump categories with segmentation by refrigerant type (R-410A, R-32, CO2, hydrocarbons)

Analysis of reported and modeled annual revenues specific to heat pump portfolios, excluding non-HVAC business units

Coverage of manufacturers representing 75-80% of global market share in 2024

Extrapolation using bottom-up (installation volume × ASP by country/region, adjusted for system size kW/ton) and top-down (manufacturer revenue validation against national import/export data) approaches to derive segment-specific valuations for heating, cooling, and hot water supply applications

Download Free Sample

Kindly complete the form below to receive a free sample of this Report

* Please use a valid business email

Download PDF ×

We do not share your information with anyone. However, we may send you emails based on your report interest from time to time. You may contact us at any time to opt-out.

















