Segmentation Quick Reference
| Dimension | Sub-Segments | Dominant Segment | Fastest Growing Segment |
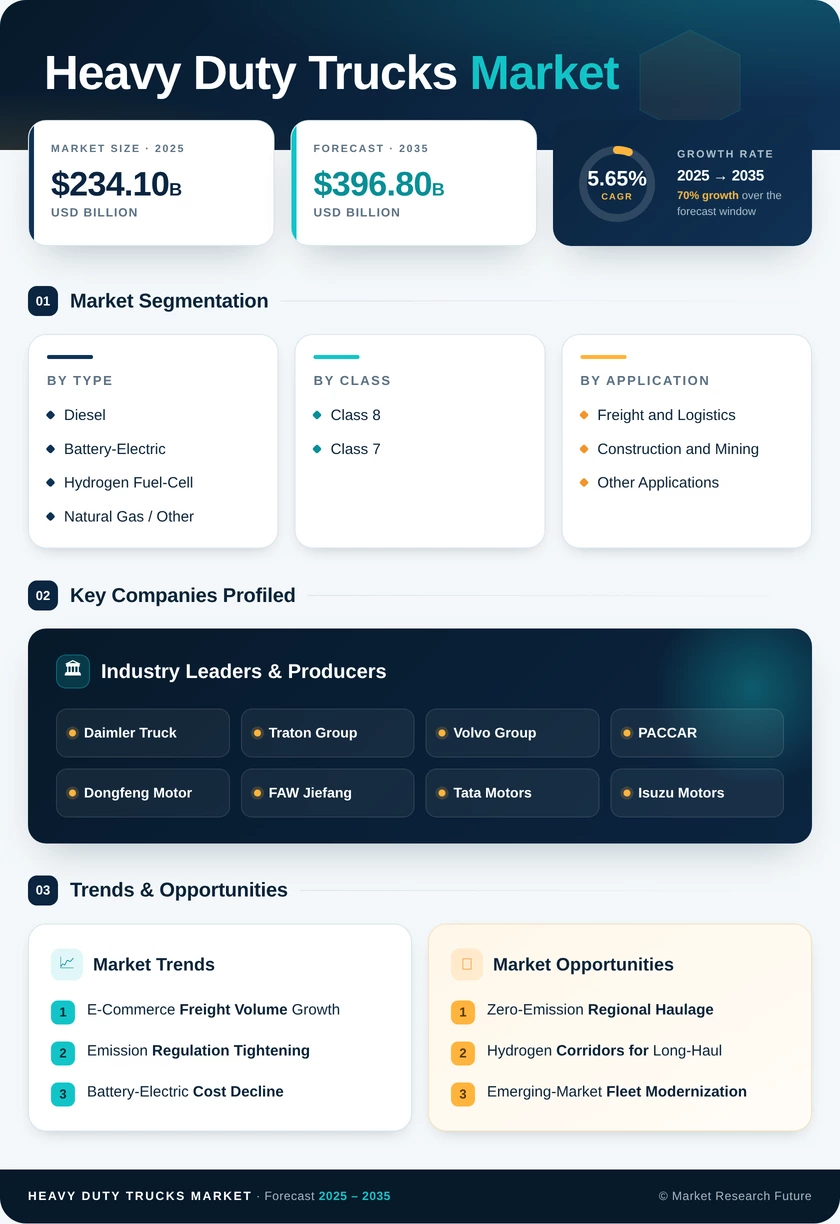
| By Propulsion Type | Diesel, Battery-Electric, Hydrogen Fuel-Cell, Natural Gas / Other | Diesel | Battery-Electric |
| By Class | Class 7, Class 8 | Class 8 | Class 7 |
| By Application | Freight and Logistics, Heavy Duty Trucks Market and Mining, Other Applications | Freight and Logistics | Freight and Logistics |
| By Sales Channel | OEM / First Purchase, Aftermarket / Used | OEM / First Purchase | OEM / First Purchase |
Market Segmentation Overview
By Propulsion Type
| Sub-Segment | Key Trend |
| Diesel | Still dominant for long-haul; under regulatory pressure |
| Battery-Electric | Fastest growth on regional routes via depot charging |
| Hydrogen Fuel-Cell | Emerging for long-haul along refueling corridors |
| Natural Gas / Other | Niche role in fleet diversification |
Propulsion is the defining axis of the Heavy Duty Trucks Market. Diesel retains the volume lead while battery-electric and hydrogen carve out duty-cycle-specific niches, with the transition pace set by infrastructure and total cost of ownership.
By Class
| Sub-Segment | Key Trend |
| Class 7 | Faster growth in vocational and regional distribution |
| Class 8 | Revenue leader anchored by long-haul tractor-trailers |
Class structure mirrors duty cycle. Class 8 dominates line-haul economics while Class 7 grows faster as urban and vocational electrification gains momentum.
By Application
| Sub-Segment | Key Trend |
| Freight and Logistics | Largest and fastest-growing, driven by e-commerce |
| Heavy Duty Trucks Market and Mining | Steady demand tied to infrastructure spend |
| Other Applications | Specialized vocational growth |
Application demand is led by freight and logistics, where e-commerce tonnage keeps fleets running near capacity, while construction and mining provide a cyclical but reliable base.
By Sales Channel
| Sub-Segment | Key Trend |
| OEM / First Purchase | Fastest channel growth on fleet renewal demand |
| Aftermarket / Used | Significant for cost-sensitive operators |
Sales-channel dynamics favor OEM first-purchase as fleets renew ahead of emission deadlines, while the used market remains essential for operators managing capital constraints.