High Purity Gas Market

Key Players: Linde plc, Air Liquide S.A., Air Products & Chemicals, Nippon Sanso Holdings, Messer SE & Co., SOL Group, Taiyo Nippon Sanso, Iwatani Corporation

High Purity Gas Market

High Purity Gas Market Research Report Information By Product (Carbon Gases, Noble Gases, and High Atmospheric Gases), By Application (Electronics, Automotive, and Pharmaceutical), And By Region (North America, Europe, Asia-Pacific, And Rest Of The World) –Market Forecast Till 2035.
ID: MRFR/CnM/2058-HCR
111 Pages
Anshula Mandaokar
Last Updated: June 04, 2026
 

High Purity Gas Market Summary

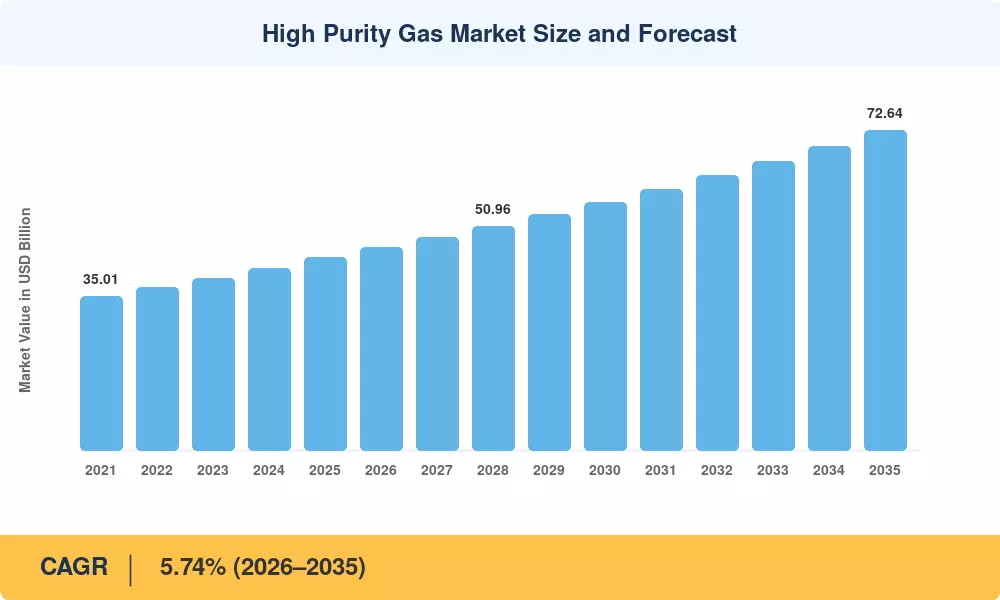
The High Purity Gas Market reached USD 43.78 billion in 2025 and is projected to grow from USD 46.12 billion in 2026 to USD 72.64 billion by 2035, registering a CAGR of 5.74% across the forecast period. Semiconductor fabrication expansion across East Asia — anchored by over USD 380 billion in committed fab investments through 2030 — and the parallel scale-up of green-hydrogen electrolyzer installations are the two primary demand engines driving ultra-high-purity gases consumption[2]. Government incentives such as the U.S. CHIPS and Science Act and the EU Chips Act are locking in multi-year supply agreements for electronic-grade gases well ahead of production timelines.

The industrial gas filtration space is witnessing a fundamental shift. We upgrade legacy cryogenic air separation machines, many built prior to 2010, with membrane-based and molecular-sieve polishing modules to reach the sub-ppb contamination thresholds required by 3 nm and 2 nm semiconductor process gas requirements [3]. AI-driven purity-analytics platforms, now used by at least four of the top five suppliers, are reducing analyzer downtime by 30–40% and increasing product recovery rates, providing a clear cost advantage for early adopters in the compressed specialty gases category.


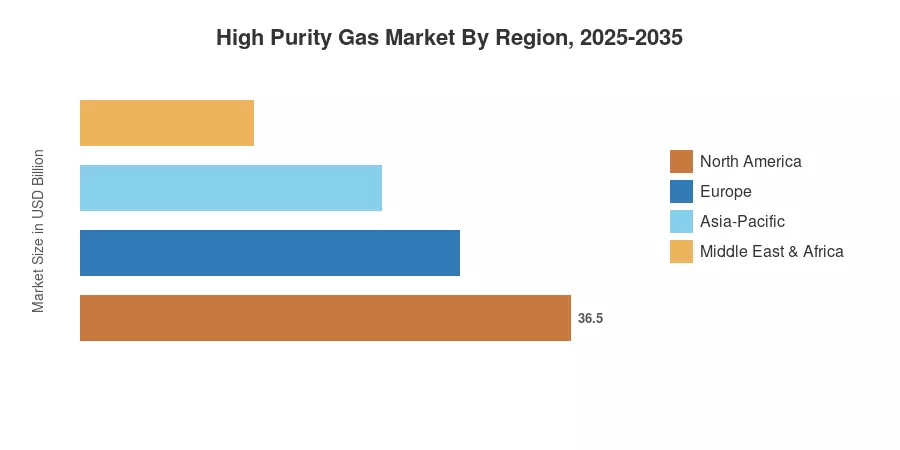
Asia-Pacific dominates the High Purity Gas Market with about 42% share due to fab clusters in Taiwan, South Korea and mainland China. The region also registers the quickest CAGR of 5.62% through 2035, on account of the need for electrolyzer-grade high-purity nitrogen. North America is second, with a roughly 26% share, fueled by the reshoring of semiconductor capacity and increased biopharma fill-finish activity. Europe is a close second on the back of the continent’s fast green-hydrogen corridor buildout and stringent medicinal gas purity regulations [4][5].


Key Report Takeaways

• By Product Type

  • High-purity atmospheric gases held a 44.18% revenue share of the High Purity Gas Market in 2025, underpinned by nitrogen, oxygen, and argon demand from semiconductor and metal-production end users
  • Noble gases are set to expand at a 6.15% CAGR through 2035, with helium and neon supply constraints accelerating on-site recycling investments in the High Purity Gas Market
  • Carbon gases reached USD 5.83 billion in 2025, driven by CO₂ purification needs in food-grade and analytical grade gases applications

• By Application

  • Insulation applications captured a 31.72% share of the High Purity Gas Market in 2025, led by SF₆ alternatives and specialty blends for switchgear
  • Coolant applications are advancing at a 6.32% CAGR, supported by liquid-nitrogen and liquid-helium use in MRI systems and quantum-computing cryogenics

• By End-User Industry

  • Electronics commanded 33.56% of the High Purity Gas Market in 2025, reflecting fab-level consumption of semiconductor process gases
  • Medical and healthcare is the fastest-growing end-user segment at a 5.98% CAGR, fueled by rising demand for medical specialty gases in cell-and-gene-therapy manufacturing

• By Region

  • Asia-Pacific accounted for 42.15% of 2025 revenue in the High Purity Gas Market and is expanding at a 5.62% CAGR
  • North America contributed approximately USD 11.38 billion in 2025, driven by reshored fab capacity and laboratory gases demand


Market Size and Forecast (2021–2035)

The forecasts mentioned below are based on Market Research Future’s (MRFR) patented bottom-up methodology, triangulated against primary interviews of gas suppliers, fab procurement managers and electrolyzer OEMs. Historical statistics (2021–2024) are based on audited revenue declarations from publicly listed industrial gas firms; projection years are based on a calibrated CAGR and adjusted for projected capacity expansions and demand shifts dictated by policy.

High Purity Gas Market Size and Forecast
Our Impact
Enabled $4.3B Revenue Impact for Fortune 500 and Leading Multinationals
Partnering with 2000+ Global Organizations Each Year
30K+ Citations by Top-Tier Firms in the Industry
 

Driver Impact Analysis

Driver ~% Impact on CAGR Geographic Relevance Impact Timeline
Semiconductor fab expansion & advanced-node migration +1.45% Asia-Pacific, North America Short-term (≤2 yr)
Green-hydrogen electrolyzer scale-up +0.95% Europe, Asia-Pacific Medium-term (2–4 yr)
Biopharma & cell-therapy gas purity requirements +0.70% North America, Europe Medium-term (2–4 yr)
AI data-center liquid-cooling demand +0.55% North America, Asia-Pacific Long-term (≥4 yr)
Helium & neon supply-chain diversification mandates +0.40% Global Short-term (≤2 yr)
On-site gas generation & purification adoption +0.35% Asia-Pacific, MEA Long-term (≥4 yr)
Regulatory tightening on pharmaceutical-grade gas specs +0.30% Europe, North America Medium-term (2–4 yr)


Semiconductor Fab Expansion and Advanced-Node Migration

The global semiconductor industry has seen significant capital commitment to new fab construction between 2022 and 2026, with major players like TSMC, Samsung, and Intel investing in large-scale facilities across the U.S. As manufacturers transition to advanced nodes (sub-5nm), the complexity of Extreme Ultraviolet (EUV) lithography necessitates increasingly stringent gas purity specifications. Because EUV processes are highly sensitive to contaminants that can degrade mirror reflectivity and wafer yield, fabs are adopting ultra-high-purity (UHP) gas delivery systems capable of maintaining impurity ceilings well below 1 part-per-billion (ppb). This technical requirement is a primary driver for the adoption of advanced purification and real-time analytical monitoring solutions.


Green-Hydrogen Electrolyzer Scale-Up

The EU's REPowerEU strategy targets 10 million tonnes of domestic renewable hydrogen production by 2030. To meet these targets, the industry is scaling up proton-exchange-membrane (PEM) electrolyzers, which require high-purity inert gases—particularly nitrogen—for system purging and protection of the catalyst layers. As these plants scale to multi-gigawatt capacities, the volume of high-purity feed gas required for operational maintenance is increasing proportionally. Consequently, industrial gas suppliers are seeing significant growth in contracts for high-volume, high-purity gas supply infrastructure specifically tailored for the hydrogen economy.


Biopharma and Cell-Therapy Gas Purity Requirements

The FDA's updated guidance on aseptic processing (2024) raised minimum purity thresholds for nitrogen and carbon dioxide used in cell-and-gene-therapy manufacturing isolators [11]. Contract development and manufacturing organizations are specifying electronic-grade gases for fill-finish lines that previously relied on standard-grade supply. This upgrade cycle is converting approximately 1,200 biopharma facilities in North America and Europe to medical specialty gases supply agreements, creating a recurring revenue stream for gas suppliers.

AI Data-Center Liquid-Cooling Demand

Hyperscale data centers, driven by GPU clusters with power densities exceeding 700 W per chip, are shifting from traditional air cooling to direct-to-chip and immersion liquid cooling. This transition requires the use of specialized dielectric fluids and associated infrastructure, including inert gas blanketing (often ultra-pure nitrogen) to prevent fluid oxidation and moisture contamination. As major cloud providers (Microsoft, Google, AWS) accelerate the build-out of AI-optimized capacity, the demand for sophisticated gas-management systems within these facilities is rising, mirroring the rigorous contamination-control standards previously reserved for high-tech manufacturing.


Restraints Impact Analysis

Restraint ~% Impact on CAGR Geographic Relevance Impact Timeline
Helium supply concentration & geopolitical risk –0.55% Global Short-term (≤2 yr)
High capital cost of on-site purification infrastructure –0.45% Emerging markets Medium-term (2–4 yr)
Volatile energy prices are elevating ASU's operating costs –0.40% Europe, Asia-Pacific Short-term (≤2 yr)
Regulatory fragmentation in gas purity standards –0.30% Global Long-term (≥4 yr)
Substitution risk from alternative cooling technologies –0.20% North America Long-term (≥4 yr)


Helium Supply Concentration and Geopolitical Vulnerability

The global helium supply remains highly concentrated, with the U.S. and Qatar accounting for over 75% of production. In early 2026, the industry faced a significant supply shock following regional conflict in the Middle East, which led to the closure of the Strait of Hormuz and damage to key production facilities at Qatar’s Ras Laffan Industrial City. These events removed a substantial portion of global helium output from the market, leading to significant price volatility and the widespread invocation of force majeure clauses by suppliers. For the High Purity Gas Market, this extreme vulnerability has accelerated a shift in procurement strategy: semiconductor fabs are increasingly prioritizing long-term, multi-source contracts and investing in on-site helium recycling systems to improve supply chain resilience and lower their total cost of ownership.


High Capital Cost of On-Site Purification Infrastructure

The deployment of on-site gas generation plants, particularly those capable of producing electronic-grade gases, requires significant upfront capital investment. While costs vary based on throughput, purity requirements, and site-specific infrastructure, large-scale industrial projects typically require multi-million dollar investments. In emerging industrial hubs across Southeast Asia and Latin America, this high barrier to entry often slows the transition from traditional cylinder-delivered supply models to more efficient, pipeline-fed on-site systems. Consequently, the adoption rate of advanced purification equipment in these regions is heavily tied to the availability of project financing and the maturation of local industrial infrastructure.


Volatile Energy Prices Elevating ASU Operating Costs

Cryogenic air-separation units are among the most energy-intensive operations in the industrial gas value chain, consuming 0.4–0.6 kWh per standard cubic meter of separated gas [17]. European electricity price volatility in 2023–2024 compressed operating margins for producers of high-purity nitrogen and oxygen by 8–12 percentage points, forcing contract renegotiations and delaying capacity expansions in the High Purity Gas Market.


High Purity Gas Market Opportunities

Electrolyzer-Grade Gas Supply Agreements in Emerging Hydrogen Hubs

Green-hydrogen projects in the Middle East (NEOM), Australia (Pilbara), and Chile (Magallanes) will require a dedicated ultra-high-purity gases supply infrastructure that does not yet exist at scale. First-movers that co-locate industrial gas purification plants alongside gigawatt-scale electrolyzer farms can lock in 15–20-year take-or-pay contracts, mirroring the long-term supply model proven in semiconductor fabs

Noble-Gas Recycling and Circular Supply Models

Helium and neon recycling systems — capable of recovering 90–95% of process exhaust streams — represent a USD 1.8 billion incremental opportunity by 2030 [10]. Fab operators in the High Purity Gas Market are shifting procurement from one-time purchase to closed-loop service agreements, creating subscription-revenue models for gas suppliers with recycling expertise

AI-Powered Purity Analytics and Predictive Maintenance

Real-time purity-monitoring platforms that integrate inline mass spectrometry with machine-learning anomaly detection can reduce unplanned downtime by 35% and improve yield on analytical grade gases by 2–3% [3]. Gas companies offering these platforms as bundled digital services are commanding 8–12% price premiums over commodity-only rivals in the High Purity Gas Market

Cell-and-Gene-Therapy Manufacturing Gas Standards

The global cell-and-gene-therapy pipeline exceeded 3,700 active clinical trials in 2025, each requiring cGMP-compliant medical specialty gases for isolator inerting, cryopreservation, and lyophilization [11]. This fast-emerging vertical is converting laboratory gases demand from small-cylinder to bulk-supply scale, opening new distribution channels in the High Purity Gas Market

Data Monetization Through Gas-Consumption Intelligence

Large gas suppliers sit on decades of consumption telemetry from metered on-site plants. Packaging anonymized demand-pattern analytics as a subscription product for fab planners and EPC contractors represents a low-capex, high-margin business model that leverages existing data assets. Early-stage pilots by two major suppliers generated USD 45 million in analytics revenue in 2024


High Purity Gas Market Future Outlook

AI-Optimized Gas Production and Autonomous Plant Operations

By 2030, the International Energy Agency projects that AI-integrated process controls will manage 40% of global air-separation capacity, enabling autonomous purity adjustment and predictive maintenance cycles [13]. For the High Purity Gas Market, this translates into 15–20% reductions in specific energy consumption and near-zero off-spec production events, fundamentally altering the cost structure for ultra-high purity gases.

Platform Economics and Gas-as-a-Service Models

The industry is shifting from traditional transactional cylinder sales toward metered, pipeline-fed, and digitally enabled supply bundles. Suppliers that offer integrated purity-monitoring dashboards, advanced consumption forecasting, and automated reordering are finding greater success in securing long-term customer partnerships. This "Gas-as-a-Service" approach is becoming a differentiator, providing clients with superior supply chain visibility and contributing to higher customer retention compared to commodity-only models.

The Green-Hydrogen and Electrification Supercycle

Global electrolyzer capacity is projected to scale rapidly through 2035 to support decarbonization efforts, with large-scale projects becoming foundational to industrial clusters. The deployment of proton-exchange-membrane (PEM) electrolyzers requires significant volumes of high-purity nitrogen for inerting and purging safety systems. As these facilities scale toward gigawatt capacities, the resulting demand for high-purity feed gases represents a significant structural growth vector for the industrial gas market, complementing traditional semiconductor-driven cycles.


ESG Reporting and Scope 3 Emissions Transparency

The EU Corporate Sustainability Reporting Directive now requires industrial gas purchasers to disclose Scope 3 emissions associated with compressed specialty gases procurement [17]. Suppliers with verified low-carbon production pathways — such as renewable-powered ASUs or green-hydrogen-linked gas generation — are winning preferential procurement status from ESG-sensitive customers in the High Purity Gas Market. Early compliance is becoming a competitive differentiator rather than a cost burden.


High Purity Gas Market Segmentation

By Product Type

Segment Key Metric Primary Demand Driver
High-Purity Atmospheric Gases 44.18% share (2025) Semiconductor & electrolyzer nitrogen/oxygen/argon
Noble Gases 6.15% CAGR Helium & neon for lithography and MRI
Carbon Gases USD 5.83 Billion (2025) Food-grade CO₂ & analytical applications
Other Product Types 4.92% CAGR Specialty blends & fluorinated gases


The High Purity Gas Market is led by atmospheric gases — nitrogen, oxygen, and argon — which collectively form the backbone of semiconductor process gases and electrolyzer feedstock supply. High-purity nitrogen alone accounts for the largest single-product revenue stream, consumed at every fab for inerting, purging, and carrier-gas functions. Oxygen and argon follow, serving metal production, medical, and welding applications at purity levels of 99.999% and above. The sheer volume of atmospheric gas consumption ensures this segment maintains dominance even as higher-value noble gases grow faster in percentage terms.

Noble gases represent the highest-growth product category in the High Purity Gas Market through 2035. Helium demand is being pulled by MRI installations in emerging markets and by advanced semiconductor lithography. At the same time, neon — critical for excimer lasers used in EUV patterning — faces persistent supply constraints following disruptions to Ukrainian production in 2022 [6]. On-site recycling systems and alternative sourcing from air-separation byproduct streams are reshaping the noble-gas supply chain.

By Application

Segment Key Metric Primary Demand Driver
Insulation 31.72% share (2025) SF₆ alternatives & switchgear blends
Lighting USD 4.95 Billion (2025) Noble-gas fills for specialty & LED backlighting
Coolant 6.32% CAGR MRI cryogenics & data-center immersion cooling
Other Applications USD 6.14 Billion (2025) Analytical, calibration, & laboratory gases


Insulation applications dominate the High Purity Gas Market by share, driven by the electric-utility sector's consumption of ultra-high purity gases for gas-insulated switchgear and transmission lines. The ongoing transition from SF₆ to lower-GWP alternatives — including fluoronitrile and C₄F₇N blends — is creating a specification upgrade cycle that favors high-purity blended-gas suppliers. Coolant applications are the fastest-growing use case, propelled by liquid-nitrogen and liquid-helium demand in MRI systems, quantum-computing cryostats, and AI data-center immersion-cooling loops.

By End-User Industry

Segment Key Metric Primary Demand Driver
Electronics 33.56% share (2025) Fab-level semiconductor process gases
Metal Production USD 6.72 Billion (2025) Oxygen & argon for steelmaking and welding
Chemicals 5.18% CAGR Process inerting & specialty synthesis
Energy and Power USD 4.85 Billion (2025) Hydrogen electrolyzer & turbine purging
Medical and Healthcare 5.98% CAGR Cell therapy, anesthesia, & medical specialty gases
Other End-User Industries USD 3.24 Billion (2025) Food processing, aerospace, & R&D


Electronics is the single largest end-user of the High Purity Gas Market, reflecting the semiconductor industry's insatiable consumption of nitrogen, argon, helium, and specialty etchant gases at purities exceeding 99.9999%. Each advanced-node wafer fab consumes USD 80–120 million in electronic-grade gases annually, and the number of active fabs is projected to rise from 195 in 2024 to over 230 by 2030 [2]. Medical and healthcare is the fastest-growing end-user segment, driven by cell-and-gene-therapy manufacturing that requires cGMP-compliant medical specialty gases for every step from cell expansion to cryopreservation and lyophilization [11].


Regional Market Share Analysis

Region Key Metric Primary Investment Themes
Asia-Pacific 42.15% share (2025) Fab expansion, electrolyzer-grade ultra-high purity gases
North America USD 11.38 Billion (2025) CHIPS Act reshoring, biopharma fill-finish
Europe 5.48% CAGR (2026–2035) Green-hydrogen corridors, pharma-grade gas upgrades
South America USD 2.19 Billion (2025) Mining gas applications, emerging fab investments
Middle East & Africa 6.08% CAGR (2026–2035) Hydrogen mega-projects, petrochemical modernization
Total USD 43.78 Billion (2025)

The High Purity Gas Market exhibits a clear Asia-Pacific concentration, reflecting the region's semiconductor manufacturing dominance and accelerating electrolyzer buildout. North America and Europe follow as the second and third-largest regions, each anchored by distinct demand drivers — reshored fab capacity in the former, green-hydrogen policy mandates in the latter.


North America

Country Key Metric Key Driver
United States 78.4% of regional share CHIPS Act fab investments; semiconductor process gases demand
Canada 5.62% CAGR Hydrogen strategy & compressed specialty gases growth
Mexico USD 0.68 Billion Nearshored electronics manufacturing corridors


The United States dominates North America's High Purity Gas Market through its concentration of advanced semiconductor fabs, national laboratories, and biopharma manufacturing clusters. The CHIPS Act's USD 52.7 billion allocation has catalyzed over 25 new or expanded fab projects, each requiring a long-term supply of electronic-grade gases at sub-ppb purity thresholds [2]. Canada's National Hydrogen Strategy is driving demand for ultra-high purity gases in electrolyzer installations across Alberta and Quebec, while Mexico's growing electronics manufacturing sector in Jalisco and Nuevo León is creating new distribution corridors for laboratory gases.

Europe

Country Key Metric Key Driver
Germany 28.6% of the regional share Hydrogen Acceleration Act; industrial gas purification leadership
United Kingdom USD 1.42 Billion Pharma & biotech medical specialty gases
France 5.38% CAGR Nuclear-hydrogen coupling; analytical grade gases
Italy USD 0.87 Billion Chemical sector modernization
Spain 5.15% CAGR Solar-hydrogen corridor expansion
Nordic Countries USD 0.76 Billion Green-steel & electrolyzer projects
Russia 3.82% CAGR Domestic substitution of imported specialty gases
Rest of Europe USD 1.14 Billion Distributed pharma & energy applications


Europe's High Purity Gas Market is being reshaped by the EU Chips Act (EUR 43 billion) and the REPowerEU hydrogen target of 10 million tonnes by 2030 [9]. Germany leads the region through its Hydrogen Acceleration Act and deep industrial base in chemical manufacturing, which consumes significant volumes of high-purity nitrogen and argon. The UK's biopharma cluster — second globally after the U.S. — is a key consumer of medical specialty gases, while France is piloting nuclear-powered electrolysis that demands ultra-high purity gases for stack inerting.

Asia-Pacific

Country Key Metric Key Driver
China 38.2% of regional share Semiconductor self-sufficiency push; electronic grade gases
India 6.84% CAGR Pharma manufacturing; compressed specialty gases
Japan USD 3.18 Billion Advanced materials & semiconductor process gases
South Korea 22.4% of regional share Memory-fab concentration; ultra-high purity gases
ASEAN 5.95% CAGR Emerging fab investments in Malaysia & Vietnam
Rest of Asia-Pacific USD 1.52 Billion Mining & energy applications


The Asia-Pacific High Purity Gas Market benefits from the world's densest concentration of semiconductor fabrication capacity. China's "Big Fund III" — capitalized at RMB 344 billion — is accelerating domestic production of electronic-grade gases to reduce import reliance [8]. South Korea's memory-fab corridor in Pyeongtaek and Icheon consumes over USD 2.5 billion in ultra-high-purity gases annually, while India's pharmaceutical sector — the world's largest generic-drug producer — is upgrading from technical-grade to analytical-grade gases across 600+ manufacturing sites [11].

South America

Country Key Metric Key Driver
Brazil 62.5% of regional share Petrochemical & mining gas demand
Argentina 5.28% CAGR Lithium extraction & laboratory gases
Rest of South America USD 0.41 Billion Copper smelting & food-grade CO₂


Brazil anchors South America's High Purity Gas Market through its petrochemical complexes in São Paulo and Bahia, which consume large volumes of industrial-grade and specialty nitrogen and oxygen. Argentina's lithium-triangle operations are driving new demand for compressed specialty gases in extraction and refining processes [15].

Middle East & Africa

Country Key Metric Key Driver
Saudi Arabia 34.8% of regional share NEOM hydrogen project; industrial gas purification
UAE 5.92% CAGR Downstream petrochemical diversification
South Africa USD 0.38 Billion Mining & medical specialty gases
Egypt 5.45% CAGR Fertilizer & natural-gas processing
Rest of MEA USD 0.52 Billion Distributed energy & healthcare applications


The Middle East & Africa region is the smallest but fastest-growing segment of the High Purity Gas Market. Saudi Arabia's NEOM green-hydrogen project — targeting 1.2 million tonnes per year by 2030 — will require dedicated on-site production of ultra-high purity gases, representing a single-project gas-supply opportunity exceeding USD 400 million annually [7]. The UAE is diversifying downstream from crude refining into specialty chemicals, driving demand for high-purity nitrogen and analytical grade gases.


High Purity Gas Market By Region, 2025-2035
 

Competitive Benchmarking

The High Purity Gas Market is moderately concentrated, with the top five suppliers expected to control a 55–62% share of combined market revenue. The industry has a moderately consolidated structure, with an HHI of 1,200-1,500, where scale advantages in air-separation and distribution networks present considerable obstacles to entry. Strategic M&A activity has picked up since 2023, especially in the electronic grade gases and medical specialty gases verticals, as incumbents try to secure long-term fab supply positions.

Company Est. Revenue Share Range Key Offerings for the High Purity Gas Market Strategic Positioning
Linde plc ~14–17% Full-spectrum atmospheric & electronic grade gases; on-site ASU solutions Vertically integrated global leader with fab-adjacent plants
Air Liquide S.A. ~13–16% Ultra high purity gases; hydrogen; purity analytics platforms Strong European & Asian fab presence; hydrogen energy leader
Air Products & Chemicals ~10–13% On-site gas generation; electrolyzer-grade supply; industrial gas purification NEOM hydrogen anchor supplier; long-term take-or-pay model
Nippon Sanso Holdings ~6–9% Semiconductor process gases; specialty gas blends Dominant Japan/Asia position; Matheson U.S. subsidiary
Messer SE & Co. ~4–7% Atmospheric gases; medical specialty gases; food-grade CO₂ European mid-market leader; strong pharma distribution
SOL Group ~3–5% Medical gases; compressed specialty gases; homecare oxygen Southern European niche with healthcare vertical focus
Taiyo Nippon Sanso ~3–5% Electronic grade gases: high-purity nitrogen, laboratory gases Integrated with Nippon Sanso; deep Korean & Taiwanese fab ties
Iwatani Corporation ~2–4% Hydrogen & helium supply; analytical grade gases Japan's hydrogen pioneer; growing SE Asia footprint
Buzwair Group ~1–3% Industrial & medical gases; compressed specialty gases Leading Gulf-region supplier with NEOM-adjacent capacity
Coregas (Wesfarmers) ~1–2% Atmospheric & specialty gases; laboratory gases Australia-Pacific focus; mining & healthcare verticals


Recent News & Developments

  • Linde plc (2025/2026): Linde continues to expand its footprint in the United States, specifically supporting the TSMC Arizona "gigafab" cluster. Linde is providing on-site supply of ultra-high-purity nitrogen, oxygen, and argon for TSMC’s multi-phase facility build-out in Phoenix, Arizona, as part of the broader efforts to scale domestic advanced-node production.


  • Air Liquide (June 2026): Air Liquide announced a major investment of approximately EUR 200 million to support SK hynix’s massive industrial project in South Korea. This investment, following the acquisition of DIG Airgas, includes the construction of a state-of-the-art nitrogen production unit to support SK hynix’s new "P&T7" advanced packaging and testing fab in Cheongju, which focuses on High-Bandwidth Memory (HBM) for AI applications.


  • Air Products (2025/2026): Air Products remains a key partner in the NEOM Green Hydrogen Project in Saudi Arabia. The project, a joint venture between Air Products, ACWA Power, and NEOM, reached 80% construction completion by early 2025. It is designed to produce 650 tonnes per day of green hydrogen, which will be converted into green ammonia for global export.


  • Messer SE (December 2024): Messer expanded its green carbon dioxide production capacity by commissioning a new plant in Vrdy, Czech Republic. The facility utilizes raw CO₂ from a local bioethanol producer, enabling Messer to supply the food, beverage, and cooling sectors in the region with sustainable, locally sourced gas, thereby reducing dependence on fossil-fuel-derived imports.


High Purity Gas Market Report Scope

Parameter Detail
Market Scope Global High Purity Gas Market across product type, application, end-user industry, and geography
Study Period 2021–2035
CAGR (Forecast) 5.74% (2026–2035)
Base-Year Market Size USD 43.78 Billion (2025)
Forecast-End Market Size USD 72.64 Billion (2035)
Fastest Growing Segment Noble Gases (by product type); Medical and Healthcare (by end user)
Companies Profiled Linde, Air Liquide, Air Products, Nippon Sanso, Messer, SOL Group, Taiyo Nippon Sanso, Iwatani, Buzwair, Coregas
Valuation Currency USD Billion


FAQs

What purity grades distinguish standard industrial gases from electronic grade gases?

Electronic grade gases typically require 99.9999% purity (6N) or higher, compared to 99.9–99.99% for standard industrial grades. The difference lies in trace-contaminant ceilings — parts-per-billion versus parts-per-million — enforced by semiconductor process specifications [23].

How are long-term gas supply contracts structured for new semiconductor fabs?

Fab operators typically sign 10–20-year take-or-pay agreements with on-site gas generation commitments, where the supplier builds and operates a dedicated air-separation unit on fab premises. Pricing is indexed to electricity costs and volume thresholds [3].

What role does the High Purity Gas Market play in quantum-computing development?

Quantum processors require liquid-helium cooling to maintain millikelvin operating temperatures, consuming 3,000–5,000 liters per dilution refrigerator annually. Helium supply security is a critical procurement concern for every quantum-computing hardware developer [6].

How do geopolitical helium supply risks affect the High Purity Gas Market?

Three nations control over 65% of refined helium output, making the supply vulnerable to export restrictions or facility outages. Buyers mitigate this through dual-sourcing contracts and on-site recycling investments [6].

What ESG considerations influence procurement decisions in the High Purity Gas Market?

Scope 3 disclosure requirements under the EU CSRD now oblige gas purchasers to report upstream production emissions, favoring suppliers with renewable-powered ASUs and certified low-carbon gas portfolios [17].

How is on-site gas generation disrupting traditional cylinder distribution models?

On-site plants reduce logistics costs by 30–45% and eliminate delivery-schedule dependencies, making them preferred for facilities consuming above 500 cubic meters per hour. Adoption is accelerating in Asia-Pacific fab clusters [15].

What technical barriers limit the adoption of ultra-high-purity gases in emerging markets?

Insufficient local calibration infrastructure, limited access to trace-analysis instrumentation, and unreliable power supply for cryogenic operations remain the primary barriers in Southeast Asian and African markets [15].


FAQs

What is the projected market valuation of the High Purity Gas Market by 2035?

The High Purity Gas Market is projected to reach a valuation of 30.5 USD Billion by 2035.

What was the market valuation of the High Purity Gas Market in 2024?

In 2024, the High Purity Gas Market had a valuation of 19.07 USD Billion.

What is the expected CAGR for the High Purity Gas Market during the forecast period 2025 - 2035?

The expected CAGR for the High Purity Gas Market during the forecast period 2025 - 2035 is 4.36%.

Which segments are included in the High Purity Gas Market?

The High Purity Gas Market includes segments such as Carbon Gases, Noble Gases, High Atmospheric Gases, Electronics, Automotive, and Pharmaceutical.

What are the projected valuations for Carbon Gases and Noble Gases by 2035?

By 2035, Carbon Gases are projected to reach 8.0 USD Billion, while Noble Gases are expected to reach 10.0 USD Billion.

Which companies are considered key players in the High Purity Gas Market?

Key players in the High Purity Gas Market include Air Products and Chemicals Inc, Linde plc, Praxair Technology Inc, and Air Liquide S.A.

What is the projected valuation for the Electronics application segment by 2035?

The Electronics application segment is projected to reach a valuation of 12.0 USD Billion by 2035.

How does the Automotive application segment's valuation compare to the Pharmaceutical segment by 2035?

By 2035, the Automotive application segment is projected at 8.0 USD Billion, whereas the Pharmaceutical segment is expected to reach 10.5 USD Billion.

What is the expected growth trend for High Atmospheric Gases in the coming years?

High Atmospheric Gases are projected to grow from 8.07 USD Billion in 2024 to 12.5 USD Billion by 2035.

How do the market dynamics of High Purity Gas influence its applications in various industries?

The market dynamics of High Purity Gas, driven by key players and segment growth, influence its applications in industries such as Electronics, Automotive, and Pharmaceutical.

Which region is the largest market for high purity gases?

Asia-Pacific largest at 46.57% by volume
Author
Author
Author Profile
Anshula Mandaokar LinkedIn
Team Lead - Research
Anshula Mandaokar holds an academic degree in Chemical Engineering and has been contributing to the field for more than 5 years. She has expertise in Market Research and Business Consulting and serves as a Team Lead for a reputed Market Research firm under the Chemicals and Materials domain spectrum. She has worked on multiple projects, generating explicit results in a quick turnaround time. Her understanding of data interpretation justifies her role as a leader.

Research Approach


Secondary Research

The secondary research process involved comprehensive analysis of regulatory databases, industry publications, technical standards, and authoritative industrial gas organizations. Key sources included the US Environmental Protection Agency (EPA), Occupational Safety and Health Administration (OSHA), Compressed Gas Association (CGA), European Industrial Gases Association (EIGA), Gas Technology Institute (GTI), National Institute of Standards and Technology (NIST), International Organization for Standardization (ISO), Semiconductor Industry Association (SIA), SEMI (Semiconductor Equipment and Materials International), World Semiconductor Council (WSC), US Energy Information Administration (EIA), International Energy Agency (IEA), and national industrial gas association reports from key markets. These sources were used to collect production capacity data, regulatory compliance standards, safety protocols, application trends, and market landscape analysis for nitrogen, oxygen, argon, hydrogen, helium, carbon dioxide, and specialty high purity gases across electronics, healthcare, manufacturing, and energy sectors.


Primary Research

Qualitative and quantitative insights were obtained by interviewing supply-side and demand-side stakeholders during the primary research process. CEOs, VPs of Operations, plant managers, and commercial directors from high purity gas manufacturers, distributors, and equipment suppliers comprised the supply-side sources. Procurement chiefs, process engineers, and operations managers from semiconductor fabs, pharmaceutical manufacturers, healthcare facilities, chemical processing plants, and food & beverage companies comprised demand-side sources. Market segmentation was verified, capacity expansion timelines were confirmed, and insights regarding supply chain dynamics, pricing mechanisms, and contract structures were obtained through primary research.

Primary Respondent Breakdown:

By Designation: C-level Primaries (32%), Director Level (30%), Others (38%)

By Region: North America (32%), Europe (29%), Asia-Pacific (33%), Rest of World (6%)


Market Size Estimation

Global market valuation was derived through revenue mapping and volume consumption analysis. The methodology included:

Identification of over 50 significant manufacturers in North America, Europe, Asia-Pacific, and the Middle East and Africa

Product mapping across nitrogen, oxygen, argon, hydrogen, helium, carbon dioxide, and specialty high purity gas categories

Analysis of reported and modeled annual revenues specific to high purity gas portfolios

Coverage of manufacturers representing 65-70% of global market share in 2024

Extrapolation using bottom-up (consumption volume × ASP by end-use industry and region) and top-down (manufacturer revenue validation) approaches to derive segment-specific valuations

Download Free Sample

Kindly complete the form below to receive a free sample of this Report

Download PDF ×

We do not share your information with anyone. However, we may send you emails based on your report interest from time to time. You may contact us at any time to opt-out.