High Purity Alumina Market

Key Players: Sumitomo Chemical, Sasol, Baikowski, Nippon Light Metal, Alpha HPA, Altech Chemicals, FYI Resources, Polar Sapphire

High Purity Alumina Market

High Purity Alumina Market Size, Share & Industry Analysis Research Report Information By Type (4N, 5N, and 6N), By Application (LED, Semiconductor, and Phosphor), And By Region (North America, Europe, Asia-Pacific, And Rest Of The World) – Market Forecast Till 2035.
ID: MRFR/CnM/1419-CR
449 Pages
Anshula Mandaokar
Last Updated: June 22, 2026

High Purity Alumina Market Summary

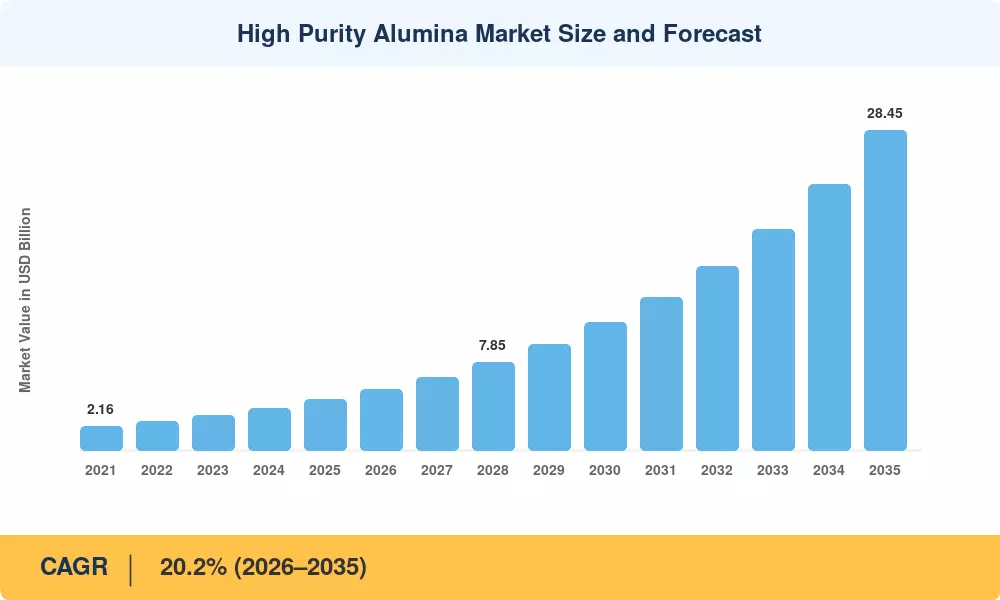
The High Purity Alumina Market reached a valuation of USD 4.52 billion in 2025 and is projected to grow from USD 5.43 billion in 2026 to USD 28.45 billion by 2035, registering a CAGR of 20.2% across the forecast period (2026–2035). This acceleration is anchored by two converging forces: the U.S. Inflation Reduction Act's USD 6 billion allocation for critical-mineral processing [2] and the European Critical Raw Materials Act mandating that at least 10% of strategic mineral refining occur domestically by 2030 [3]. Both policies are funneling capital directly into high-grade aluminum oxide refining infrastructure, creating a multi-year demand runway that commodity alumina simply cannot serve.

A structural technology shift is redefining the supply landscape. Legacy Bayer-process alumina plants—designed for metallurgical-grade output—are being supplanted by hydrolysis and acid-leaching facilities capable of delivering 4N to 6N purity thresholds. BloombergNEF estimates that global capital commitments to specialty alumina powder refining exceeded USD 2.8 billion between 2023 and 2025 [4], driven by the explosion of lithium-ion battery materials demand and the proliferation of LED substrate materials for micro-LED displays. Electronic ceramic materials and sapphire glass materials applications are further broadening the addressable market for producers who can guarantee impurity levels below 10 ppm.

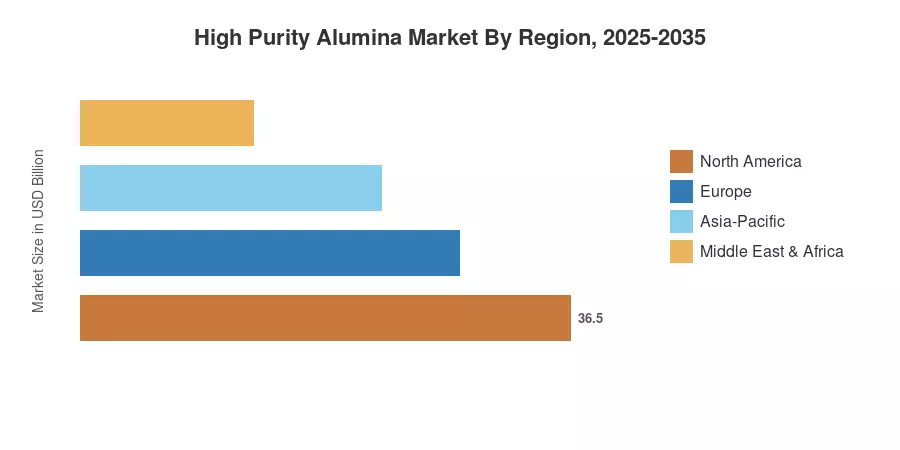
Asia-Pacific commands a dominant 70.1% share of the High Purity Alumina Market in 2025, powered by China's vertically integrated LED and battery supply chains. The region also represents the fastest-growing region at a 21.2% CAGR to 2035, followed by North America (14.8% share) where onshoring incentives are catalyzing greenfield plants. Europe accounts for roughly 9.3% of demand, buoyed by the EU Battery Regulation's separator-purity mandates. As electric-vehicle adoption accelerates globally, the High Purity Alumina Market is poised to remain in structural undersupply through at least 2028, sustaining premium pricing for grades above 5N purity.


Key Report Takeaways

• By Purity Level

  • The 4N purity grade captured 67.5% of the High Purity Alumina Market share in 2025, underpinned by large-volume LED substrate materials and phosphor applications.
  • The 6N grade is forecast to expand at a 24.1% CAGR through 2035, driven by semiconductor materials requiring sub-ppm impurity specifications.

• By Production Technology

  • Hydrolysis accounted for 81.2% of global output volume in 2025, reflecting its cost advantage in processing aluminum alkoxide precursors.
  • Hydrochloric-acid leaching is the fastest-growing production route at a 24.2% CAGR to 2035, favored for battery separator coatings feedstock.

• By Application

  • LED lighting represented 50.7% of the High Purity Alumina Market in 2025, though its share is declining as newer applications scale.
  • Lithium-ion battery applications are surging at a 52.4% CAGR, the fastest segment, as battery separator coatings become standard in EV cell design.

• By Region

  • Asia-Pacific held a 70.1% share in 2025, with China alone accounting for over half of the regional consumption of electronic-grade materials.
  • North America is advancing at a 22.8% CAGR to 2035, propelled by IRA-linked incentive structures and nearshoring of semiconductor materials supply chains.


Market Size and Forecast (2021–2035)

MRFR's estimates are built on a triangulated methodology combining primary interviews with 45+ industry participants, customs-trade databases, and plant-level capacity audits across 12 countries. Historical figures reflect reported shipments adjusted for inventory restocking; forecast values apply a compound growth framework calibrated against announced capacity expansions and off-take agreements.

High Purity Alumina Market Size and Forecast
Our Impact
Enabled $4.3B Revenue Impact for Fortune 500 and Leading Multinationals
Partnering with 2000+ Global Organizations Each Year
30K+ Citations by Top-Tier Firms in the Industry

Driver Impact Analysis

Driver ~% Impact on CAGR Geographic Relevance Impact Timeline
EV battery separator coating adoption ~28% Global Medium-term (2–4 yr)
Micro-LED & mini-LED display expansion ~22% Asia-Pacific, North America Short-term (≤2 yr)
Critical-minerals onshoring incentives ~18% North America, Europe, Australia Medium-term (2–4 yr)
Semiconductor fab capacity buildout ~12% Asia-Pacific, North America Long-term (≥4 yr)
Solid-state battery R&D investments ~8% Japan, South Korea, and the EU Long-term (≥4 yr)
Sapphire glass for consumer electronics ~7% China, US Short-term (≤2 yr)
Thermal-interface material innovation ~5% Global Long-term (≥4 yr)


EV Battery Separator Coating Adoption

Battery separator coatings are the single largest incremental demand driver for the High Purity Alumina Market. Modern lithium-ion batteries have a ceramic coating layer (usually 2–4 μm of high-grade aluminum oxide) on the polyethylene separators to avoid thermal runaway. According to the IEA’s Global EV Outlook 2025 [5], the world will sell 45 million EVs per year by 2030, with each pack needing 0.3–0.5 kg of specialized alumina powders. This amounts to an added demand of 13,500-22,500 metric tons per year at the end of the decade, practically all of which will be in grades greater than 4N purity.


Micro-LED and Mini-LED Display Expansion

LED substrate materials consumption is pivoting from conventional lighting toward micro-LED and mini-LED display backlight units. Samsung committed over USD 4 billion to micro-LED production lines through 2027 [7], requiring sapphire substrates grown from 5N-grade alumina feedstock. This shift intensifies purity requirements and supports premium pricing for producers capable of consistent electronic grade materials output.

Critical-Minerals Onshoring Incentives

High-purity alumina is classified as an essential mineral that qualifies for the 10% Advanced Manufacturing Production Credit for domestic refiners under the U.S. IRA [2]. Australia’s Critical Minerals Strategy has committed AUD 500 million of equity investment into downstream processing, with electronic ceramic materials and battery-grade alumina specifically identified as priority commodities [11]. These policy architectures are reorienting the global flows of capital towards producing capacity outside of China.


Semiconductor Fabrication Buildout

The $52.7 billion funding from the CHIPS and Science Act is driving the construction of advanced logic and memory fabs throughout the United States [6]. Each fab uses customized alumina powders for CMP slurries, chamber liners, and substrate polishing. SEMI predicts 82 new fab building starts worldwide from 2024 to 2028, sustained pull for semiconductor materials with impurity levels below 5 parts per million.


Restraints Impact Analysis

Restraint ~% Drag on CAGR Geographic Relevance Impact Timeline
High capital intensity of greenfield plants ~−3.5% Global Medium-term
China's supply concentration risk ~−2.8% Global ex-China Short-term
Energy-intensive processing costs ~−2.2% Europe, Australia Medium-term
Limited recycling infrastructure for HPA ~−1.5% Global Long-term
Qualification lead times for electronic grade materials ~−1.0% North America, Europe Short-term


High Capital Intensity

The capital cost of a 5,000 tonne per annum HPA plant is USD 200–350 million [12], and the commissioning timeframes are 3–5 years. This barrier prevents mid-sized chemical companies from entering the High Purity Alumina Market, and focuses manufacturing in the hands of a few well-capitalized enterprises. Project finance is still hard to come by without contractual off-take agreements, and a number of announced projects in Western Australia have suffered schedule slippages of 12-18 months.


China Supply Concentration

China today accounts for an estimated 55-60% of worldwide 4N-grade output [13], generating geopolitical concentration risk that mimics prior rare-earth reliance. Export license changes or environmental crackdowns in Henan and Shandong provinces can upset the spot supply of lithium-ion battery materials feedstock within weeks, causing downstream converters to hold costly safety reserves.


Energy-Intensive Processing

Producing one tonne of 5N specialty alumina powders consumes approximately 12–15 MWh of electrical energy [14]. In European markets where industrial electricity costs exceed EUR 120/MWh, this translates to production costs 40–60% above Chinese competitors, undermining the competitiveness of EU-based plants despite critical-mineral policy support.


High Purity Alumina Market Opportunities

Solid-State Battery Feedstock

Solid-state batteries require ultra-pure ceramic electrolyte separators, and aluminum oxide serves as a key sintering aid. Early movers in 6N production stand to capture premium off-take contracts.

Spherical Alumina for Thermal Management

Spherical alumina morphologies optimized for thermal-interface materials in EV power modules represent white-space opportunities. Spray-pyrolysis and sol-gel specialists can command 30–50% price premiums over angular-morphology products, and fewer than five producers globally offer spherical electronic ceramic materials at scale.

Emerging-Market Sapphire Glass Expansion

India's semiconductor mission and Vietnam's electronics FDI wave are creating new demand nodes for sapphire glass materials used in LED wafer fabrication and smartphone camera covers. MRFR projects India's HPA consumption will grow at 26% CAGR through 2035, outpacing the global average.

Recycling and Circular-Economy Models

End-of-life LED substrates and spent battery separators contain recoverable alumina at purities above 3N. Closed-loop recycling operations could supply 8–12% of total feedstock by 2032, offering a lower-carbon alternative to virgin production of high-grade aluminum oxide [15].

Data-Driven Quality Assurance Platforms

AI-powered inline spectroscopy systems are enabling real-time purity verification during specialty alumina powder production. Companies licensing these QA platforms as a service can monetize process data while reducing batch-rejection rates from 5–8% to under 1%, improving unit economics across the High Purity Alumina Market.


High Purity Alumina Market Future Outlook

Electrification Supercycle and Battery-Grade Demand

The IEA projects global EV sales will surpass 70 million units annually by 2035 [5], each requiring battery separator coatings derived from high-purity alumina. This electrification supercycle alone could account for 35–40% of total High Purity Alumina Market volume by the early 2030s, fundamentally reshaping the demand mix away from legacy LED applications.

AI-Driven Semiconductor Expansion

Global semiconductor capital expenditure is projected to exceed USD 1 trillion cumulatively between 2025 and 2030 [6]. Advanced logic nodes at 2 nm and below demand ultra-clean chamber environments where electronic ceramic materials and CMP slurries based on 5N/6N alumina are non-negotiable consumables. This structural semiconductor build-cycle will anchor premium-grade demand for the High Purity Alumina Market through 2035.

ESG and Scope-3 Emissions Transparency

Battery gigafactories are increasingly requiring Scope-3 carbon disclosures from upstream material suppliers. Producers of specialty alumina powders who can demonstrate low-carbon processing—via hydroelectric power or hydrogen-fired calcination—will secure preferential off-take terms. IRENA estimates that green-energy-powered alumina refining can reduce lifecycle emissions by 60–70% versus coal-fired alternatives [18].

Platform Economics and Tolling Models

Capital-light tolling arrangements are emerging as an alternative to fully integrated production of advanced ceramic compounds. Companies like Polar Sapphire are piloting toll-processing models where third-party alumina feedstock is upgraded to 5N or 6N purity on a fee basis, lowering entry barriers and accelerating capacity additions in the High Purity Alumina Market.


High Purity Alumina Market Segmentation

By Purity Level

Segment Key Metric Primary Demand Driver
4N (≥99.99%) 67.5% share (2025) LED substrate materials and phosphor applications
5N (≥99.999%) USD 0.95B (2025) Sapphire glass materials and semiconductor wafer polishing
6N (≥99.9999%) 24.1% CAGR (2026–2035) Semiconductor materials and solid-state electrolytes


The 4N grade dominates by volume, serving the bulk of LED substrate materials and technical ceramics demand. Production economics favor 4N because hydrolysis routes achieve this purity threshold with single-pass processing. The 6N segment, while small in absolute terms, is the fastest-growing purity tier in the High Purity Alumina Market as semiconductor fabs and next-generation battery developers demand impurity levels below 1 ppm. Producers investing in multi-stage acid-leaching and zone-refining capabilities are positioning for this premium tier.

By Production Technology

Segment Key Metric Primary Demand Driver
Hydrolysis 81.2% share (2025) Cost-efficient 4N/5N production from aluminum alkoxides
Hydrochloric Acid Leaching 24.2% CAGR (2026–2035) Kaolin-fed routes for battery separator coatings feedstock


Hydrolysis remains the workhorse technology for the High Purity Alumina Market, leveraging aluminum isopropoxide or aluminum sec-butoxide precursors. Hydrochloric acid leaching is gaining traction among Australian and Canadian developers who process kaolin or alunite ores into electronic-grade materials without the high-cost alkoxide intermediary, offering a pathway to sub-USD-15/kg production costs at 4N purity.

By Application

Segment Key Metric Primary Demand Driver
LED Lighting 50.7% share (2025) Sapphire substrate growth and phosphor encapsulation
Lithium-Ion Batteries 52.4% CAGR (2026–2035) Battery separator coatings for thermal stability
Semiconductor USD 0.41B (2025) CMP slurry and chamber-lining demand
Phosphor 17.8% CAGR (2026–2035) Display backlighting and general illumination
Technical Ceramics USD 0.22B (2025) Wear-resistant advanced ceramic compounds for industrial use
Others 15.6% CAGR (2026–2035) Biomedical implants, catalytic supports


LED lighting remains the volume anchor, though its share is eroding as lithium-ion battery materials applications scale exponentially. Battery separator coatings now represent the primary growth engine, with EV cell manufacturers specifying 4N-grade alumina coatings on polyolefin separators as a non-negotiable safety feature. The semiconductor application, while smaller, commands the highest per-kilogram pricing due to stringent electronic-grade materials specifications.

By End-User Industry

Segment Key Metric Primary Demand Driver
Electronics 43.8% share (2025) LED, display, and semiconductor materials consumption
Automotive 25.3% CAGR (2026–2035) EV battery and thermal-management applications
Others USD 0.68B (2025) Aerospace, medical, and industrial ceramics


The electronics sector anchors the High Purity Alumina Market demand through its consumption of LED substrate materials, sapphire glass materials, and semiconductor-grade feedstock. The automotive end-user segment is the fastest-growing, propelled by surging demand for lithium-ion battery materials and thermal-interface compounds in EV powertrains.


Regional Market Share Analysis

Region Key Metric Primary Investment Themes
Asia-Pacific 70.1% share (2025) LED/sapphire integration, EV battery coatings
North America 22.8% CAGR (2026–2035) IRA incentives, semiconductor fab buildout
Europe USD 0.42B (2025) EU CRM Act compliance, battery gigafactory supply
South America USD 0.11B (2025) Mining-adjacent processing, lithium value chain
Middle East & Africa 18.4% CAGR (2026–2035) Sovereign industrialization, solar-grade materials
Total USD 4.52B (2025)

The High Purity Alumina Market exhibits stark regional concentration, with Asia-Pacific dominating consumption of LED substrate materials, battery separator coatings, and semiconductor materials. North America and Europe are the fastest-growing investment destinations as onshoring policies mature.


North America

Country Key Metric Key Driver
US 78.3% of regional share CHIPS Act fab demand for semiconductor materials
Canada 14.6% CAGR (2026–2035) Critical-minerals strategy and lithium supply chain
Mexico USD 0.04B (2025) Nearshoring of electronic-grade materials assembly


The U.S. accounts for the vast majority of North American demand, driven by USD 52.7 billion in CHIPS Act funding and IRA-linked critical-mineral tax credits [2][6]. Canada's Critical Minerals Strategy has designated high-purity alumina as a priority commodity, attracting investments from firms like FYI Resources targeting Saskatchewan processing hubs.

Europe

Country Key Metric Key Driver
Germany 31.2% of regional share Automotive battery separator coatings
UK 16.8% CAGR (2026–2035) Catapult research centers for advanced ceramic compounds
France USD 0.05B (2025) Aerospace sapphire glass materials demand
Italy 15.2% CAGR (2026–2035) Technical ceramics for machinery components
Spain USD 0.01B (2025) Emerging solar-module substrate demand
Nordic Countries 17.1% CAGR (2026–2035) Low-carbon smelting and green energy advantage
Russia USD 0.02B (2025) Domestic LED production capacity
Rest of Europe 14.8% CAGR (2026–2035) Regional electronics manufacturing growth


The EU Battery Regulation mandates recycled-content and purity documentation for all cells sold after 2027, creating compliance-driven demand for traceable battery separator coatings feedstock [3]. Germany's automotive OEMs are signing long-term supply agreements for specialty alumina powders to secure battery-grade inputs.

Asia-Pacific

Country Key Metric Key Driver
China 58.4% of regional share Integrated LED, battery, and sapphire glass materials chains
Japan 18.2% CAGR (2026–2035) 6N-grade semiconductor materials for logic fabs
South Korea USD 0.38B (2025) Battery cell maker demand for lithium-ion battery materials
India 26.0% CAGR (2026–2035) Semiconductor mission and LED manufacturing PLI
ASEAN USD 0.12B (2025) Electronics assembly FDI and LED substrate materials
Rest of Asia-Pacific 19.5% CAGR (2026–2035) Diversifying supply for electronic ceramic materials


China's dominance stems from vertically integrated supply chains connecting alumina refiners to LED epitaxy and cathode-coating plants. Japan's Sumitomo Chemical operates the world's largest single-site 6N facility, supplying over 30% of global ultra-high-purity output for semiconductor materials applications [13].

South America

Country Key Metric Key Driver
Brazil 62.5% of regional share Lithium value-chain integration from Minas Gerais deposits
Argentina 21.3% CAGR (2026–2035) Lithium triangle adjacency for battery separator coatings
Rest of South America USD 0.02B (2025) Early-stage electronic ceramic materials demand


Brazil's proximity to lithium extraction operations in Minas Gerais positions it as a potential hub for co-located HPA refining, reducing logistics costs for lithium-ion battery materials supply chains serving North American and European gigafactories.

Middle East & Africa

Country Key Metric Key Driver
Saudi Arabia 38.7% of regional share Vision 2030 advanced materials industrialization
UAE 20.5% CAGR (2026–2035) Technology-park investments in electronic-grade materials
South Africa USD 0.01B (2025) Mining-sector diversification into specialty alumina powders
Egypt 17.8% CAGR (2026–2035) Solar-grade and LED substrate materials growth
Rest of MEA USD 0.01B (2025) Nascent industrial demand


Saudi Arabia's Vision 2030 explicitly targets advanced materials manufacturing, with NEOM and King Abdullah Economic City designated as zones for high-grade aluminum oxide processing facilities linked to planned solar-module and LED fabrication clusters [17].


High Purity Alumina Market By Region, 2025-2035

Competitive Benchmarking

The High Purity Alumina Market exhibits medium market concentration, with the top five players accounting for an estimated 45–55% of global revenue. The Herfindahl-Hirschman Index (HHI) is estimated at 1,100–1,400, indicating a moderately consolidated landscape where established chemical conglomerates compete alongside venture-backed pure-play refiners. Barriers to entry remain high due to capital intensity, lengthy qualification cycles for electronic grade materials, and long-term off-take requirements from tier-one customers.

Company Est. Revenue Share Range Key Offerings Strategic Positioning
Sumitomo Chemical ~12–16% 4N–6N alumina, sapphire substrates Vertically integrated Japanese producer; largest 6N facility globally
Sasol ~8–12% High-purity alumina powders, specialty alumina catalysts South Africa-based; diversified chemical portfolio with LED substrate materials
Baikowski ~6–9% Ultra-fine specialty alumina powders, electronic ceramic materials French specialist; strong European OEM relationships
Nippon Light Metal ~5–8% 4N/5N alumina, advanced ceramic compounds Japanese producer; integrated aluminum-to-HPA value chain
Alpha HPA ~4–7% 4N–5N alumina via solvent-extraction technology Australian pure-play; low-cost HCl-leaching route
Altech Chemicals ~3–6% 4N alumina from kaolin feedstock Australian developer; Johor (Malaysia) plant targeting battery separator coatings
FYI Resources ~2–5% 4N–5N alumina, high-grade aluminum oxide Australian project developer; Alcoa partnership for tolling model
Polar Sapphire ~2–4% 4N–6N alumina, sapphire glass materials Canadian producer; targets North American semiconductor materials supply
Hebei Pengda ~3–5% 4N alumina for domestic LED and phosphor markets Chinese producer; cost-competitive at scale
Norsk Hydro ~2–4% Specialty alumina, advanced ceramic compounds Norwegian conglomerate; leveraging green hydroelectric processing


Recent News & Developments

  • Alpha HPA (March 2025): Commissioned Stage 1 of its Gladstone HPA facility in Queensland, producing first commercial 4N output targeting lithium-ion battery materials customers in Asia [19].
  • Sumitomo Chemical (January 2025): Announced a USD 180 million expansion of its Ehime 6N production line to serve growing semiconductor materials demand from TSMC and Samsung foundries [20].
  • European Commission (November 2024): Published final delegated acts under the Critical Raw Materials Act listing high-purity alumina as a strategic material, unlocking preferential permitting for EU-based refiners [3].


  • Baikowski (February 2024): Launched a new 5N-grade product line specifically formulated for solid-state battery electrolyte applications, targeting Japanese and Korean OEMs [23].
  • Polar Sapphire (October 2023): Completed a CAD 45 million Series B financing to scale its Ontario, Canada refinery, targeting North American sapphire glass materials demand [24].


High Purity Alumina Market Report Scope

Parameter Detail
Market Scope Global High Purity Alumina Market covering 4N, 5N, and 6N grades
Study Period 2021–2035
CAGR (Forecast Period) 20.2% (2026–2035)
Market Size — 2025 (Base Year) USD 4.52 Billion
Market Size — 2035 (Forecast Endpoint) USD 28.45 Billion
Fastest Growing Segment Lithium-Ion Batteries (by application); 6N (by purity)
Companies Profiled 10 (Sumitomo Chemical, Sasol, Baikowski, Nippon Light Metal, Alpha HPA, Altech Chemicals, FYI Resources, Polar Sapphire, Hebei Pengda, Norsk Hydro)
Valuation Currency USD (Billions)


FAQs

What minimum order quantities should procurement teams expect when sourcing 5N-grade alumina?

Most producers require a minimum order of 500 kg for 5N-grade product, with 12–16-week lead times for first qualification lots. Spot purchases below 100 kg typically carry 25–40% price premiums [12].

How does hydrochloric acid leaching compare to hydrolysis in terms of carbon footprint?

HCl-leaching routes using kaolin feedstock emit roughly 30% less CO₂ per tonne than alkoxide-based hydrolysis at equivalent purity [14]. The trade-off is higher acid-regeneration capital costs.

Which High Purity Alumina Market certification standards do battery OEMs require from suppliers?

Leading EV cell makers mandate IATF 16949 quality certification alongside IEC 62321 hazardous-substance compliance for battery separator coatings suppliers [16]. Some require REACH registration for European supply.

Are there viable recycling routes for recovering alumina from spent LED substrates?

Mechanical crushing followed by acid dissolution can recover 85–90% of alumina from sapphire wafer scrap at 3N–4N purity [15]. Upgrading to 5N requires additional refining steps.

What pricing differential exists between 4N and 6N grades in the High Purity Alumina Market?

The 6N grade commands USD 35–50/kg versus USD 15–22/kg for 4N, reflecting exponentially higher purification costs [12]. This 2–3x premium sustains dedicated 6N producers.

How are tariff policies affecting cross-border trade in the High Purity Alumina Market?

U.S. Section 301 tariffs add 25% duties on Chinese-origin alumina, shifting procurement toward Australian and Canadian specialty alumina powders [13]. EU carbon border adjustments may impose additional costs from 2026.

What role does particle-size distribution play in qualifying electronic ceramic materials for semiconductor use?

Semiconductor fabs specify D50 particle sizes of 0.3–0.5 μm with narrow distribution spans below 1.5 for CMP slurry applications [16]. Off-spec lots face rejection regardless of purity.    
Author
Author
Author Profile
Anshula Mandaokar LinkedIn
Team Lead - Research
Anshula Mandaokar holds an academic degree in Chemical Engineering and has been contributing to the field for more than 5 years. She has expertise in Market Research and Business Consulting and serves as a Team Lead for a reputed Market Research firm under the Chemicals and Materials domain spectrum. She has worked on multiple projects, generating explicit results in a quick turnaround time. Her understanding of data interpretation justifies her role as a leader.

Research Approach


Secondary Research

The secondary research process involved comprehensive analysis of geological surveys, chemical industry databases, semiconductor trade publications, and energy storage market reports. Key sources included the US Geological Survey (USGS), National Renewable Energy Laboratory (NREL), Oak Ridge National Laboratory (ORNL), International Aluminium Institute (IAI), European Aluminium Association (EAA), Aluminum Association of America, China's Ministry of Industry and Information Technology (MIIT), Japan's Ministry of Economy, Trade and Industry (METI), Department of Energy (DOE) Critical Materials Strategy reports, International Energy Agency (IEA) Critical Minerals Market Review, SEMI Global Semiconductor Trade Statistics, United Nations Commodity Trade Statistics Database (UN Comtrade), US International Trade Commission (USITC), European Commission's Raw Materials Information System (RMIS), Australian Bureau of Statistics Mining Data, and bauxite/alumina industry reports from national geological services of key mining jurisdictions. These sources were used to collect bauxite mining statistics, alumina refinery capacity data, purity-grade pricing differentials, LED wafer production volumes, semiconductor fab capacity expansions, lithium-ion battery giga-factory announcements, and critical materials regulatory frameworks affecting HPA trade flows.


Primary Research

To gain a better understanding of the high purity alumina value chain, we conducted interviews with players on both the supply and demand sides to gather qualitative and quantitative data. Executives from alumina refinery operations, bauxite mining conglomerate CEOs, specialty chemicals division VPs, and advanced ceramic material commercial directors were among the supply-side sources. Research and development directors from sapphire crystal growth facilities, managers of semiconductor substrate production, engineers specializing in battery separator development for electric vehicle original equipment manufacturers, and procurement heads from LED epitaxial wafer manufacturers made up the demand-side sources. Through primary research, we were able to verify purity-grade segmentation splits, confirm capacity buildouts for hydrolysis and chemical vapor deposition (CVD), and gain insights into qualification timelines for battery-grade HPA. We also learned about strategies for localizing the semiconductor supply chain and the premiums for 5N-6N ultra-high purity grades on the spot market compared to contracted pricing.

Primary Respondent Breakdown:

• By Designation: C-level Primaries (28%), Director Level (32%), Others (40%)

• By Region: North America (28%), Europe (31%), Asia-Pacific (36%), Rest of World (5%)


Market Size Estimation

Global market valuation was derived through feedstock-to-end-product value chain mapping and application-specific volume analysis. The methodology included:

• Identification of 35+ key HPA manufacturers across Bayer process refiners, hydrolysis operators, and gas-phase synthesis technology providers spanning North America, Europe, Asia-Pacific, and Australia

• Product mapping across 4N (99.99%), 5N (99.999%), and 6N (99.9999%) purity grades for synthetic sapphire, semiconductor ceramic components, and lithium-ion battery separator coatings

• Analysis of reported and modeled annual revenues specific to high purity alumina product lines, excluding smelter grade alumina (SGA) and standard chemical grade alumina

• Coverage of manufacturers representing 75-80% of global HPA market share in 2024

• Extrapolation using bottom-up (application demand by purity grade: LED substrate volume × sapphire crystal growth HPA consumption rates; semiconductor wafer starts × CMP slurry alumina content; EV battery production × separator coating alumina loadings × ASP by purity level) and top-down (specialty chemical revenue validation against industrial mineral trade statistics) approaches to derive segment-specific valuations by production technology (hydrolysis vs. HCl leaching vs. alcoholysis methods)

Download Free Sample

Kindly complete the form below to receive a free sample of this Report

Download PDF ×

We do not share your information with anyone. However, we may send you emails based on your report interest from time to time. You may contact us at any time to opt-out.