Hydrochloric Acid Market (2026 - 2035)

ID: MRFR/CnM/2096-HCR
111 Pages
Chitranshi Jaiswal
Last Updated: July 10, 2026
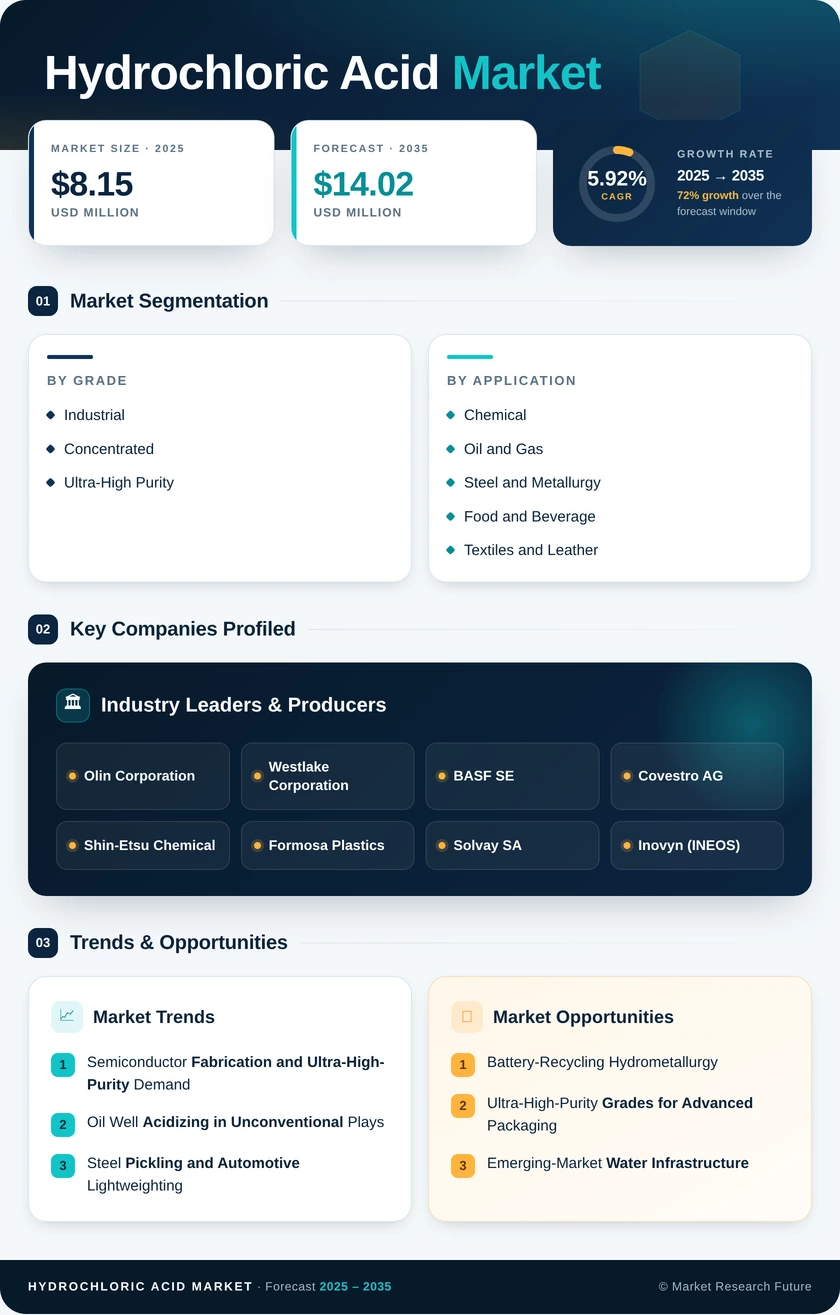
Hydrochloric Acid Market Research Report Information By Grade (Industrial, Concentrated, and Ultra-High Purity), By End-User Industry (Chemical, Oil and Gas, Steel and Metallurgy, Food and Beverage, Textiles and Leather, and Other End-User Industries), and By Region (North America, Europe, Asia-Pacific, and Rest Of The World) - Forecast Till 2035
Hydrochloric Acid Market
Market Size
Forecast Period2026-2035
CAGR (2026-2035)5.92%
2025 Market Size8.15 Million Tons
2035 Market Size14.02 Million Tons
Key Players
Olin Corporation
Westlake Corporation
BASF SE
Covestro AG
Shin-Etsu Chemical
Formosa Plastics
Opportunities
  • Battery-Recycling Hydrometallurgy
  • Ultra-High-Purity Grades for Advanced Packaging
  • Emerging-Market Water Infrastructure
  1. 1 Market Overview |
    1. 1.1 Study Assumptions & Market Definition |
    2. 1.2 Scope of the Study |
    3. 1.3 Research Methodology
  2. 2 Market Summary & Key Takeaways
  3. 3 Market Dynamics |
    1. 3.1 Market Drivers Analysis | |
      1. 3.1.1 Semiconductor Fabrication and Ultra-High-Purity Demand | |
      2. 3.1.2 Oil Well Acidizing in Unconventional Plays | |
      3. 3.1.3 Steel Pickling and Automotive Lightweighting | |
      4. 3.1.4 Water Treatment Regulatory Expansion | |
      5. 3.1.5 Battery-Recycling Hydrometallurgy Scale-Up | |
      6. 3.1.6 Food-Grade HCl for Gelatin and Fructose Processing | |
      7. 3.1.7 PVC and Chlorinated Chemical Products Demand Recovery |
    2. 3.2 Market Restraints Analysis | |
      1. 3.2.1 Caustic-Soda Demand Cyclicality and Co-Production Imbalance | |
      2. 3.2.2 Environmental and Transport Regulation Tightening | |
      3. 3.2.3 Energy Cost Volatility for Chlor-Alkali Electrolysis | |
      4. 3.2.4 Substitution by Organic Acids in Niche Cleaning Applications | |
      5. 3.2.5 Overcapacity in Chinese Chlor-Alkali Sector |
    3. 3.3 Market Opportunity Analysis | |
      1. 3.3.1 Battery-Recycling Hydrometallurgy | |
      2. 3.3.2 Ultra-High-Purity Grades for Advanced Packaging | |
      3. 3.3.3 Emerging-Market Water Infrastructure | |
      4. 3.3.4 Circular-Economy Acid Recovery and Regeneration | |
      5. 3.3.5 Geothermal Energy Acid Stimulation
  4. 4 Global Hydrochloric Acid Market Size & Forecast (2021–2035) |
    1. 4.1 Historical Market Size (2021–2025) |
    2. 4.2 Current & Forecast Market Size (2026–2035) |
    3. 4.3 Market Size by Volume (Million Tons) |
    4. 4.4 Year-over-Year Growth Analysis
  5. 5 Segmentation Analysis |
    1. 5.1 By Grade | |
      1. 5.1.1 Industrial | |
      2. 5.1.2 Concentrated | |
      3. 5.1.3 Ultra-High Purity |
    2. 5.2 By End-User Industry | |
      1. 5.2.1 Chemical | |
      2. 5.2.2 Oil and Gas | |
      3. 5.2.3 Steel and Metallurgy | |
      4. 5.2.4 Food and Beverage | |
      5. 5.2.5 Textiles and Leather | |
      6. 5.2.6 Other End-User Industries
  6. 6 Regional Analysis |
    1. 6.1 North America | |
      1. 6.1.1 United States | |
      2. 6.1.2 Canada | |
      3. 6.1.3 Mexico |
    2. 6.2 Europe | |
      1. 6.2.1 Germany | |
      2. 6.2.2 United Kingdom | |
      3. 6.2.3 France | |
      4. 6.2.4 Italy | |
      5. 6.2.5 Spain | |
      6. 6.2.6 Nordic Countries | |
      7. 6.2.7 Russia | |
      8. 6.2.8 Rest of Europe |
    3. 6.3 Asia-Pacific | |
      1. 6.3.1 China | |
      2. 6.3.2 India | |
      3. 6.3.3 Japan | |
      4. 6.3.4 South Korea | |
      5. 6.3.5 ASEAN | |
      6. 6.3.6 Rest of Asia-Pacific |
    4. 6.4 South America | |
      1. 6.4.1 Brazil | |
      2. 6.4.2 Argentina | |
      3. 6.4.3 Rest of South America |
    5. 6.5 Middle East & Africa | |
      1. 6.5.1 Saudi Arabia | |
      2. 6.5.2 UAE | |
      3. 6.5.3 South Africa | |
      4. 6.5.4 Egypt | |
      5. 6.5.5 Rest of MEA
  7. 7 Competitive Landscape |
    1. 7.1 Market Share Analysis (2025) |
    2. 7.2 Competitive Benchmarking Matrix |
    3. 7.3 Company Profiles | |
      1. 7.3.1 Olin Corporation | |
      2. 7.3.2 Westlake Corporation | |
      3. 7.3.3 BASF SE | |
      4. 7.3.4 Covestro AG | |
      5. 7.3.5 Shin-Etsu Chemical | |
      6. 7.3.6 Formosa Plastics | |
      7. 7.3.7 Solvay SA | |
      8. 7.3.8 Inovyn (INEOS) | |
      9. 7.3.9 Tata Chemicals | |
      10. 7.3.10 SABIC
  8. 8 Future Outlook & Strategic Recommendations (2026–2035) |
    1. 8.1 Digital Process Optimization and AI-Driven Quality Control |
    2. 8.2 Electrification and Green Hydrogen Synergies |
    3. 8.3 ESG Reporting and Circular-Economy Mandates |
    4. 8.4 Supply-Chain Regionalization and Nearshoring
  9. 9 Recent Developments & News
  10. 10 Frequently Asked Questions (FAQs)
  11. 11 Report Scope & Methodology |
    1. 11.1 Study Period & Base Year |
    2. 11.2 Data Sources & Citations |
    3. 11.3 Abbreviations ---
  12. 12 LIST OF TABLES |
  13. TABLE 1 Global Hydrochloric Acid Market Size & Forecast, by Volume (Million Tons), 2021–2035 |
  14. TABLE 2 Global Hydrochloric Acid Market – Year-over-Year Growth Analysis, 2021–2035 |
  15. TABLE 3 Market Driver Impact Analysis – Hydrochloric Acid Market, 2026–2035 |
  16. TABLE 4 Market Restraint Impact Analysis – Hydrochloric Acid Market, 2026–2035 |
  17. TABLE 5 Global Hydrochloric Acid Market Size, by Grade, 2021–2035 (Million Tons) |
  18. TABLE 6 Global Hydrochloric Acid Market Size, by End-User Industry, 2021–2035 (Million Tons) |
  19. TABLE 7 Global Hydrochloric Acid Market Size, by Region, 2021–2035 (Million Tons) |
  20. TABLE 8 North America Hydrochloric Acid Market Size, by Country, 2021–2035 (Million Tons) |
  21. TABLE 9 Europe Hydrochloric Acid Market Size, by Country, 2021–2035 (Million Tons) |
  22. TABLE 10 Asia-Pacific Hydrochloric Acid Market Size, by Country, 2021–2035 (Million Tons) |
  23. TABLE 11 South America Hydrochloric Acid Market Size, by Country, 2021–2035 (Million Tons) |
  24. TABLE 12 Middle East & Africa Hydrochloric Acid Market Size, by Country, 2021–2035 (Million Tons) |
  25. TABLE 13 Competitive Benchmarking Matrix – Hydrochloric Acid Market, 2025 |
  26. TABLE 14 Company Profiles – Key Players, Hydrochloric Acid Market |
  27. TABLE 15 Recent Developments & Strategic Announcements, 2023–2025 |
  28. TABLE 16 Report Scope & Methodology Summary |
  29. TABLE 17 Detailed Sources and Citations |
  30. TABLE 18 North America Hydrochloric Acid Market Size, by Grade, 2021–2035 (Million Tons) |
  31. TABLE 19 North America Hydrochloric Acid Market Size, by End-User Industry, 2021–2035 (Million Tons) |
  32. TABLE 20 Europe Hydrochloric Acid Market Size, by Grade, 2021–2035 (Million Tons) |
  33. TABLE 21 Europe Hydrochloric Acid Market Size, by End-User Industry, 2021–2035 (Million Tons) |
  34. TABLE 22 Asia-Pacific Hydrochloric Acid Market Size, by Grade, 2021–2035 (Million Tons) |
  35. TABLE 23 Asia-Pacific Hydrochloric Acid Market Size, by End-User Industry, 2021–2035 (Million Tons) |
  36. TABLE 24 South America Hydrochloric Acid Market Size, by Grade, 2021–2035 (Million Tons) |
  37. TABLE 25 South America Hydrochloric Acid Market Size, by End-User Industry, 2021–2035 (Million Tons) |
  38. TABLE 26 Middle East & Africa Hydrochloric Acid Market Size, by Grade, 2021–2035 (Million Tons) |
  39. TABLE 27 Middle East & Africa Hydrochloric Acid Market Size, by End-User Industry, 2021–2035 (Million Tons) ---
  40. 13 LIST OF FIGURES |
  41. FIGURE 1 Hydrochloric Acid Market Dynamics – Drivers, Restraints & Opportunities |
  42. FIGURE 2 Value Chain Analysis – Hydrochloric Acid Market |
  43. FIGURE 3 Porter's Five Forces Analysis – Hydrochloric Acid Market |
  44. FIGURE 4 Global Hydrochloric Acid Market Size Trend & Forecast, 2021–2035 (Million Tons) |
  45. FIGURE 5 Hydrochloric Acid Market Share, by Grade, 2025 (%) |
  46. FIGURE 6 Hydrochloric Acid Market Share, by End-User Industry, 2025 (%) |
  47. FIGURE 7 Hydrochloric Acid Market Share, by Region, 2025 (%) |
  48. FIGURE 8 North America Hydrochloric Acid Market Size Trend, 2021–2035 |
  49. FIGURE 9 Europe Hydrochloric Acid Market Size Trend, 2021–2035 |
  50. FIGURE 10 Asia-Pacific Hydrochloric Acid Market Size Trend, 2021–2035 |
  51. FIGURE 11 South America Hydrochloric Acid Market Size Trend, 2021–2035 |
  52. FIGURE 12 Middle East & Africa Hydrochloric Acid Market Size Trend, 2021–2035 |
  53. FIGURE 13 Competitive Landscape – Hydrochloric Acid Market Revenue Share, 2025 (%) ---

Segmentation Quick Reference

DimensionSub-SegmentsDominant SegmentFastest Growing Segment
By GradeIndustrial, Concentrated, Ultra-High PurityIndustrialUltra-High Purity
By End-User IndustryChemical, Oil and Gas, Steel and Metallurgy, Food and Beverage, Textiles and Leather, Other End-User IndustriesChemicalOil and Gas
By GeographyAsia-Pacific, North America, Europe, South America, Middle East & AfricaAsia-PacificAsia-Pacific


  • --

Market Segmentation Overview

By Grade

Sub-SegmentKey Trend
IndustrialSteady bulk demand from steel pickling and municipal water treatment applications
ConcentratedGrowing use in oil well acidizing and chemical synthesis requiring higher active-acid content
Ultra-High PurityRapid expansion driven by sub-5 nm semiconductor fabs and battery-recycling hydrometallurgy


Industrial-grade HCl remains the volume backbone of global production, consumed across steel mills, water utilities, and general chemical manufacturing. Ultra-high-purity grades are capturing an increasing share of value as semiconductor fabrication advances to smaller nodes and as battery-recycling circuits adopt hydrometallurgical leaching processes that demand tightly controlled acid specifications.

By End-User Industry

Sub-SegmentKey Trend
ChemicalCore demand from VCM/PVC production and organic/inorganic synthesis
Oil and GasShale-gas and offshore carbonate acidizing driving above-average growth
Steel and MetallurgyAHSS adoption increasing pickling intensity per ton of finished product
Food and BeverageGelatin, fructose, and food-grade additive processing sustaining niche demand
Textiles and LeatherFiber carbonizing and chrome-tanning pH control maintaining stable volumes
Other End-User IndustriesWater treatment, resin regeneration, and laboratory-reagent applications expanding


The chemicals segment dominates on volume, anchored by VCM/PVC manufacturing concentrated in China and Southeast Asia. Oil and gas is the fastest-growing end-user category, with unconventional well completions in the Permian Basin and Middle Eastern enhanced-recovery programs driving sustained consumption growth through the forecast period.

By Geography

Sub-SegmentKey Trend
Asia-PacificChlor-alkali co-production surplus; semiconductor and pharmaceutical demand acceleration
North AmericaShale-gas acidizing and CHIPS Act fab construction boosting consumption
EuropeAutomotive steel pickling and membrane-cell technology transition
South AmericaHydrochloric Acid Market hydrometallurgy and municipal water infrastructure investment
Middle East & AfricaPetrochemical integration and oil-field stimulation demand


Asia-Pacific's dominant position reflects China's massive chlor-alkali production base and the region's rapidly expanding semiconductor and pharmaceutical sectors. North America benefits from vertically integrated Gulf Coast chlor-alkali operations and the strongest shale-gas stimulation demand globally, while Europe's growth is shaped by the automotive steel value chain and circular-economy mandates driving spent-acid recovery adoption.


Download PDF ×

We do not share your information with anyone. However, we may send you emails based on your report interest from time to time. You may contact us at any time to opt-out.