Hydrogen Generator Market (2026 - 2035)

Hydrogen Generator Market Research Report By Technology (Steam Methane and Methanol Reforming, PEM Electrolysis, Alkaline Water Electrolysis, SOEC, AEM and Chemical Hydride), By Application / Sector (Chemical & Petrochemical, Petroleum Refining, Laboratory & Analytical, Electronics & Semiconductor, Food & Beverage, Metals & Glass, Power & Mobility Fueling), By Capacity Class (Small (1,000 Nm³/h)) and By Regional (North America, Europe, South America, Asia Pacific, Middle East and Africa) - Forecast to 2035
ID: MRFR/EnP/2399-HCR
188 Pages
Anshula Mandaokar
Last Updated: August 27, 2026
Hydrogen Generator Market
Market Size
Forecast Period2026-2035
CAGR (2026-2035)7.6%
2025 Market SizeUSD 2.14 Billion
2035 Market SizeUSD 4.45 Billion
Key Players
Air Liquide
Linde plc
Air Products
Nel ASA
thyssenkrupp nucera
Plug Power
Opportunities
  • Purification and Safety as a Margin Layer
  • Emerging-Market Distributed Fertilizer and Fuel
  • Service Contracts and Uptime Monetization

Hydrogen Generator Market Summary

The Hydrogen Generator Market reached USD 2.14 billion in 2025 and opens the forecast window at USD 2.30 billion in 2026, climbing to USD 4.45 billion by 2035 at a 7.6% CAGR. Two catalysts anchor that trajectory. The first is the U.S. Section 45V clean hydrogen production credit, whose final regulations landed in January 2025 and unlocked up to USD 3.00 per kilogram for qualifying producers [7]. The second is REPowerEU, which set a 10-million-tonne domestic renewable hydrogen production target for 2030 [8].

Equipment mixes are shifting faster than headline growth suggests. Packaged steam reformers and methanol crackers still carry the installed base, but buyers replacing them increasingly specify modular electrolysis skids that generate gas at the point of use. IRENA has documented electrolyzer system costs falling by roughly 40% over the past decade, with further declines expected as stack manufacturing scales [3]. That cost curve is what makes the Hydrogen Generator Market a replacement story rather than a purely additive one.

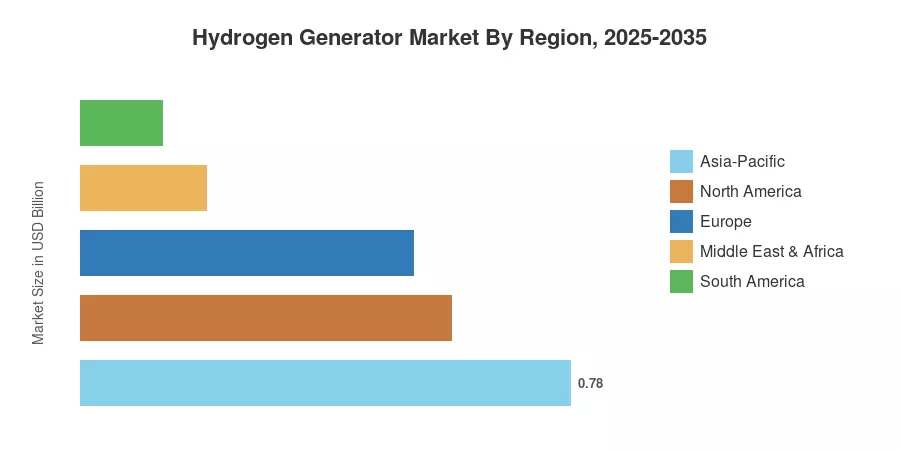
Regionally, Asia-Pacific holds 36.5% of 2025 revenue, powered by Chinese and Indian refining plus Korean and Taiwanese semiconductor fabs. Middle East & Africa grows fastest at a 9.2% CAGR off a small base. North America ranks second on the strength of laboratory replacement cycles and refinery hydrotreating demand. Through 2035, the Hydrogen Generator Market will reward vendors who pair generation hardware with purification, monitoring, and service contracts.


Key Report Takeaways

• By Technology

  • Steam and methanol reforming units retain 41.0% of 2025 revenue in the Hydrogen Generator Market, sustained by refinery and chemical duty cycles.
  • PEM electrolysis systems post a 9.8% CAGR through 2035, the fastest of any technology class.
  • Alkaline systems contribute roughly USD 0.51 billion in 2025 shipments.

• By Application/Sector

  • Chemical and petrochemical processing accounts for 29.0% of demand.
  • Laboratory and analytical instrumentation generates about USD 0.33 billion, the most cylinder-displacement-driven slice of the Hydrogen Generator Market.
  • Electronics and semiconductor applications expand at an 8.9% CAGR.

• By Region

  • Asia-Pacific commands 36.5% of global revenue.
  • Middle East & Africa records the fastest regional CAGR at 9.2%.
  • Europe contributes approximately USD 0.53 billion in 2025.


Market Size and Forecast (2021–2035)

Estimates blend bottom-up shipment tracking across roughly 40 equipment vendors with top-down validation against refinery hydrogen consumption, electrolyzer order books, and laboratory instrument installed-base data. Historical years reconcile to audited segment disclosures in supplier annual reports [17][18][19]; forecast years apply capacity-weighted pricing to announced project pipelines.
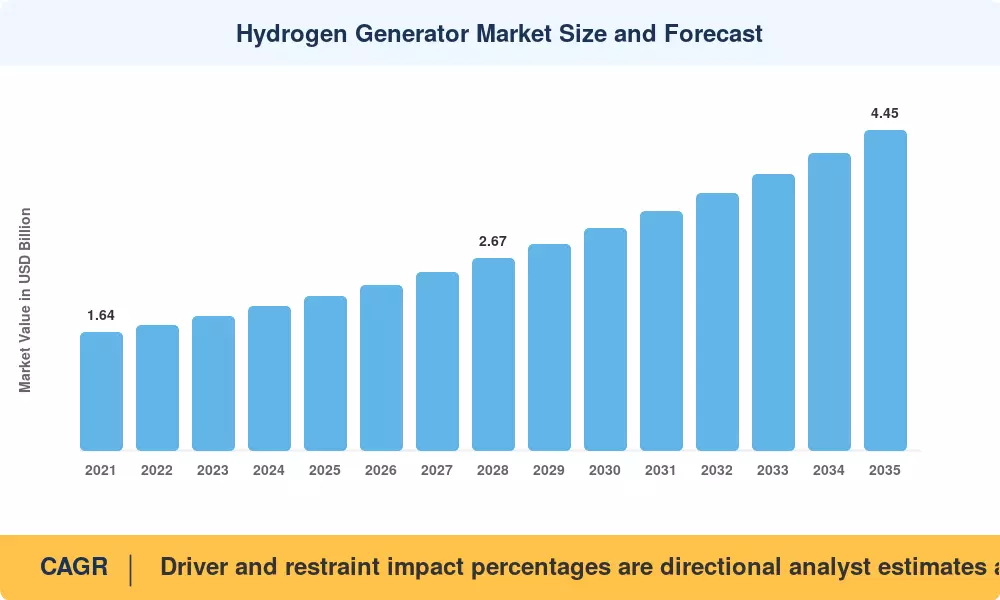
Hydrogen Generator Market Size and Forecast
Our Impact
Enabled $4.3B Revenue Impact for Fortune 500 and Leading Multinationals
Partnering with 2000+ Global Organizations Each Year
30K+ Citations by Top-Tier Firms in the Industry

Driver Impact Analysis

Driver ~% Impact on CAGR Geographic Relevance Impact Timeline
National hydrogen strategies and production credits +1.8 Global Long-term (≥4 yr)
On-site generation displacing delivered cylinder supply +1.5 North America, Europe Short-term (≤2 yr)
Refinery hydrotreating and desulfurization intensity +1.2 Asia-Pacific, MEA Medium-term (2–4 yr)
Electrolyzer capex decline and stack scale-up +1.1 Global Medium-term (2–4 yr)
Semiconductor and electronics fab buildout +0.9 Asia-Pacific, North America Medium-term (2–4 yr)
Laboratory safety codes limiting cylinder storage +0.7 North America, Europe Short-term (≤2 yr)
Fuel cell mobility refueling infrastructure +0.6 Asia-Pacific, Europe Long-term (≥4 yr)


Policy Credits Reset Project Economics

Washington’s final 45V regulations, issued in January 2025, link credit value to lifecycle carbon intensity, and allow for a tiered structure up to USD 3.00 per kilogram for paths below 0.45 kg CO₂e per kg H₂ [7]. Ten years ago, developers estimated ten-year paybacks for the electrolysis equipment in the Hydrogen Generator Market. Now, they're modeling five to seven. Europe countered with the Hydrogen Bank, which had its initial auction close at around EUR 720 million for seven projects with offers between EUR 0.37 and 0.48 per kilogram [9].


Cylinder Displacement Economics

Buyers of continuous analytical instruments can usually expect to break even against delivered cylinder gas within 14-22 months. Logistics surcharges, cylinder leasing and demurrage often dwarf the molecular cost itself, and BloombergNEF has detected delivered-gas premiums of 3x to 6x against on-site production for modest volume users [14]. Generation equipment is becoming more and more of an opex avoidance strategy rather than a capital project for the procurement teams.


Refining Demand Holds the Floor

Globally, refineries utilize tens of millions of tons of hydrogen per year for hydrotreating and hydrocracking, and tightened sulfur standards in India, Indonesia, and the Gulf mean that this intensity is continuing to grow [1][2]. Thus, captive reforming capacity remains an attractive target for capital, even as green paths gain ground. Refiners don't tear out reformers; they debottleneck and bolt on purification.


Restraints Impact Analysis

Restraint ~% Impact on CAGR Geographic Relevance Impact Timeline
Industrial power price volatility raising electrolysis opex −1.4 Europe, Asia-Pacific Medium-term (2–4 yr)
Natural gas and carbon cost exposure for reformers −1.1 Global Short-term (≤2 yr)
Capex intensity and long payback for small operators −0.9 South America, MEA Medium-term (2–4 yr)
Permitting, siting, and safety code complexity −0.7 North America, Europe Short-term (≤2 yr)
Iridium and platinum-group metal stack constraints −0.5 Global Long-term (≥4 yr)


Electricity Is the Whole Cost Stack

Power is responsible for 60-75% of the levelized production cost for water electrolysis (a EUR 30/MWh swing in industrial tariffs shifts the cost of delivered hydrogen by a couple of EUR 1.50/kg [3]). European customers experienced this the hard way during the 2022 energy crisis when a number of projects announced were delayed or canceled outright. Vendors have responded with load-following controllers and hybrid grid-plus-PPA architectures. Tariff exposure remains the single highest underwriting risk.


Payback Math Excludes Smaller Buyers

Financing prices over 12% effectively take small industrial users in emerging economies out of the addressable base. The World Bank’s analysis has pointed out that concessional funding and offtake guarantees are essential to deploying hydrogen equipment outside of OECD markets [23]. Without those mechanisms, adoption is concentrated among large refiners and state-backed developers.


Hydrogen Generator Market Opportunities

Purification and Safety as a Margin Layer

Downstream conditioning — pressure swing adsorption, deoxidizers, dryers, and leak detection — carries gross margins well above bare generation hardware. Vendors bundling certified purity guarantees into the Hydrogen Generator Market win stickier accounts, particularly in semiconductor and analytical applications where 99.9999% purity is contractual.

Emerging-Market Distributed Fertilizer and Fuel

India's National Green Hydrogen Mission allocated roughly INR 197 billion, including SIGHT tranches for domestic electrolyzer manufacturing [11]. Similar programs in Brazil, Chile, Morocco, and Namibia create demand for containerized units sized between 50 and 500 Nm³/h, well below utility scale but above laboratory scale.

Service Contracts and Uptime Monetization

Stack replacement, membrane servicing, and remote diagnostics convert one-time equipment sales into ten-year annuities. Leading suppliers now report attach rates above 50% on new industrial units, and outcome-based contracts priced per kilogram delivered are emerging as a distinct commercial model within the Hydrogen Generator Market.

Data Monetization Through Fleet Telemetry

Connected units stream electrolyzer degradation curves, purity drift, and energy intensity data. Aggregated across installed fleets, that telemetry supports predictive maintenance subscriptions and insurance-grade performance warranties — a business line that barely existed in 2021.

Backup Power and Microgrid Integration

Data centers and remote telecom sites pairing fuel cells with local generation create a niche where a portable hydrogen generator fuel cell package competes directly against diesel gensets on emissions compliance rather than cost alone.


Hydrogen Generator Market Future Outlook

Autonomous Operation and Predictive Control

Remote diagnostics move from optional to expected. By 2030, most industrial units in the Hydrogen Generator Market will ship with degradation modeling that schedules stack maintenance against production forecasts rather than fixed intervals, cutting unplanned downtime materially [16].

Modularity Beats Bespoke Engineering

Containerized, factory-tested skids compress delivery from 18 months to under 30 weeks. has been argued that manufacturing standardization, not stack chemistry, will determine which suppliers capture the next decade of orders [15].

The Electrification Supercycle

IEA reporting shows installed water electrolysis capacity climbing steeply from a low base, with announced project pipelines far exceeding operating capacity [1]. Even a partial conversion rate on that pipeline sustains double-digit equipment order growth in specific years.

Certification and Carbon Accounting

Buyers will demand kilogram-level carbon intensity attestation. Certification schemes emerging under RED III and the Hydrogen Council framework will make emissions documentation a purchasing criterion in the Hydrogen Generator Market rather than a reporting afterthought [10][16].


Hydrogen Generator Market Segmentation

By Technology

Segment Metric Primary Demand Driver
Steam methane and methanol reforming 41.0% share Refining and chemical duty cycles
PEM electrolysis 9.8% CAGR Dynamic load following, high purity
Alkaline water electrolysis USD 0.51 B Lowest capex per installed kilowatt
SOEC, AEM and chemical hydride 6.5% share Waste-heat integration, niche portability


Reforming holds the revenue crown because refiners value predictability over carbon intensity when uptime is contractual. Proton exchange systems win on ramp rate and purity, which is why they dominate new installations tied to variable renewable supply. The Hydrogen Generator Market therefore runs two clocks at once — a slow replacement clock for reformers and a fast adoption clock for electrolysis.

By Application / Sector

Segment Metric Primary Demand Driver
Chemical and petrochemical 29.0% share Ammonia and methanol synthesis
Petroleum refining USD 0.45 B Sulfur specification tightening
Laboratory and analytical 15.5% share Cylinder replacement and lab safety codes
Electronics and semiconductor 8.9% CAGR Fab commissioning and ultra-high purity
Food and beverage 7.1% CAGR Edible oil hydrogenation
Metals and glass 7.5% share Annealing and float-glass atmospheres
Power and mobility fueling 10.4% CAGR Fuel cell fleets and backup power


Chemicals anchor volume within the Hydrogen Generator Market, but semiconductors set the technical bar. Fabs specify purity, redundancy, and traceability that push equipment prices two to three times above industrial-grade equivalents, which lifts revenue disproportionately to consumption.

By Capacity Class

Segment Metric Primary Demand Driver
Small (<100 Nm³/h) 22.0% share Laboratory, pilot lines, remote power
Medium (100–1,000 Nm³/h) 8.3% CAGR Distributed industrial and fueling stations
Large (>1,000 Nm³/h) USD 0.94 B Refinery and chemical captive supply


Mid-range capacity is where competitive intensity concentrates in the Hydrogen Generator Market. Alkaline water electrolysis hydrogen generator platforms and packaged reformers meet in that band, and buyers weigh footprint against turndown ratio far more carefully than in either the laboratory or refinery tiers.


Regional Market Share Analysis

Region Metric (2025) Primary Investment Themes
North America 27.8% share 45V credits, laboratory replacement, refinery debottlenecking
Europe USD 0.53 B Hydrogen Bank auctions, RED III industry quotas
Asia-Pacific 36.5% share Refining, semiconductors, national manufacturing missions
South America 5.9% CAGR Renewable-rich export corridors, fertilizer
Middle East & Africa 9.2% CAGR Mega-project offtake, desalination-linked electrolysis
Total USD 2.14 B

Geographic performance in the Hydrogen Generator Market diverges sharply by policy regime rather than by industrial base alone.


North America

Country Metric Key Driver
United States 78% of region 45V production credit and hub funding
Canada USD 0.083 B Alberta and Quebec clean fuel regulations
Mexico 8.4% CAGR Refinery modernization at Dos Bocas and Tula


Seven regional clean hydrogen hubs selected under the U.S. Infrastructure Investment and Jobs Act carry up to USD 7 billion in federal cost share, and equipment procurement inside those hubs began in earnest during 2025 [5][6]. Laboratory buyers, meanwhile, drive steadier volume: campus safety offices across North America continue to restrict compressed-gas storage, pushing analytical labs toward on-demand generation in the Hydrogen Generator Market.

Europe

Country Metric Key Driver
Germany 26% of region H2Global auctions, steel decarbonization
France USD 0.079 B Normand'Hy and nuclear-powered electrolysis
United Kingdom 7.4% CAGR Hydrogen Allocation Round contracts
Netherlands 9% of region Port of Rotterdam import and cracking corridor
Rest of Europe USD 0.13 B Iberian and Nordic renewable surplus


Brussels raised the stakes with RED III, which requires 42% of industrial hydrogen consumption to come from renewable fuels of non-biological origin by 2030 [10]. Compliance pressure lands squarely on refiners and ammonia producers, who are procuring modular electrolysis capacity to hedge against import delays.

Asia-Pacific

Country Metric Key Driver
China 41% of region NDRC hydrogen industry plan, coal-to-chemicals
India 11.4% CAGR National Green Hydrogen Mission and SIGHT
Japan USD 0.101 B Revised Basic Hydrogen Strategy, CfD support
South Korea 9.8% of region Clean Hydrogen Portfolio Standard
Australia 10.6% CAGR Hydrogen Headstart production credits
Rest of Asia-Pacific USD 0.086 B Southeast Asian refining and electronics


China's Medium and Long-Term Plan for the Hydrogen Energy Industry set a 2025 target of 100,000 to 200,000 tonnes of annual renewable hydrogen output alongside domestic equipment localization [13]. Japan's revised strategy commits roughly JPY 15 trillion in public and private funding over 15 years [12]. Combined, those programs make Asia-Pacific the anchor of the Hydrogen Generator Market.

Middle East & Africa

Country Metric Key Driver
Saudi Arabia 33% of region NEOM and Vision 2030 industrial cities
United Arab Emirates 10.8% CAGR Masdar green hydrogen roadmap
South Africa USD 0.016 B Platinum Valley catalyst corridor
Rest of MEA USD 0.041 B Egyptian and Moroccan export projects


NEOM Green Hydrogen Company closed roughly USD 8.4 billion in financing in 2023 for a project designed around 2.2 GW of electrolysis [25]. Procurement of that scale reshapes regional supply chains and pulls balance-of-plant vendors into the Gulf.

South America

Country Metric Key Driver
Brazil 48% of region Pecém hub, fertilizer substitution
Chile 11.2% CAGR Magallanes wind-to-hydrogen corridor
Argentina USD 0.011 B Patagonia renewable pipeline
Rest of South America 6.1% CAGR Refining and metals processing


Brazilian legislation establishing a low-carbon hydrogen framework created tax incentives and certification rules that gave equipment buyers something they had lacked: bankable definitions [23]. Chilean projects benefit from capacity factors above 50%, which materially improves electrolyzer utilization economics.


Hydrogen Generator Market By Region, 2025-2035

Competitive Benchmarking

Concentration in the Hydrogen Generator Market sits in the moderately fragmented range, with an estimated HHI near 900 and a top-five revenue share around 44%. Industrial gas majors dominate large captive installations, pure-play electrolyzer firms lead mid-scale deployments, and specialist instrument makers own the laboratory tier almost entirely.

Company Est. Revenue Share Range Key Offerings for Hydrogen Generator Market Strategic Positioning
Air Liquide ~11–14% Packaged reformers, large electrolysis, purification Integrated molecule and equipment supplier
Linde plc ~9–12% HPU reformers, PEM plants, PSA units Engineering depth plus offtake balance sheet
Air Products ~7–10% Steam reforming trains, project-scale supply Mega-project developer with captive fleet
Nel ASA ~5–7% Alkaline and PEM stacks, fueling systems Pure-play scale manufacturing
thyssenkrupp nucera ~4–6% 20 MW alkaline modules Chlor-alkali heritage applied to hydrogen
Plug Power ~4–6% PEM electrolyzers, integrated fuel cell systems Vertically integrated ecosystem play
Cummins (Accelera) ~3–5% HyLYZER and HySTAT platforms Powertrain channel leverage
Peak Scientific ~2–4% Laboratory and analytical generators Instrument-attached distribution
Parker Hannifin ~2–3% Lab generators, filtration, purification Components-to-systems breadth
Teledyne Energy Systems ~1–3% Titan HMXT electrolysis units Defense and specialty reliability


Recent News & Developments

  • U.S. Treasury and IRS (January 2025): Published final Section 45V regulations establishing hourly matching, deliverability, and incrementality rules, resolving the largest financing uncertainty facing on-site electrolysis buyers [7].
  • European Commission (April–May 2024): Awarded roughly EUR 720 million across seven projects in the first European Hydrogen Bank auction, with winning bids well under EUR 0.50 per kilogram of subsidy [9].
  • NEOM Green Hydrogen Company (May 2023): Reached financial close on approximately USD 8.4 billion for a 2.2 GW electrolysis complex, one of the largest single equipment procurements on record [25].
  • thyssenkrupp nucera (July 2023): Completed its Frankfurt Stock Exchange listing, giving a dedicated electrolysis manufacturer independent access to capital markets [22].
  • Government of India, MNRE (2023–2024): Rolled out SIGHT scheme tranches allocating domestic electrolyzer manufacturing capacity and production incentives under the National Green Hydrogen Mission [11].
  • Plug Power (January 2024): Began production at its Georgia liquid hydrogen facility, validating integrated PEM deployment at commercial scale [21].
  • Air Liquide (2024): Advanced construction of the 200 MW Normand'Hy electrolyzer in France, targeting refinery and mobility offtake in Normandy [17].
  • Cummins Accelera (2023–2024): Expanded electrolyzer assembly capacity in Minnesota and Spain to serve North American and European order books [16].


Hydrogen Generator Market Report Scope

Parameter Detail
Market Scope Global on-site and packaged hydrogen generation equipment, including reformers, electrolyzers, purification and control systems
Study Period 2021–2035 (Historical 2021–2024; Base Year 2025; Forecast 2026–2035)
CAGR 7.6% (2026–2035)
Market Size Checkpoints USD 2.14 B (2025); USD 2.30 B (2026); USD 3.09 B (2030); USD 4.45 B (2035)
Fastest Growing Segments PEM electrolysis; power and mobility fueling; Middle East & Africa
Companies Profiled Air Liquide, Linde, Air Products, Nel ASA, thyssenkrupp nucera, Plug Power, Cummins Accelera, Peak Scientific, Parker Hannifin, Teledyne Energy Systems
Valuation Currency USD, constant 2025 prices
CAGR Driver Disclaimer Driver and restraint impact percentages are directional analyst estimates and are not additive to the headline CAGR of the Hydrogen Generator Market

FAQs

How should procurement teams structure warranty terms when buying into the Hydrogen Generator Market?
Tie warranties to guaranteed purity and availability hours rather than calendar years. Negotiate stack degradation caps expressed in millivolts per thousand hours, with remedies triggered before performance falls below specification [16].
What total cost of ownership inputs do buyers most often underestimate?
Deionized water treatment, cooling load, and nitrogen purge consumption. Together, these routinely add 8% to 12% to lifetime operating cost and rarely appear in vendor quotations [24].
Which technology suits facilities with intermittent renewable supply in the Hydrogen Generator Market?
Proton exchange membrane systems, because they ramp from idle to full load in seconds. Alkaline units tolerate turndown poorly and suffer efficiency penalties below roughly 20% of rated capacity [3].
What integration challenges arise when retrofitting generation into an existing plant?
Electrical service upgrades and hazardous-area classification dominate. Facilities often discover their switchgear cannot support the new load, adding six to nine months to project schedules [6].
How do insurers evaluate on-site installations in the Hydrogen Generator Market?
Underwriters focus on ventilation design, detector placement, and separation distances rather than technology type. Certified enclosures with third-party inspection typically secure materially better premiums [24].
Is leasing a viable alternative to outright purchase?
Yes. Hydrogen-as-a-service contracts price per kilogram delivered and shift equipment risk to the supplier, though effective financing costs usually exceed direct purchase over ten years [14].
Which emerging use case deserves the most attention through 2030?
Backup power for data centers. Rising grid interconnection queues and diesel restrictions are pushing operators toward fuel cell configurations that require local generation and storage [1].    
Author
Author
Author Profile
Anshula Mandaokar LinkedIn
Team Lead - Research
Anshula Mandaokar holds an academic degree in Chemical Engineering and has been contributing to the field for more than 5 years. She has expertise in Market Research and Business Consulting and serves as a Team Lead for a reputed Market Research firm under the Chemicals and Materials domain spectrum. She has worked on multiple projects, generating explicit results in a quick turnaround time. Her understanding of data interpretation justifies her role as a leader.

Research Approach


Secondary Research

The secondary research process involved comprehensive analysis of energy regulatory databases, peer-reviewed engineering journals, industrial gas publications, and authoritative clean energy organizations. Key sources included the US Department of Energy (DOE) Hydrogen Program, Energy Information Administration (EIA), International Energy Agency (IEA) Hydrogen Technology Collaboration Programme, International Renewable Energy Agency (IRENA), Hydrogen Council, Fuel Cell and Hydrogen Energy Association (FCHEA), European Clean Hydrogen Alliance, National Renewable Energy Laboratory (NREL), Lawrence Berkeley National Laboratory (LBNL), International Journal of Hydrogen Energy, Journal of Power Sources, EPA Alternative Fuels Center, OSHA Industrial Gas Safety Standards, EU Eurostat Energy Database, and national hydrogen roadmap reports from Japan (METI), Germany (BMWi), and South Korea (MOTIE). These sources were utilized to collect hydrogen production capacity statistics, electrolyzer installation data, regulatory policy frameworks, carbon emission reduction targets, and competitive landscape analysis for steam methane reforming, electrolysis, and emerging hydrogen generation technologies.


Primary Research

To gather both qualitative and quantitative insights, supply-side and demand-side stakeholders were interviewed during the primary research phase. CEOs, VPs of manufacturing, heads of research and development, and commercial directors from industrial gas firms, electrolyzer manufacturers, and hydrogen generator OEMs were examples of supply-side sources. Demand-side sources included sustainability officials, engineering procurement leads, and plant managers from oil and gas recovery sites, chemical processing plants, fuel cell power plants, and petroleum refineries. Primary study gathered information on capital expenditure trends, operational efficiency measures, and hydrogen offtake agreements in addition to validating technology adoption cycles and electrolyzer implementation schedules.

Primary Respondent Breakdown:

By Designation: C-level Primaries (38%), Director Level (32%), Others (30%)

By Region: North America (32%), Europe (30%), Asia-Pacific (28%), Rest of World (10%)


Market Size Estimation

Global market valuation was derived through revenue mapping and installed capacity analysis. The methodology included:

Identification of 40+ key manufacturers across North America, Europe, Asia-Pacific, and Middle East

Product mapping across on-site generation, portable systems, steam methane reforming, alkaline electrolysis, PEM electrolysis, and solid oxide electrolysis categories

Analysis of reported and modeled annual revenues specific to hydrogen generator portfolios and electrolyzer shipments

Coverage of manufacturers representing 75-80% of global installed capacity in 2024

Extrapolation using bottom-up (unit shipments × ASP by capacity rating and region) and top-down (manufacturer revenue validation against industrial gas consumption data) approaches to derive segment-specific valuations for chemical processing, refinery, fuel cell, and petroleum recovery applications

Download Free Sample

Kindly complete the form below to receive a free sample of this Report

* Please use a valid business email

Download PDF ×

We do not share your information with anyone. However, we may send you emails based on your report interest from time to time. You may contact us at any time to opt-out.
















