Segmentation Quick Reference
| Dimension | Sub-Segments | Dominant Segment | Fastest Growing Segment |
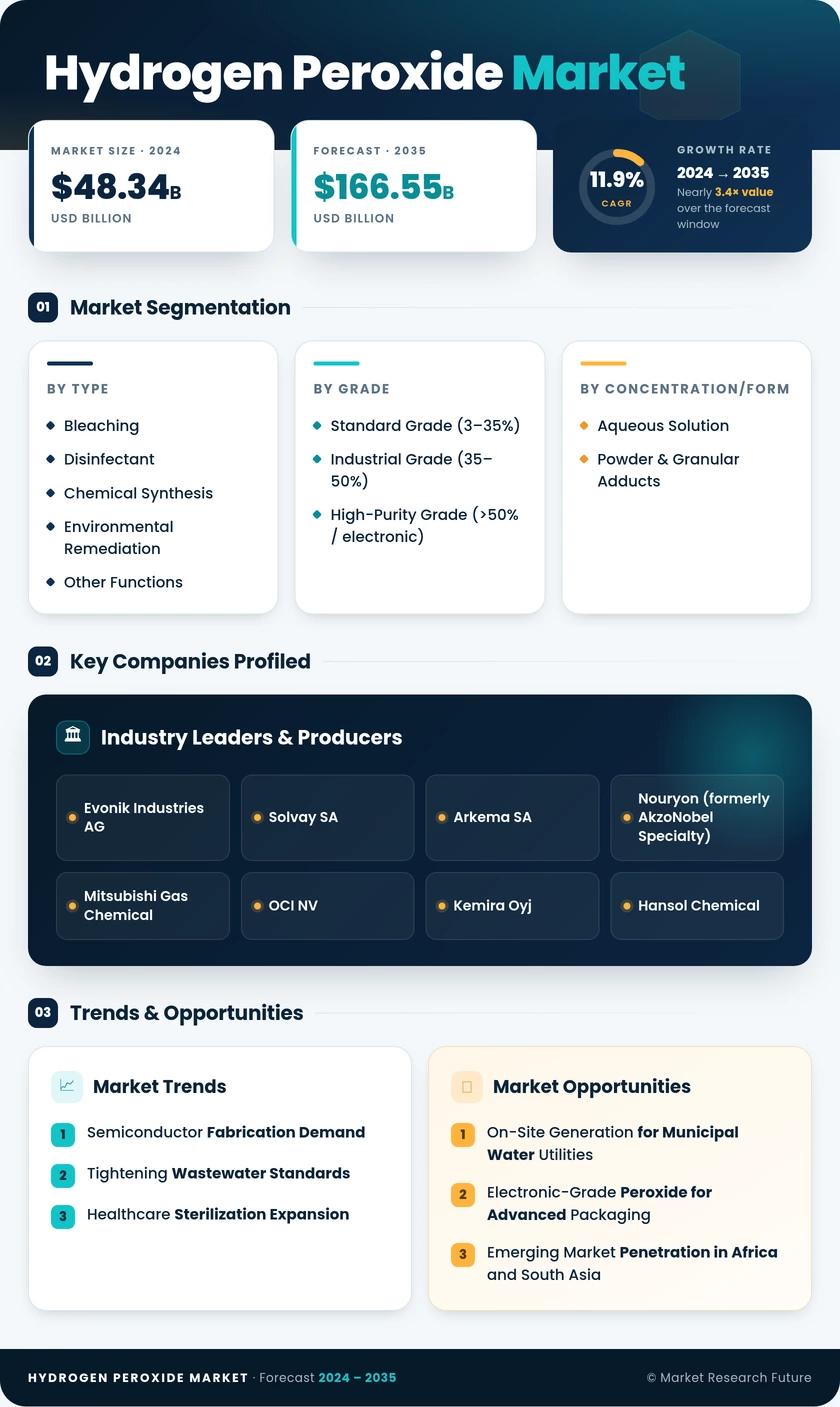
| Product Function | Bleaching, Disinfectant, Chemical Synthesis, Environmental Remediation, Other | Bleaching (66.1% share, 2025) | Environmental Remediation (4.92% CAGR) |
| Grade | Standard Grade (3–35%), Industrial Grade (35–50%), High-Purity Grade (>50% / Electronic) | Industrial Grade (45.2% share, 2025) | High-Purity Grade (5.74% CAGR) |
| Concentration/Form | Aqueous Solution, Powder & Granular Adducts | Aqueous Solution (85.5% share, 2025) | Powder & Granular Adducts (4.74% CAGR) |
| End-User Industry | Pulp & Paper, Chemical Synthesis, Wastewater Treatment, Hydrogen Peroxide Market, Textiles, Other | Pulp & Paper (52.1% share, 2025) | Wastewater Treatment (4.64% CAGR) |
| Geography | Asia-Pacific, North America, Europe, South America, the Middle East & Africa | Asia-Pacific (56.4% share, 2025) | Asia-Pacific (4.68% CAGR) |
Market Segmentation Overview
By Product Function
| Sub-Segment | Key Trend |
| Bleaching | Recycled-fiber adoption compresses dosage; still the volume leader in pulp and textile applications. |
| Disinfectant | VHP sterilization in hospitals and food-contact sanitation drives above-average growth |
| Chemical Synthesis | HPPO process for propylene oxide anchors stable, high-volume offtake |
| Environmental Remediation | Fenton-based PFAS destruction and soil cleanup are emerging as a high-growth niche. |
| Other Functions | Hydrogen Peroxide Market heap-leach and electronics cleaning provide diversified demand streams. |
Bleaching continues to account for the largest share of global hydrogen peroxide consumption, serving pulp mills and textile processors that rely on peroxide as a chlorine-free whitening agent. Disinfectant and remediation applications are growing fastest as regulatory mandates favor residue-free oxidation chemistry.
By Grade
| Sub-Segment | Key Trend |
| Standard Grade (3–35%) | Household, cosmetic, and general-purpose sanitation — mature, steady demand |
| Industrial Grade (35–50%) | Workhorse concentration for pulp bleaching, wastewater AOP, and chemical synthesis |
| High-Purity Grade (>50% / Electronic) | Semiconductor fabs drive premium pricing; only a handful of qualified global suppliers. |
Industrial grade remains the revenue backbone, serving the broadest range of end-use applications. High-purity electronic grade is the margin leader, with qualification barriers limiting competitive entry and supporting sustained price premiums.
By Concentration/Form
| Sub-Segment | Key Trend |
| Aqueous Solution | Standard delivery form leveraging existing liquid-handling infrastructure globally |
| Powder & Granular Adducts | Consumer product innovation (laundry pods, dental whiteners) accelerates solid-format adoption. |
Aqueous solutions dominate because industrial users have invested in dedicated piping, storage, and dosing systems optimized for liquid hydrogen peroxide. Powder adducts are carving out a growing niche in consumer-facing products where solid-format convenience and shelf stability outweigh per-unit cost premiums.
By End-User Industry
| Sub-Segment | Key Trend |
| Pulp & Paper | Largest consumer; TCF/ECF sequences ensure continued reliance on peroxide bleaching. |
| Chemical Synthesis | HPPO plants represent captive, high-volume demand with long-term offtake contracts |
| Wastewater Treatment | Fastest-growing end-use; advanced oxidation mandates in the EU and ASEAN drive expansion |
| Hydrogen Peroxide Market | Heap-leach and flotation circuits in gold, uranium, and lithium operations |
| Textiles | Asian garment hubs scaling peroxide consumption for fabric preparation and whitening |
| Other Industries | Food processing, healthcare sterilization, electronics, and cosmetics |
Pulp and paper's dominant share reflects decades of integration into bleaching sequences, though its growth rate lags the market average as recycled fiber reduces per-ton peroxide requirements. Wastewater treatment is the highest-growth end-user, propelled by quaternary treatment mandates and municipal adoption of peroxide-based advanced oxidation processes.
By Geography
| Sub-Segment | Key Trend |
| Asia-Pacific | Dominant producer and consumer; China's capacity surplus creates export-driven price pressure |
| North America | Semiconductor and remediation demand drive above-average growth; CHIPS Act investment pipeline. |
| Europe | Green peroxide leadership; healthcare and regulatory-driven substitution from chlorine systems |
| South America | Brazilian pulp expansion and Argentine mining create concentrated demand pockets. |
| Middle East & Africa | Nascent but accelerating; desalination, petrochemical, and emerging textile sectors |
Asia-Pacific's commanding share reflects China's massive production base and the region's large pulp, textile, and chemical synthesis industries. North America and Europe are higher-margin markets where semiconductor, healthcare, and environmental applications command premium pricing and drive value growth ahead of volume growth.