India Medical Devices Market (2026 - 2035)

India Medical Devices Market Research Report: Size, Share, Trend Analysis By Types (Orthopedic Devices, Cardiovascular Devices, Diagnostic Imaging, IVD, MIS, Wound Management, Diabetes Care, Opthalmic Devices, Dental, Nephrology, General Surgery, and Others), By End Users (Hospitals and ASCs, Clinics, and Others) - Growth Outlook & Industry Forecast 2025 To 2035

Forecast Period
2026-2035
CAGR
8.3%
2025 Market Size
USD 18.00 Billion
2035 Market Size
USD 39.95 Billion
Medical Device ● Updated August 24, 2026 Report ID: MRFR/MED/16246-HCR | Pages: 128 | Author: Satyendra Maurya, Rahul Gotadki

India Medical Devices Market Summary

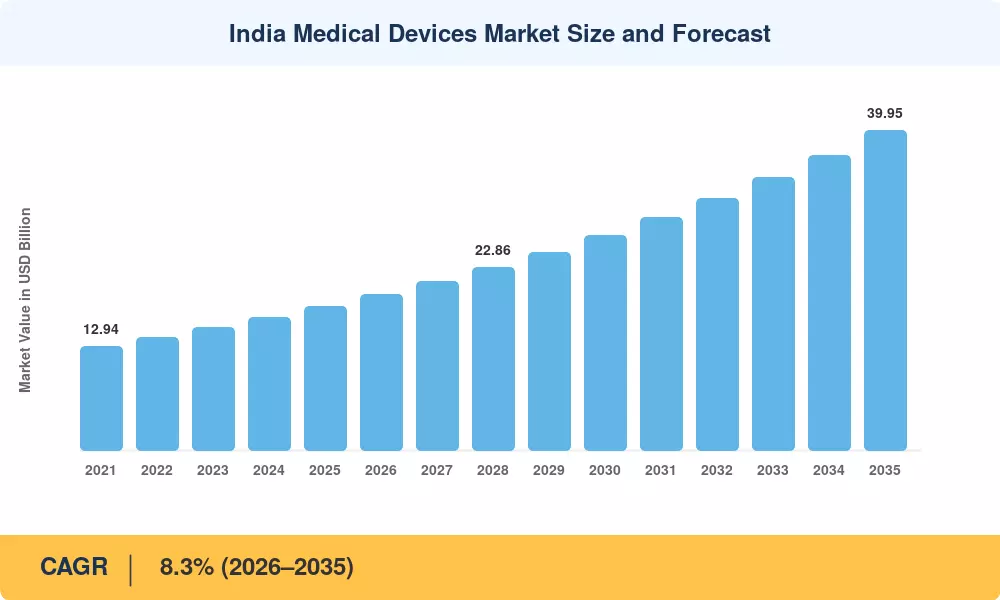
The India Medical Devices Market was valued at USD 18.00 billion in 2025 and is projected to grow to USD 39.95 billion by 2035, expanding at a compound annual growth rate (CAGR) of 8.3% between 2026 and 2035. Market value is expected to reach USD 19.49 billion in 2026 as the first year of the forecast period. This growth is being driven primarily by government-backed manufacturing incentives and expanding public health procurement, alongside a broader shift toward digital and AI-enabled diagnostic technology across Indian hospitals.

The Production-Linked Incentive (PLI) scheme for medical devices has already seeded twenty-two greenfield manufacturing plants, which have collectively booked roughly INR 12,344 crore (about USD 1.48 billion) in cumulative sales and INR 5,869 crore (roughly USD 703 million) in exports. This scheme has directly strengthened India's domestic manufacturing base and reduced reliance on imported devices. Alongside it, the Ayushman Bharat Pradhan Mantri Jan Arogya Yojana (PM-JAY) health insurance scheme has pulled tertiary-grade equipment procurement into district hospitals that previously purchased almost nothing above basic consumables, significantly widening the addressable market beyond metro hospitals.

Technology substitution is also reshaping the market beneath these policy headlines. Analog radiography equipment, isolated bedside monitors, and manually read glucometers are being replaced by digital radiography with AI triage overlays, networked central-station telemetry, and continuous glucose sensing. The National Medical Devices Policy 2023 targets a USD 50 billion domestic market by 2030 and has allocated funding for four dedicated medical device parks, backed by approximately INR 400 crore in central government funding.

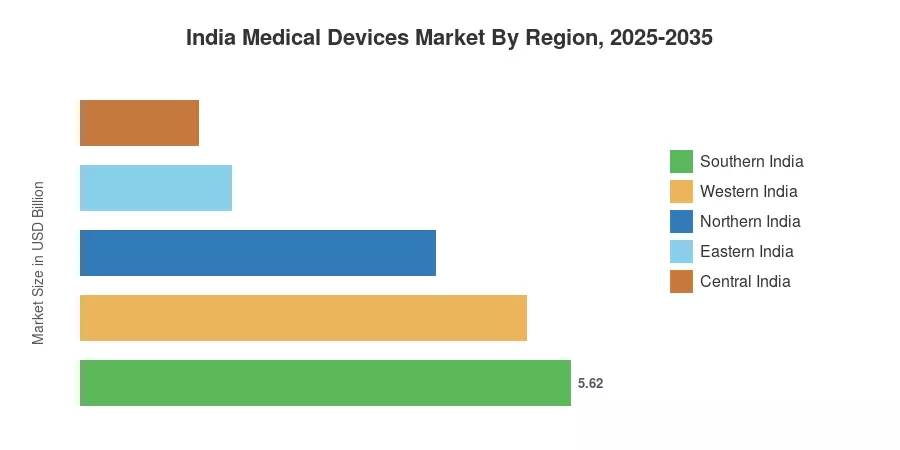
By region, Southern India holds the largest share of the India Medical Devices Market, at 31.2% of 2025 revenue, driven by manufacturing hubs in Chennai, Bengaluru, and Hyderabad, along with a dense private hospital base. Eastern India is the fastest-growing region, with a projected CAGR of 9.6%. Western India holds the second-largest share, at 28.4%, supported by Gujarat's medical device manufacturing clusters. The demand gap between metro and tier-2 cities is expected to continue narrowing through 2030.


Key Report Takeaways

• By Technology

  • Conventional electro-mechanical and disposable platforms held 39.78% of 2025 revenue in the India Medical Devices Market, still the default installed base across public hospitals.
  • Augmented and virtual-reality surgical solutions are forecast to grow at a 9.38% CAGR through 2035, the fastest of any platform tier.
  • Wearable and remote-monitoring platforms are expected to contribute USD 4.21 billion by 2030

• By Sector

  • Therapeutic devices commanded 33.10% of 2025 revenue, led by cardiovascular and orthopaedic implants.
  • Monitoring devices are projected to post a 9.14% CAGR, the quickest device-type expansion in the India Medical Devices Market.
  • Cardiology accounted for 22.61% of therapeutic-application revenue in 2025

• By Geography

  • Southern India held 31.2% of 2025 revenue
  • Eastern India is set to grow at a 9.6% CAGR to 2035
  • Western India generated USD 5.11 billion in 2025


Market Size and Forecast (2021–2035)

The India Medical Devices Market Sizing combines bottom-up revenue reconstruction using customs import data under HS codes 9018–9022, audited filings of 60 domestic and global firms, CDSCO import-licence volumes and hospital capital-expenditure surveys across 340 institutions. Historical years are triangulated against Department of Pharmaceuticals production numbers; projection years use device-category elasticity to predict health spending per capita.
India Medical Devices Market Size and Forecast
Our Impact
Enabled $4.3B Revenue Impact for Fortune 500 and Leading Multinationals
Partnering with 2000+ Global Organizations Each Year
30K+ Citations by Top-Tier Firms in the Industry

Driver Impact Analysis

Driver ~% Impact on CAGR Geographic Relevance Impact Timeline
PLI-backed domestic capacity build-out 1.6 Gujarat, Tamil Nadu, Himachal Medium-term (2–4 yr)
Chronic disease burden expansion 1.5 Pan-India Long-term (≥4 yr)
Ayushman Bharat volume procurement 1.2 Tier-2 and tier-3 districts Short-term (≤2 yr)
Private hospital capex and bed addition 1.1 Metros, southern states Medium-term (2–4 yr)
Digital health infrastructure (ABDM) 0.9 Pan-India Medium-term (2–4 yr)
Health insurance penetration growth 0.8 Urban and semi-urban Long-term (≥4 yr)
Export competitiveness in consumables 0.6 Western and southern clusters Long-term (≥4 yr)


Production Incentives Reshaping Supply

The PLI scheme for medical devices committed INR 3,420 crore across four target segments — cancer care equipment, radiotherapy devices, imaging systems and implants — with disbursement tied to incremental sales thresholds [1]. Twenty-two plants have been commissioned, and their combined output has displaced an estimated 11% of previously imported high-end radiotherapy and CT volume. Import dependence, historically near 80%, has begun a slow slide toward the low seventies. That shift matters less for headline growth than for margin structure: domestically assembled units carry roughly 14–18% lower landed cost, which lets manufacturers price into district hospitals that previously bought refurbished equipment.

Chronic Disease Burden

India's diabetic population is estimated at 101 million, with a further 136 million pre-diabetic, and cardiovascular disease accounts for roughly 28% of all deaths nationally [10][13]. Screening programmes under the National Programme for Prevention and Control of Non-Communicable Diseases have widened point-of-care testing at more than 200,000 health and wellness centres. Each incremental screening tier converts into recurring consumable demand — test strips, lancets, ECG electrodes — which is why monitoring devices outpace capital equipment on growth even though their absolute revenue base is smaller.

Public Insurance as a Procurement Engine

PM-JAY covers roughly 550 million beneficiaries and has processed cumulative hospital admissions exceeding 80 million, with cardiology and orthopaedics among the highest-value packages [3]. Empanelled hospitals must meet minimum equipment standards, which forces capital purchases that would otherwise have been deferred. The effect is most visible in Bihar, Odisha and Chhattisgarh, where empanelment growth has run well ahead of the national average and where installed imaging base per million population remains under half the national figure.

Digital Health Rails

The Ayushman Bharat Digital Mission has issued more than 700 million health accounts and registered upward of 400,000 verified health professionals [9]. Interoperability standards let connected devices push readings directly into longitudinal records, which changes the purchase calculus for tele-ICU consoles and networked vitals monitors. Hospitals buying today increasingly specify HL7-FHIR compatibility as a tender requirement rather than a nice-to-have.


Restraints Impact Analysis

Restraint ~% Drag on CAGR Geographic Relevance Impact Timeline
Price ceilings on stents and implants 1.1 Pan-India Short-term (≤2 yr)
Import dependence on high-end components 0.9 Pan-India Long-term (≥4 yr)
After-sales service gaps outside metros 0.7 Tier-2, tier-3 cities Medium-term (2–4 yr)
Regulatory transition costs under MDR 2017 0.6 Small and mid-size manufacturers Medium-term (2–4 yr)
Skilled biomedical technician shortage 0.5 Eastern and central states Long-term (≥4 yr)


Price Control Compression

NPPA capped drug-eluting stent prices at roughly INR 30,080 and knee implant systems in a band starting near INR 54,720, with trade-margin rationalisation extended to a further 42 device categories [7]. Several multinationals withdrew premium SKUs from the Indian catalogue rather than sell below global floor prices. The volume response has been strong — stent procedures grew at double digits — but blended realisation per unit fell, muting revenue growth relative to procedure growth. Manufacturers have responded by shifting mix toward non-capped adjacencies such as electrophysiology catheters and structural heart devices.

Component Import Exposure

Roughly 70–75% of high-value inputs — detectors, transducers, medical-grade polymers, precision optics — are still sourced abroad, predominantly from China, Germany and the United States [14]. Currency movement and shipping volatility feed directly into bill-of-materials cost, and the four sanctioned device parks address assembly capacity more than component fabrication. Until a domestic supplier tier matures, localisation gains will remain concentrated in labour-intensive stages rather than the value-dense ones.

Service Coverage Beyond the Metros

Field-service density outside the top twenty cities averages one engineer per eleven installed high-value systems, against roughly one per four in metros [15]. Downtime for a district CT scanner can extend past three weeks. Hospitals factor that risk into purchasing, often choosing lower-specification equipment with simpler serviceability. It is a real constraint on premium adoption and, equally, the clearest opening for regional distributors willing to build service networks.


India Medical Devices Market Opportunities

Tier-2 and Tier-3 Hospital Build-Out

Roughly 60% of planned private bed additions through 2030 sit outside the eight largest metros, and land plus construction costs there run 35–45% lower [11]. Equipment vendors that package financing, installation and multi-year service into a single per-bed contract capture demand that outright purchase pricing leaves stranded. This is where volume-led strategies, rather than premium specification, decide share.

Remote Monitoring at Scale

Home-based cardiac and glucose monitoring is moving from pilot to reimbursement conversation, with several state insurance schemes evaluating remote patient monitoring codes [9]. The commercial model shifts from device sale to subscription, and the vendor that owns the data pipeline holds the renewal. Hardware margin compresses; recurring revenue quality improves.

Export Platform for Africa and Southeast Asia

Indian consumables and basic diagnostics already ship to more than 150 countries, and export value from PLI plants alone crossed USD 703 million [2]. Regulatory recognition agreements under discussion with several ASEAN regulators would cut registration timelines materially. Cost-engineered Indian devices fit the price point of health systems that cannot absorb European or American list pricing.

Data Monetisation Through Imaging Archives

Large hospital chains now hold multi-petabyte imaging archives with linked outcome data. De-identified licensing to algorithm developers, and co-development deals where the hospital takes equity or royalty rather than a service fee, are emerging as a second revenue line. Regulatory clarity under the Digital Personal Data Protection Act will determine how fast this scales [17].

Refurbishment and Circular Equipment Models

Certified refurbishment of imaging systems, permitted under defined conditions, extends asset life at roughly 40–55% of new-unit cost [18]. For district hospitals operating under tight capital budgets, this is often the only realistic path to CT or MRI access, and it creates an aftermarket that original manufacturers are increasingly choosing to control rather than cede.


India Medical Devices Market Future Outlook

Algorithmic Triage Becomes Standard Specification

CDSCO has begun processing software-as-medical-device applications under a defined pathway, and several chest X-ray triage tools now carry approval [8]. By the early 2030s, expect AI overlays to ship as bundled firmware rather than separate licences, particularly in radiography where India's radiologist-to-population ratio — roughly one per 100,000 — makes automated prioritisation an operational necessity, not a premium feature.

Subscription and Outcome-Linked Contracting

Equipment-as-a-service arrangements, in which hospitals pay per scan or per procedure rather than buying outright, are spreading from oncology into imaging. The model converts a capital barrier into an operating line and suits the cash-flow profile of tier-2 institutions. Vendors accept balance-sheet risk in exchange for a decade-long revenue annuity and consumables lock-in.

Localisation Moving Up the Value Stack

Assembly localisation is largely solved; component localisation is not. Watch for joint ventures in detector arrays, precision optics and medical-grade polymers, where the Department of Pharmaceuticals has signalled willingness to extend incentive support [4]. If component value-add rises from roughly a quarter to half of ex-factory cost by 2032, the sector's import bill flattens even as output doubles.

Environmental and Lifecycle Reporting

Business Responsibility and Sustainability Reporting is now mandatory for the top 1,000 listed Indian companies, and large hospital groups fall within scope [21]. Procurement teams have begun asking for energy consumption per scan and end-of-life take-back commitments. Single-use plastics in disposables face the same scrutiny, which will favour manufacturers that can document recycled content and sterilisation reprocessing pathways.


India Medical Devices Market Segmentation

Segmentation within the India Medical Devices Market follows four axes: device type, technology platform, therapeutic application and end-user.

By Device Type

Segment Metric Primary Demand Driver
Therapeutic Devices 33.10% share (2025) Cardiac and orthopaedic implant volume
Diagnostic Imaging USD 4.03 billion (2025) District hospital imaging build-out
Monitoring Devices 9.14% CAGR (2026–2035) Chronic disease screening and home care
Surgical Devices 18.4% share (2025) Minimally invasive procedure adoption
Patient Assistive and Other USD 1.31 billion (2025) Ageing population and rehabilitation


Therapeutic devices dominate the India Medical Devices Market because implant and interventional volumes scale directly with insured procedure counts, and PM-JAY packages have made stenting and joint replacement accessible far outside metro catchments. Realisation per unit has compressed under price control, yet the category still leads on absolute revenue because unit volumes have grown faster than prices have fallen.

Monitoring devices grow fastest for a structurally different reason. The addressable population is not patients undergoing procedures but the far larger cohort under surveillance — 101 million diagnosed diabetics, plus hypertensive and cardiac-risk populations [10]. Consumables attach at high frequency, and replacement cycles measure in months rather than years.

By Technology Platform

Segment Metric Primary Demand Driver
Conventional Electro-Mechanical and Disposable 39.78% share (2025) Installed base inertia in public hospitals
Wearable and Remote Monitoring USD 2.16 billion (2025) Home care and post-discharge follow-up
AI and Robotics-Enabled Systems 9.05% CAGR (2026–2035) Surgical precision and radiologist scarcity
Augmented and Virtual Reality Solutions 9.38% CAGR (2026–2035) Surgical training and pre-operative planning
Connected and IoMT Platforms 11.6% share (2025) Interoperability mandates under digital health rails


Conventional platforms retain the largest slice of the India Medical Devices Market and will do so through the early 2030s, since public procurement replaces on failure rather than on schedule. Augmented and virtual-reality solutions grow fastest from a very small base, concentrated in twelve to fifteen high-volume surgical centres where training throughput justifies the capital.

By Therapeutic Application

Segment Metric Primary Demand Driver
Cardiology 22.61% share (2025) Interventional procedure volume growth
Orthopaedics USD 2.88 billion (2025) Joint replacement under insurance packages
Neurology 9.87% CAGR (2026–2035) Stroke care network expansion
Oncology 14.2% share (2025) Radiotherapy capacity addition
Ophthalmology USD 1.24 billion (2025) Cataract surgery volume at scale
Diabetes Care 9.3% CAGR (2026–2035) Self-monitoring and sensor adoption
Other Applications 11.8% share (2025) General surgery and ENT


By End-User

Segment Metric Primary Demand Driver
Hospitals 61.50% share (2025) Tertiary procedure concentration
Clinics 10.09% CAGR (2026–2035) Primary care formalisation and chain expansion
Ambulatory Surgical Centres USD 1.44 billion (2025) Day-care surgery shift
Diagnostic Laboratories 12.7% share (2025) Organised chain consolidation
Home Care Settings 9.8% CAGR (2026–2035) Post-acute and elderly care


Hospitals anchor the India Medical Devices Market and will remain the majority buyer, but their share erodes slowly as procedures migrate to lower-acuity settings. Clinics grow quickest because organised primary-care chains are standardising equipment across hundreds of small sites simultaneously, turning what used to be fragmented single-unit purchases into national tenders.


Regional Market Share Analysis

Region Metric (2025) Primary Investment Themes
Southern India 31.2% share Medical tourism, device manufacturing clusters, tertiary oncology
Western India USD 5.11 billion Consumables production, corporate hospital chains, export logistics
Northern India 22.6% share Government tertiary institutions, NCR private capex, diagnostics chains
Eastern India 9.6% CAGR PM-JAY empanelment, district hospital upgrades, first-time imaging
Central India USD 1.35 billion Mission-mode district capacity, mobile diagnostics
Total USD 18.00 billion

Demand within the India Medical Devices Market is unevenly distributed, tracking private hospital density, manufacturing clusters and insurance penetration rather than population alone.


Southern India

State Metric Key Driver
Tamil Nadu 29.4% of regional revenue Chennai device cluster; TIDCO medical park
Karnataka USD 1.42 billion Bengaluru R&D base and corporate hospital density
Telangana 9.1% CAGR Genome Valley diagnostics ecosystem
Andhra Pradesh 14.8% of regional revenue Medtech park at Visakhapatnam
Kerala USD 0.71 billion Highest per-capita health spending nationally


Tamil Nadu's medical device park at Oragadam anchors a supplier base that now includes injection moulding, sterilisation and electronics assembly within a 60-kilometre radius, which is why lead times for locally assembled monitors run weeks rather than months [5]. Kerala's demand profile is different again — an older population and near-universal literacy produce diagnostic utilisation rates closer to upper-middle-income benchmarks than to the Indian average.

Western India

State Metric Key Driver
Maharashtra 51.2% of regional revenue Mumbai and Pune tertiary care concentration
Gujarat USD 1.79 billion Consumables and disposables manufacturing base
Goa 8.7% CAGR Pharmaceutical adjacency and medical tourism
Rest of Western India 6.3% of regional revenue District hospital modernisation


Gujarat produces a disproportionate share of India's syringes, catheters and IV sets, and the state's medical device park at Rajkot was designed around exactly that competency [5]. Maharashtra's strength is downstream rather than upstream: Mumbai and Pune together host the largest concentration of NABH-accredited tertiary beds in the country, which pulls premium imaging and interventional equipment purchases.

Northern India

State/Territory Metric Key Driver
Delhi NCR 34.6% of regional revenue AIIMS-anchored tertiary demand; corporate chains
Haryana USD 0.72 billion Gurugram hospital corridor
Punjab 7.9% CAGR Cardiac and oncology referral volume
Uttar Pradesh 21.3% of regional revenue Largest PM-JAY beneficiary base
Rajasthan USD 0.44 billion State insurance scheme coverage


Uttar Pradesh illustrates the volume-versus-value split cleanly. It contributes the largest number of insured procedures of any state, yet realisation per procedure sits below the national mean because case mix skews toward lower-value packages [3]. Vendors that win there do so on service economics and financing terms rather than specification depth.

Eastern India

State Metric Key Driver
West Bengal 41.8% of regional revenue Kolkata referral hub for the eastern belt
Odisha 10.4% CAGR BSKY state scheme; district imaging rollout
Bihar USD 0.31 billion Empanelment growth from a low base
Jharkhand 9.7% of regional revenue Mining-sector occupational health demand
Assam and Northeast USD 0.22 billion Regional medical college expansion


Odisha's Biju Swasthya Kalyan Yojana pushed cashless coverage across nearly the entire state population. It required empanelled facilities to meet defined equipment norms, which triggered a wave of first-time CT and dialysis installations in district headquarters hospitals [19]. Growth here is genuinely additive rather than replacement-driven, which is why the regional CAGR leads the country.

Central India

State Metric Key Driver
Madhya Pradesh 56.9% of regional revenue New medical colleges under central scheme
Chhattisgarh 9.2% CAGR Tribal health outreach and mobile diagnostics
Rest of Central India USD 0.19 billion Primary health centre upgrades


Madhya Pradesh has commissioned a series of new government medical colleges under the centrally sponsored district hospital upgrade programme, each requiring a standard equipment package spanning radiology, pathology and critical care [20]. Procurement runs through state tenders with heavy weighting on price and warranty length, which favours domestic manufacturers over premium importers.


India Medical Devices Market By Region, 2025-2035

Competitive Benchmarking

Moderate concentration. The top 5 suppliers are projected to account for 34-39% of revenue, and the calculated HHI is about 620, which positions the sector far within unconcentrated territory. Multinationals are ahead in imaging and high-value implants; domestic enterprises are ahead in consumables, disposables and entry-level diagnostics, where cost engineering trumps brand. Multinationals are localizing assembly to safeguard price-controlled categories; Indian producers are moving upmarket into imaging subsystems – competitive pressures are increasing.

Company Est. Revenue Share Range Key Offerings for India Medical Devices Market Strategic Positioning
Siemens Healthineers India ~8–11% CT, MRI, molecular imaging, lab diagnostics Premium imaging leader; Bengaluru manufacturing
Wipro GE Healthcare ~7–10% Imaging, ultrasound, patient monitoring Localised production; strong public tender presence
Philips India ~6–9% Diagnostic imaging, cardiac care, respiratory Solutions bundling with long-term service contracts
Medtronic India ~5–8% Cardiac rhythm, diabetes, surgical Deep interventional cardiology relationships
Abbott India (Medical Devices) ~4–7% Vascular, structural heart, glucose sensing Strong sensor franchise in diabetes care
Becton Dickinson India ~3–6% Syringes, infusion, specimen management Volume consumables with local plants
Johnson & Johnson MedTech India ~3–6% Orthopaedics, surgical, vision Broad surgical portfolio; training investment
Boston Scientific India ~2–5% Interventional cardiology, endoscopy Focused on high-growth interventional niches
Poly Medicure ~2–4% Infusion therapy, dialysis, blood management Export-led domestic manufacturer
Meril Life Sciences ~2–4% Stents, orthopaedic implants, diagnostics Vertically integrated Gujarat manufacturing base
Trivitron Healthcare ~1–3% Imaging, newborn screening, radiation protection Cost-competitive across public procurement
Transasia Bio-Medicals ~1–3% In-vitro diagnostics instruments and reagents Largest domestic IVD installed base


Recent News & Developments

Activity across the India Medical Devices Market over the past three years has clustered around localisation, regulatory tightening and digital integration.

  • Department of Pharmaceuticals (April 2023): Released the National Medical Devices Policy 2023, setting a USD 50 billion sector target by 2030 and outlining six strategy pillars including regulatory streamlining and infrastructure [4]
  • NPPA (February 2023): Extended trade margin rationalisation to 42 additional device categories, capping distributor margins at 30% of price to stockist [7]
  • Siemens Healthineers (September 2023): Expanded its Bengaluru facility to produce mid-range CT systems for domestic and export markets, deepening local value addition [22]
  • Meril Life Sciences (March 2024): Received approval milestones for its transcatheter aortic valve system, positioning a domestic player in structural heart against established multinationals [23]
  • CDSCO (October 2024): Completed the phased licensing transition bringing all device classes under Medical Devices Rules 2017, ending the earlier voluntary registration regime [8]
  • Wipro GE Healthcare (January 2025): Announced additional investment in its Indian manufacturing and R&D footprint under localisation commitments, targeting expanded ultrasound and monitoring output [24]
  • National Health Authority (May 2025): Broadened PM-JAY coverage to all citizens aged 70 and above, adding an estimated 45 million beneficiaries and lifting geriatric device demand [3]
  • Poly Medicure (July 2025): Commissioned additional capacity for renal care and infusion consumables aimed at export markets across Africa and Southeast Asia [25]


India Medical Devices Market Report Scope

Parameter Detail
Market Scope Diagnostic imaging, therapeutic, monitoring, surgical and assistive devices sold in India
Study Period 2021–2035 (Historical 2021–2024; Base Year 2025; Forecast 2026–2035)
CAGR 8.3% (2026–2035)
Market Size Checkpoints USD 18.00 billion (2025); USD 19.49 billion (2026); USD 26.81 billion (2030); USD 39.95 billion (2035)
Fastest Growing Segments Clinics (end-user); Augmented and Virtual Reality Solutions (platform); Neurology (application)
Companies Profiled 12 leading suppliers to the India Medical Devices Market across imaging, implants, consumables and diagnostics
Valuation Currency USD billion

FAQs

How should a hospital evaluate total cost of ownership before buying imaging equipment in the Indian Medical Devices Market?
Service contract cost typically adds 8–12% of purchase price annually after warranty. Factor in uptime guarantees, spare-part lead times and tube or detector replacement cycles, which often exceed the original discount negotiated [15].
What regulatory pathway applies to software-based devices in the Indian Medical Devices Market?
Software as a medical device is classified under Medical Devices Rules 2017 by risk class, with most clinical decision-support tools falling in Class B or C. Approval requires clinical evidence and a registered Indian authorised agent [8].
Are refurbished imaging systems a viable procurement option?
Yes, within defined import conditions requiring minimum residual life and certification. They cut acquisition cost roughly in half, but resale value and software upgrade eligibility are limited [18].
Which segments face the greatest exposure to future price control in the India Medical Devices Market?
Categories with high insured procedure volume and limited substitution — orthopaedic implants, cardiac devices and consumables used in PM-JAY packages — carry the most risk. Non-capped adjacencies like electrophysiology remain comparatively insulated [7].
How do trade margin caps affect distributor economics?
Margins to stockists are capped at 30% for notified categories, compressing multi-tier distribution. Distributors are responding by consolidating and adding installation and service revenue to replace lost product margin [7].
What certification do exporters need for African and ASEAN markets?
Most require ISO 13485 certification plus a CDSCO free-sale certificate; several additionally accept CE or US clearance as a fast track. Registration timelines vary from four months to over two years [2].
Where is the biggest integration challenge for connected devices?
Legacy equipment without HL7-FHIR output requires middleware gateways, which add cost and a failure point. Specifying native interoperability at purchase is materially cheaper than retrofitting later [9].    
Author
Author
Author Profile
Satyendra Maurya LinkedIn
Research Analyst
An accomplished research analyst with high proficiency in market forecasting, data visualization, competitive benchmarking, and others. He holds a pronounced track record in research and consulting projects for sectors such as life sciences, medical devices, and healthcare IT. His capabilities in qualitative and quantitative analysis have resulted in positive client outcomes. Working on niche market trends, opportunities, sales, and forecasted value is part of his skill set.
Co-Author
Co-Author Profile
Rahul Gotadki LinkedIn
Research Manager
He holds an experience of about 9+ years in Market Research and Business Consulting, working under the spectrum of Life Sciences and Healthcare domains. Rahul conceptualizes and implements a scalable business strategy and provides strategic leadership to the clients. His expertise lies in market estimation, competitive intelligence, pipeline analysis, customer assessment, etc.
Share::
Request Free Sample
Download Free Sample

Kindly complete the form below to receive a free sample of this Report

* Please use a valid business email

Share::
Request Free Sample
Download PDF ×

We do not share your information with anyone. However, we may send you emails based on your report interest from time to time. You may contact us at any time to opt-out.
















