Segmentation Quick Reference
| Dimension | Sub-Segments | Dominant Segment | Fastest Growing Segment |
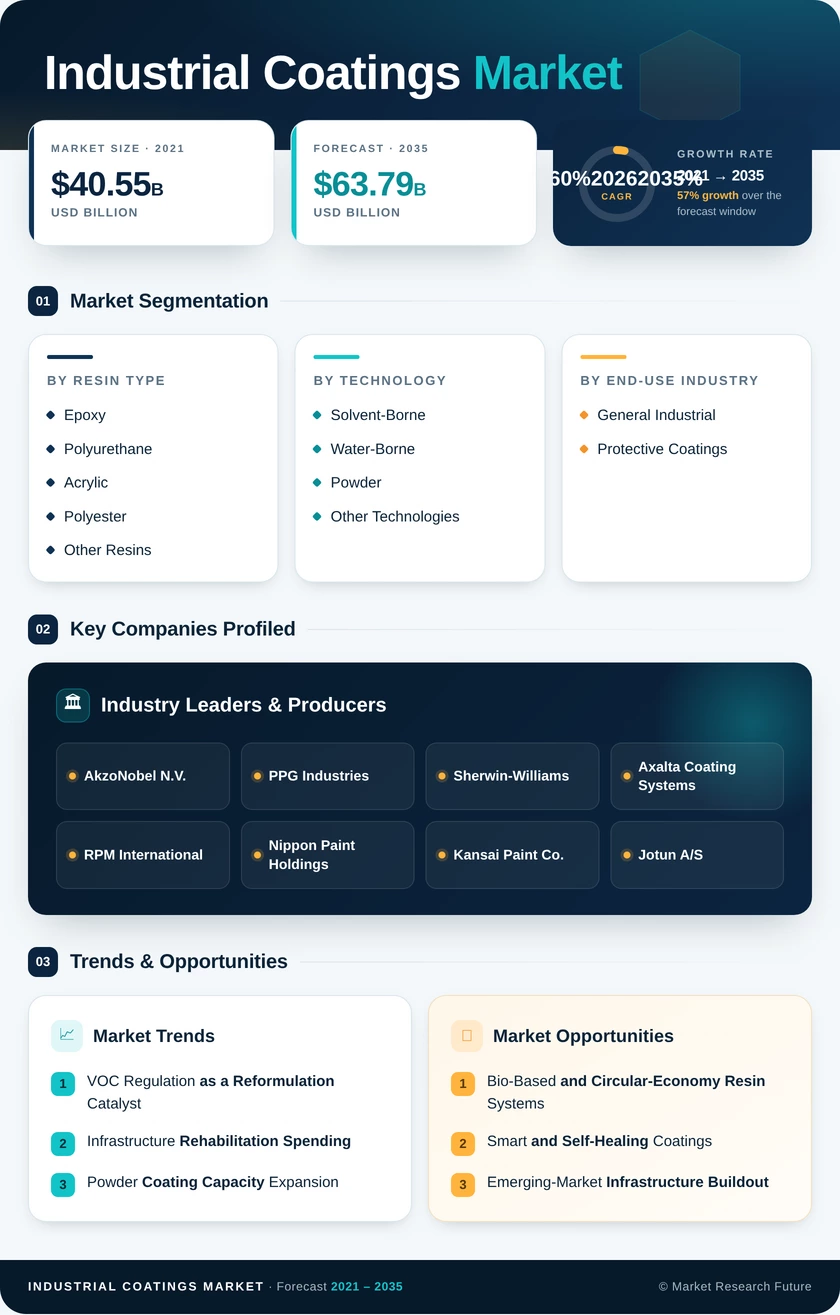
| Resin Type | Epoxy, Polyurethane, Acrylic, Polyester, Other Resins | Epoxy (33.0% share, 2025) | Polyurethane (5.50% CAGR) |
| Industrial Coatings Market | Solvent-Borne, Water-Borne, Powder, Other Technologies | Solvent-Borne (39.5% share, 2025) | Water-Borne (5.30% CAGR) |
| End-Use Industry | General Industrial, Protective Coatings | General Industrial (64.3% share, 2025) | Protective Coatings (4.45% CAGR) |
| Substrate | Metal, Concrete | Metal (67.0% share, 2025) | Concrete (4.95% CAGR) |
| Geography | Asia-Pacific, North America, Europe, South America, Middle East & Africa | Asia-Pacific (54.7% share, 2025) | Asia-Pacific (4.70% CAGR) |
Market Segmentation Overview
By Resin Type
| Sub-Segment | Key Trend |
| Epoxy | Dominant resin for corrosion protection on steel and concrete; hybrid epoxy-PU formulations gaining traction |
| Polyurethane | Fastest-growing resin driven by aerospace MRO and wind-energy topcoat specifications |
| Acrylic | Strong crossover between architectural and industrial finishing; fast-dry properties valued in OEM lines |
| Polyester | Primary resin for coil-coating and appliance powder finishing; stable demand tied to construction output |
| Other Resins | Includes silicone, fluoropolymer, and alkyd chemistries for high-temperature and specialty applications |
Epoxy and polyurethane collectively represent the core resin platform for most protective and general-industrial applications. Growing demand for UV-stable, flexible films in outdoor infrastructure is shifting formulator R&D budgets toward polyurethane and acrylic-polyurethane hybrid systems, while epoxy retains dominance where chemical resistance and adhesion to metal substrates are paramount.
By Industrial Coatings Market
| Sub-Segment | Key Trend |
| Solvent-Borne | Declining share but remains essential for extreme-environment applications such as offshore and chemical plants |
| Water-Borne | Fastest-growing technology; regulatory pressure and performance parity driving rapid adoption globally |
| Powder | Near-zero-emission finishing for appliances, automotive wheels, and architectural components |
| Other Technologies | UV-cured and radiation-cured systems gaining ground in high-speed composite and automotive lines |
The technology landscape is defined by a secular shift away from solvent-borne systems toward lower-emission alternatives. Water-borne coatings now deliver film performance within 90% of solvent benchmarks in most general-industrial applications, while powder coatings dominate high-volume factory-applied finishing where transfer efficiency and waste reduction are critical cost drivers.
By End-Use Industry
| Sub-Segment | Key Trend |
| General Industrial | Broad application across machinery, HVAC, electrical enclosures, and heavy equipment finishing |
| Protective Coatings | Infrastructure rehabilitation and pipeline maintenance cycles driving above-average growth |
General industrial applications account for the majority of volume, reflecting the breadth of factory-finished goods requiring durable surface coatings. Protective coatings are growing faster as aging infrastructure in developed markets and new-build programs in emerging economies create sustained demand for heavy-duty corrosion-control systems.
By Substrate
| Sub-Segment | Key Trend |
| Metal | Steel and aluminum substrates dominate; automotive, appliance, and structural steel are primary end uses |
| Concrete | Gaining share through bridge-deck sealers, industrial flooring, and water-treatment facility linings |
Metal substrates remain the primary volume driver, but concrete is the faster-growing category as governments invest in extending the service life of highway bridges, parking structures, and water-treatment infrastructure through advanced epoxy and polyurethane coating systems.
By Geography
| Sub-Segment | Key Trend |
| Asia-Pacific | Dominant region; China and India drive over half of global consumption through infrastructure and manufacturing |
| North America | Pipeline corrosion control, aerospace MRO, and VOC-compliance reformulation underpin demand |
| Europe | Green Deal mandates and offshore-wind expansion accelerate water-borne and powder adoption |
| South America | Mining and oil-and-gas infrastructure in Brazil and Argentina are primary growth levers |
| Middle East & Africa | GCC mega-projects and African extractive-industry expansion support above-average regional growth |
Regional dynamics reflect each geography's unique blend of regulatory pressure, industrial-output trajectory, and infrastructure investment cycle. Asia-Pacific's scale advantage continues to widen, while North America and Europe compete on technology sophistication and sustainability-driven reformulation leadership.