Industrial Coatings Market

Key Players: AkzoNobel N.V., PPG Industries, Sherwin-Williams, Axalta Coating Systems, RPM International, Nippon Paint Holdings, Kansai Paint Co., Jotun A/S

Industrial Coatings Market

Industrial Coatings Market Research Report Information By Resin (Acrylic, Epoxy, Polyester, Polyurethane, and Fluoropolymers), By Technology (Water-Based, Solvent-Based, and Powder), By End-user (General Industrial, Automotive & Transportation, Industrial Wood, Marine Protective, and Packaging) And By Region (North America, Europe, Asia-Pacific, And Rest Of The World) –Market Forecast Till 2035
ID: MRFR/CnM/1594-CR
111 Pages
Chitranshi Jaiswal
Last Updated: June 22, 2026

Industrial Coatings Market Summary

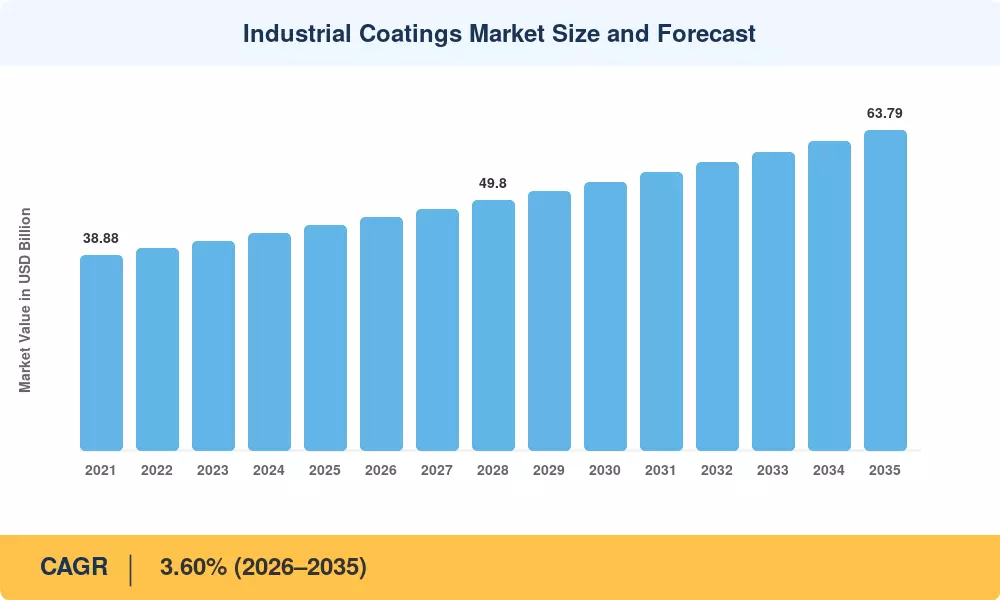
The Industrial Coatings Market was valued at USD 44.89 billion in 2025 and is projected to reach USD 46.40 billion in 2026 before climbing to USD 63.79 billion by 2035, registering a CAGR of 3.60% during the forecast period. Tightening volatile-organic-compound (VOC) regulations across North America and Europe—anchored by the U.S. EPA's 2024 National Emission Standards update and the EU Industrial Emissions Directive revisions—are pushing end users toward compliant protective coating materials, accelerating reformulation budgets across the supply chain [2][3].

A fundamental shift in coating technology is reshaping how manufacturers protect industrial assets. Solvent-borne systems, long the default for heavy duty coatings, are ceding ground to water-borne, powder, and UV-cured alternatives that cut emissions by 60–80%. Global capital expenditure on powder coating materials lines exceeded USD 2.1 billion in 2024, driven by appliance OEMs and automotive wheel producers seeking near-zero-waste finishing [4]. Meanwhile, UV-LED curing installations in composite and automotive plants have doubled since 2022, lowering energy consumption by roughly 70% per line [5].

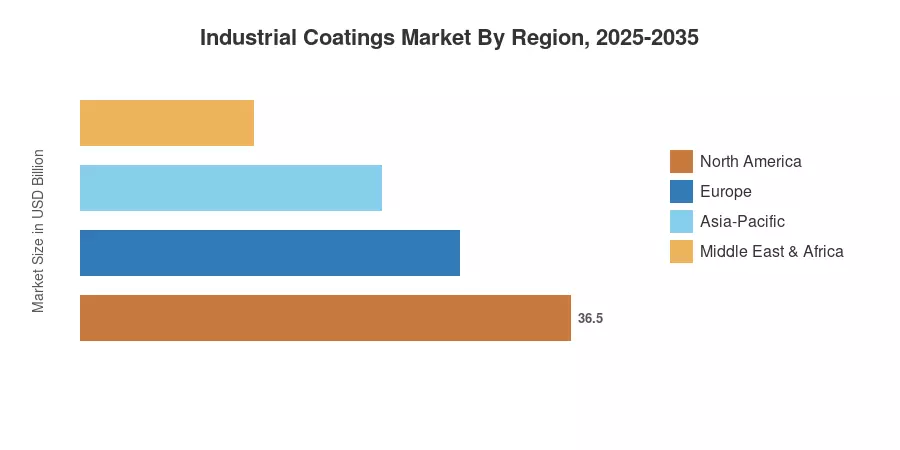
Asia-Pacific commands approximately 54.7% of the Industrial Coatings Market, supported by massive infrastructure spending in China and India. The region is also the fastest-growing, posting a projected CAGR of 4.70% through 2035 as bridge rehabilitation and petrochemical tank construction programs expand. North America holds the second-largest share at around 20.5%, anchored by corrosion resistant coatings demand in oil-and-gas pipeline maintenance and aerospace MRO. Europe follows closely, where sustainability mandates continue to channel investment into epoxy industrial coatings and water-borne reformulations.


Key Report Takeaways

• By Resin Type

  • Epoxy resins captured an estimated 33.0% share of the Industrial Coatings Market in 2025, driven by their superior adhesion in metal protective coatings applications.
  • Polyurethane systems are forecast to expand at a 5.50% CAGR through 2035, as aerospace and wind-energy sectors demand tougher, UV-stable surface protection coatings.

• By Technology

  • Solvent-borne products accounted for roughly 39.5% of the Industrial Coatings Market revenue in 2025, though their share is declining year over year.
  • Water-borne coatings are registering the fastest adoption among all technologies, growing at a 5.30% CAGR as VOC compliance tightens globally.

• By End-Use Industry & Substrate

  • General industrial applications represented approximately 64.3% of the Industrial Coatings Market in 2025, spanning machinery, HVAC, and heavy equipment finishing.
  • Metal substrates led with about 67.0% share, while concrete substrates are projected to grow at a 4.95% CAGR through 2035.

• By Region

  • Asia-Pacific dominated the Industrial Coatings Market with a 54.7% share in 2025.
  • South America is emerging as a high-potential region, recording a CAGR of 3.85%, fueled by Brazilian infrastructure concessions.


Market Size and Forecast (2021–2035)

MRFR's estimates combine bottom-up revenue tracking across 12 resin families with top-down validation against chemical output indices published by the American Chemistry Council, CEFIC, and China National Chemical Information Center. Historical figures reflect actual shipment data; forecast values apply a calibrated 3.60% CAGR with year-specific adjustments for regulation-driven demand surges and raw-material cost pass-throughs[6].

Industrial Coatings Market Size and Forecast
Our Impact
Enabled $4.3B Revenue Impact for Fortune 500 and Leading Multinationals
Partnering with 2000+ Global Organizations Each Year
30K+ Citations by Top-Tier Firms in the Industry

Driver Impact Analysis

Driver ~% Impact on CAGR Geographic Relevance Impact Timeline
VOC regulation tightening +0.55% North America, Europe Short-term (≤2 yr)
Infrastructure rehabilitation spending +0.50% Asia-Pacific, North America Medium-term (2–4 yr)
Powder coating capacity expansion +0.40% Asia-Pacific, Europe Short-term (≤2 yr)
Aerospace & wind-energy growth +0.35% Global Medium-term (2–4 yr)
Water-borne technology advancement +0.30% Global Long-term (≥4 yr)
UV-LED curing adoption +0.25% North America, Europe Long-term (≥4 yr)
EV and battery plant construction +0.20% North America, Asia-Pacific Medium-term (2–4 yr)


VOC Regulation as a Reformulation Catalyst

The U.S. EPA's 2024 update to the National Emission Standards for Hazardous Air Pollutants reduced allowable VOC limits for industrial surface coating operations by 15–20%, compelling facilities to transition away from legacy solvent-borne lines [2]. In Europe, the revised Industrial Emissions Directive (IED), effective in 2026, imposes best-available-technique-associated emission levels that functionally eliminate high-VOC protective coating materials in new permits. These twin regulatory forces are channeling an estimated USD 3.4 billion in cumulative reformulation investment toward water-borne and powder coating materials through 2028 [3].

Infrastructure Rehabilitation Spending

The U.S. Bipartisan Infrastructure Law allocated over USD 110 billion to bridges and highways, a significant share of which flows into corrosion-resistant coatings for steel structures [9]. China's 15th Five-Year Plan earmarks CNY 4.7 trillion for transport infrastructure, while India's Gati Shakti program targets 80,000 km of highway upgrades—each generating sustained demand for heavy-duty coatings and epoxy industrial coatings applied to rebar, tanks, and structural steel [8].

Powder Coating Capacity Expansion

Global powder coating materials capacity grew 9% in 2024, led by new plants in Guangdong and Gujarat [4]. Appliance manufacturers and automotive wheel producers favor powder because it delivers near-zero emissions and 95–98% transfer efficiency, cutting waste-disposal costs. AkzoNobel and PPG each commissioned powder super-plants exceeding 40,000 metric tons per year, signaling long-term confidence in this technology's share gains within the Industrial Coatings Market [15].

Aerospace and Wind-Energy Demand

The global commercial aircraft fleet is projected to grow 4.1% annually through 2035, requiring specialized high performance coatings that withstand extreme UV exposure and thermal cycling [13]. Simultaneously, the Global Wind Energy Council forecasts 680 GW of new onshore and offshore capacity by 2030, with each turbine blade consuming 200–400 kg of polyurethane-based surface protection coatings [16].


Restraints Impact Analysis

Restraint ~% Impact on CAGR Geographic Relevance Impact Timeline
Raw-material price volatility –0.40% Global Short-term (≤2 yr)
Slower construction in mature economies –0.30% Europe, North America Medium-term (2–4 yr)
Lengthy qualification cycles –0.20% Global Long-term (≥4 yr)
Bio-based resin scalability gap –0.15% Europe, North America Long-term (≥4 yr)
Trade tariffs on titanium dioxide –0.10% North America, Asia-Pacific Short-term (≤2 yr)


Raw-Material Price Volatility

Epoxy resins, titanium dioxide, and isocyanates—the backbone of industrial paint solutions—experienced 20–35% price swings between 2022 and 2024 driven by energy-cost pass-throughs and supply disruptions in China [7]. Smaller formulators lacking long-term feedstock contracts face margin compression that delays investment in water-borne and powder reformulations, slowing the Industrial Coatings Market's transition to low-VOC technologies.

Slower Construction Activity in Mature Economies

Elevated interest rates in Europe and North America reduced commercial construction starts by 8% year-over-year in 2024, directly trimming demand for surface protection coatings used in structural steel and concrete finishing [17]. While infrastructure stimulus programs partially offset this drag, private-sector building permits—particularly in office and retail—remain well below 2019 peaks.

Lengthy Qualification Cycles

Aerospace and oil-and-gas operators require 12–24 months of laboratory and field testing before approving a new coating system, a bottleneck that delays adoption of advanced corrosion resistant coatings and high performance coatings [18]. This qualification lag means even proven technologies can take years to translate from R&D success to commercial-scale revenue in the Industrial Coatings Market.


Industrial Coatings Market Opportunities

Bio-Based and Circular-Economy Resin Systems

Plant-derived epoxies from cashew-nut-shell liquid and lignin-based polyols are reaching pilot-plant scale, with BASF and Covestro each announcing 10,000-ton capacity targets by 2028 [11]. These bio-based industrial paint solutions could capture 5–7% of the resin mix by 2035, offering brands a differentiation lever as Scope 3 reporting mandates push end users toward lower-carbon protective coating materials.

Smart and Self-Healing Coatings

Micro-encapsulated corrosion inhibitors and embedded IoT sensors are transforming conventional coatings into active asset-monitoring systems. Research from EPRI indicates that self-healing metal protective coatings can extend recoat intervals on pipeline infrastructure by 30–40%, reducing lifecycle costs [12].

Emerging-Market Infrastructure Buildout

Africa and Southeast Asia represent under-penetrated geographies where heavy duty coatings demand is growing faster than global averages. The African Development Bank's USD 170 billion infrastructure funding pipeline through 2030 creates opportunities for coating suppliers willing to establish local blending plants and technical-service centers [20].

Data-Driven Coating-as-a-Service Models

Industrial OEMs are exploring outcome-based contracts in which coating suppliers guarantee corrosion protection levels for a fixed annual fee rather than selling product by the liter. This service model monetizes application expertise and predictive-maintenance data, creating recurring revenue streams and deeper customer lock-in within the Industrial Coatings Market.

EV Battery Plant Expansion

Over 200 gigafactory projects announced globally through 2030 require cleanroom-grade specialty industrial paints and electrostatic finishing lines for battery enclosures [14]. Coating suppliers with powder coating materials expertise and ultra-low-particulate application technology stand to capture a fast-growing niche.


Industrial Coatings Market Future Outlook

Digitalization and AI-Driven Application

Robotic spray systems equipped with machine-vision feedback loops are cutting overspray waste by 15–25% in automotive and appliance plants [12]. As AI algorithms optimize film-thickness uniformity in real time, the Industrial Coatings Market will see efficiency gains that lower per-unit coating costs and improve quality consistency for high performance coatings applications.

Electrification Supercycle and New Substrates

The IEA projects cumulative global investment of USD 19 trillion in clean-energy infrastructure by 2035, spanning EV battery plants, charging networks, and grid-scale storage facilities [14]. Each asset class introduces novel substrate and environmental challenges—battery enclosures, for instance, demand flame-retardant powder coating materials and electrostatic-safe finishes not previously required at scale.

ESG and Sustainable Procurement Mandates

Over 60% of Fortune 500 companies now include Scope 3 emissions in procurement criteria, per CDP data [10]. Coating suppliers that can document lower embodied carbon through bio-based resins, reduced-energy curing, and closed-loop solvent recovery will gain preferential supplier status—reshaping competitive dynamics across the Industrial Coatings Market.

Modular and Prefabricated Construction

The World Economic Forum estimates that modular construction could capture 15% of global new-build volume by 2030 [17]. Factory-applied protective coating materials on prefabricated steel and concrete modules shift coating demand from fragmented job sites to centralized finishing lines, favoring suppliers with automated industrial paint solutions and high-volume powder application capabilities.


Industrial Coatings Market Segmentation

By Resin Type

Segment Key Metric Primary Demand Driver
Epoxy 33.0% share (2025) Adhesion and chemical resistance for metal protective coatings
Polyurethane 5.50% CAGR (2026–2035) UV stability for aerospace and wind-energy applications
Acrylic USD 6.52 Billion (2025) Architectural-industrial crossover and fast drying
Polyester 3.20% CAGR (2026–2035) Coil-coating and appliance finishing
Other Resins USD 3.10 Billion (2025) Silicone, fluoropolymer, and alkyd niche applications


Epoxy resins remain the backbone of the Industrial Coatings Market, valued for their exceptional adhesion to steel and concrete, chemical resistance, and cost-effectiveness across general-industrial and protective applications. Facilities in marine, oil-and-gas, and water-treatment sectors depend on epoxy industrial coatings for long-term corrosion resistant coatings performance, though formulators are increasingly blending epoxy-polyurethane hybrids to improve UV durability.

Polyurethane systems represent the fastest-growing resin family, propelled by aerospace MRO cycles and the wind-energy sector's need for topcoats that resist chalking and gloss loss across 20-year service lives. The rise of two-component waterborne polyurethane formulations is further accelerating adoption, allowing applicators to meet VOC limits without sacrificing the toughness traditionally associated with solvent-borne heavy duty coatings.

By Technology

Segment Key Metric Primary Demand Driver
Solvent-Borne 39.5% share (2025) Legacy installed base in heavy industry
Water-Borne 5.30% CAGR (2026–2035) VOC regulation compliance across all regions
Powder USD 5.85 Billion (2025) Zero-emission appliance and automotive finishing
Other Technologies 3.45% CAGR (2026–2035) UV-cured and radiation-cured niche growth


Solvent-borne coatings still hold the largest technology share within the Industrial Coatings Market thanks to decades of proven field performance in demanding environments—offshore platforms, chemical plants, and high-temperature exhaust systems. Yet every major region is tightening VOC limits, and solvent-borne share is declining roughly one percentage point annually.

Water-borne technology is the primary beneficiary of this shift. Advances in acrylic and polyurethane emulsion chemistry now deliver film hardness and corrosion resistance within 90% of solvent-borne benchmarks, making water-borne surface protection coatings viable for applications that were once solvent-only territory.

By End-Use Industry

Segment Key Metric Primary Demand Driver
General Industrial 64.3% share (2025) Machinery, HVAC, heavy-equipment finishing
Protective Coatings 4.45% CAGR (2026–2035) Infrastructure rehabilitation and pipeline maintenance


General industrial applications dominate the Industrial Coatings Market because they encompass an enormous breadth of substrates—from agricultural equipment to electrical enclosures—finished in factory settings. Protective coatings, meanwhile, are growing faster due to the global backlog of aging infrastructure requiring corrosion resistant coatings for steel bridges, storage tanks, and marine vessels.

By Substrate

Segment Key Metric Primary Demand Driver
Metal 67.0% share (2025) Structural steel, automotive, and appliance substrates
Concrete 4.95% CAGR (2026–2035) Bridge decks, parking structures, and water-treatment tanks


Metal substrates command the majority of the Industrial Coatings Market because steel and aluminum are ubiquitous across manufacturing and construction. Concrete substrates are gaining share as infrastructure agencies invest in protective sealers and high-build epoxy systems that extend service life for highway bridges and industrial flooring.


Regional Market Share Analysis

Region Key Metric Primary Investment Themes
Asia-Pacific 54.7% share (2025) Bridge rehabilitation, petrochemical expansion, EV manufacturing
North America 20.5% share (2025) Pipeline corrosion control, aerospace MRO, VOC compliance
Europe 17.3% share (2025) Green Deal mandates, water-borne conversion, wind energy
South America 4.2% share (2025) Mining infrastructure, oil-and-gas coating demand
Middle East & Africa 3.3% share (2025) Desalination plants, petrochemical build-outs
Total 100%

The Industrial Coatings Market spans five major regions, with Asia-Pacific maintaining clear dominance. Regional dynamics reflect divergent infrastructure cycles, regulatory environments, and industrial-output trajectories. Protective coating materials demand is most concentrated in economies with large heavy-industry and construction sectors.


North America

Country Key Metric Key Driver
United States 78.2% of regional share Infrastructure Law bridge and highway funding [9]
Canada 3.25% CAGR (2026–2035) Oil-sands pipeline maintenance [21]
Mexico USD 1.08 Billion (2025) Nearshoring-driven manufacturing expansion [22]


The United States drives the bulk of North American demand for epoxy industrial coatings and corrosion resistant coatings, with the Bipartisan Infrastructure Law injecting sustained funding into bridge recoating and water-treatment facility upgrades. Canada's oil-sands sector remains a steady consumer of heavy duty coatings for above-ground storage tanks, while Mexico's nearshoring wave is bringing new automotive and appliance plants that specify modern powder coating materials lines.

Europe

Country Key Metric Key Driver
Germany 24.6% of regional share Automotive OEM demand and Energiewende-related industrial retrofits [23]
United Kingdom 3.40% CAGR (2026–2035) Offshore wind expansion requiring high performance coatings [16]
France USD 1.14 Billion (2025) Nuclear plant maintenance and rail infrastructure [24]
Italy 11.8% of regional share Machinery and marine coating output [25]
Spain 3.30% CAGR (2026–2035) Renewable energy infrastructure build-out [16]
Nordic Countries USD 0.72 Billion (2025) Offshore platforms and shipbuilding [25]
Russia 7.5% of regional share Petrochemical and pipeline coatings [7]
Rest of Europe 3.15% CAGR (2026–2035) Eastern European manufacturing growth [17]


Europe's Industrial Coatings Market is shaped by the European Green Deal and IED revisions that effectively mandate water-borne or powder alternatives for most new installations. Germany's automotive OEMs are leading the transition to low-emission surface protection coatings, while the UK's offshore-wind pipeline—targeting 50 GW by 2030—creates substantial demand for marine-grade protective coating materials.

Asia-Pacific

Country Key Metric Key Driver
China 46.3% of regional share 15th Five-Year Plan transport and petrochemical investment [8]
India 5.10% CAGR (2026–2035) Gati Shakti highway and smart-city programs [8]
Japan USD 3.18 Billion (2025) Automotive refinish and electronics coating demand [25]
South Korea 8.4% of regional share Shipbuilding and semiconductor-fab expansion [25]
ASEAN 4.85% CAGR (2026–2035) Manufacturing FDI inflows and urbanization [20]
Rest of Asia-Pacific USD 1.45 Billion (2025) Mining and agricultural-equipment coatings [20]


Asia-Pacific's dominance in the Industrial Coatings Market rests on China's massive construction and manufacturing base, which alone consumes more industrial paint solutions than North America and Europe combined. India is the region's fastest-growing major economy for coatings, benefiting from government-led highway, port, and urban-transit projects that demand epoxy industrial coatings and metal protective coatings at scale.

South America

Country Key Metric Key Driver
Brazil 62.5% of regional share Pre-salt oil infrastructure and mining operations [22]
Argentina 3.70% CAGR (2026–2035) Vaca Muerta shale development pipeline coatings [22]
Rest of South America USD 0.31 Billion (2025) Copper and lithium mining equipment protection [20]


Brazil anchors South America's Industrial Coatings Market through heavy demand for corrosion resistant coatings in offshore oil platforms and mineral-processing facilities. Argentina's nascent shale-gas industry is driving new pipeline construction that requires specialty industrial paints rated for high-temperature, high-pressure service.

Middle East & Africa

Country Key Metric Key Driver
Saudi Arabia 32.8% of regional share Vision 2030 mega-projects and NEOM construction [20]
UAE 3.90% CAGR (2026–2035) Desalination and petrochemical plant expansion [20]
South Africa USD 0.22 Billion (2025) Mining and power-generation infrastructure [20]
Egypt 3.55% CAGR (2026–2035) Suez Canal Zone industrial development [20]
Rest of MEA 18.4% of regional share Oil-and-gas and water-treatment coatings [20]


The Middle East & Africa segment of the Industrial Coatings Market is propelled by Gulf Cooperation Council mega-projects and Africa's expanding extractive industries. Saudi Arabia's Vision 2030 program alone encompasses USD 1.3 trillion in planned infrastructure, generating sustained demand for heavy duty coatings and surface protection coatings in extreme-heat environments.


Industrial Coatings Market By Region, 2025-2035

Competitive Benchmarking

The Industrial Coatings Market exhibits medium concentration, with the top five players collectively holding an estimated 35–42% revenue share. The Herfindahl-Hirschman Index sits in the 600–900 range, indicating a moderately fragmented landscape where global majors coexist with strong regional formulators and specialty industrial paints producers[15].

Company Est. Revenue Share Range Key Offerings for Industrial Coatings Market Strategic Positioning
AkzoNobel N.V. ~8–11% International, Interpon powder, marine and protective lines Global full-spectrum coatings supplier with strong sustainability branding
PPG Industries ~7–10% Amercoat, PPG Envirocron, aerospace coatings Vertically integrated with leading aerospace and automotive OEM positions
Sherwin-Williams ~7–10% Macropoxy, Dura-Plate, Powdura powder coatings Broad distribution network; dominant in North American protective segment
Axalta Coating Systems ~4–6% Alesta powder, Imron polyurethane Focused on transportation and general-industrial finishing
RPM International ~3–5% Carboline, Tremco, Stonhard flooring coatings Niche leader in high-performance protective and flooring coatings
Nippon Paint Holdings ~5–8% NIPSEA industrial, Nippon Protective Coatings Asia-Pacific market leader with aggressive M&A strategy
Kansai Paint Co. ~3–5% Kansai Altan, Kansai Helios Strong position in automotive and industrial OEM coatings across APAC and Europe
Jotun A/S ~3–5% Jotamastic, Hardtop, Penguard Marine and protective coatings specialist with Middle East and APAC foothold
Hempel A/S ~2–4% Hempadur, Hempathane, Versiline Infrastructure and marine specialist with growing industrial portfolio
BASF Coatings ~3–5% Glasurit, R-M, BASF industrial powder Leveraging chemistry R&D scale for bio-based and functional coatings innovation


Recent News & Developments

  • AkzoNobel N.V. (July 2023), announced a new product called Interpon D Stone Effect, a powder coating. The substance is used for the conversion of metal surfaces for texture similar to natural stone.


  • PPG Industries (November 2024) The objective is to strengthen its distribution network and customer service in the Italian market. PPG firm has entered into a strategic partnership with SARO/Siccardi, the leading distribution of powder coatings in Italy. This partnership will broaden client access to PPG’s high-quality powder coatings


Industrial Coatings Market Report Scope

Parameter Detail
Market Scope Global Industrial Coatings Market by Resin Type, Technology, End-Use Industry, Substrate, and Geography
Study Period 2021–2035
CAGR (Forecast Period) 3.60% (2026–2035)
Base Year 2025 — USD 44.89 Billion
2026 Forecast USD 46.40 Billion
2035 Forecast USD 63.79 Billion
Fastest Growing Segment Water-Borne Technology (5.30% CAGR); Asia-Pacific (4.70% CAGR)
Companies Profiled AkzoNobel, PPG Industries, Sherwin-Williams, Axalta, RPM International, Nippon Paint, Kansai Paint, Jotun, Hempel, BASF Coatings
Valuation Currency USD Billion


FAQs

How do total-cost-of-ownership calculations differ between water-borne and solvent-borne industrial coatings systems?

Water-borne systems typically carry a 10–15% higher raw-material cost per liter but eliminate VOC-abatement equipment expenses, yielding 8–12% lower total lifecycle cost over a 10-year facility horizon [2]. Hazardous-waste disposal savings further widen the gap for the Industrial Coatings Market.

What qualification hurdles should procurement teams anticipate when switching to powder coating materials for metal substrates?

Switching requires ASTM B117 salt-spray testing (1,000–3,000 hours) and field-trial validation, typically spanning 12–18 months [18]. Early engagement with the Industrial Coatings Market supplier during the pilot phase shortens approval timelines.

Which emerging resin chemistries pose the greatest disruption risk to the Industrial Coatings Market over the next decade?

Bio-based epoxies from lignin and cashew-nut-shell liquid are approaching commercial scale, targeting 5–7% resin-mix penetration by 2035 [11]. Silicone-hybrid systems for extreme-temperature service also show strong potential.

How are smart-coating technologies changing maintenance economics in the Industrial Coatings Market?

Embedded micro-sensors and self-healing capsules can extend recoat intervals by 30–40%, reducing lifecycle maintenance costs on pipeline and bridge assets [12]. Adoption remains early-stage but is accelerating among infrastructure operators.

What insurance and liability considerations affect specification of corrosion resistant coatings on critical infrastructure?

Insurers increasingly require third-party coating-system certification (e.g., AMPP/SSPC QP-1) before underwriting infrastructure assets [18]. Non-compliant specifications can raise premiums by 5–10% for the Industrial Coatings Market end user.

How do anti-dumping tariffs on titanium dioxide affect pricing in the Industrial Coatings Market?

Anti-dumping duties of 15–30% on Chinese TiO₂ imports into the U.S. and EU have raised pigment costs 8–12% since 2023 [19]. Formulators are responding by increasing filler loadings and adopting hollow-sphere opacifiers.

What role does robotic application play in reducing waste and improving quality within the Industrial Coatings Market?

Robotic spray systems with machine-vision feedback cut overspray by 15–25% and improve film-thickness uniformity to ±3 microns [12]. These gains translate to measurable material savings for high performance coatings lines.    
Author
Author
Author Profile
Chitranshi Jaiswal LinkedIn
Team Lead - Research
Chitranshi is a Team Leader in the Chemicals & Materials (CnM) and Energy & Power (EnP) domains, with 6+ years of experience in market research. She leads and mentors teams to deliver cross-domain projects that equip clients with actionable insights and growth strategies. She is skilled in market estimation, forecasting, competitive benchmarking, and both primary & secondary research, enabling her to turn complex data into decision-ready insights. An engineer and MBA professional, she combines technical expertise with strategic acumen to solve dynamic market challenges. Chitranshi has successfully managed projects that support market entry, investment planning, and competitive positioning, while building strong client relationships. Certified in Advanced Excel & Power BI she leverages data-driven approaches to ensure accuracy, clarity, and impactful outcomes.

Research Approach


Secondary Research

The secondary research process involved comprehensive analysis of regulatory frameworks, industry standards, peer-reviewed materials science journals, chemical engineering publications, and authoritative industrial manufacturing organizations. Key sources included the US Environmental Protection Agency (EPA), European Chemicals Agency (ECHA) REACH Regulations, California Air Resources Board (CARB), South Coast Air Quality Management District (SCAQMD), China Ministry of Ecology and Environment, American Coatings Association (ACA), European Coil Coating Association (ECCA), British Coatings Federation (BCF), Japan Paint Manufacturers Association (JPMA), National Association of Corrosion Engineers (NACE International/AMPP), Society for Protective Coatings (SSPC), ASTM International (D16 Committee on Paint and Related Coatings), ISO Technical Committee 35 (Paints and Varnishes), US Census Bureau Construction Spending Database, Eurostat Manufacturing Statistics, United Nations Industrial Development Organization (UNIDO), Organisation for Economic Co-operation and Development (OECD) Industrial Production Index, International Organization of Motor Vehicle Manufacturers (OICA), and national statistics bureaus from key coating manufacturing hubs. These sources were used to collect production volume statistics, VOC emission regulation compliance data, resin price indices, automotive OEM coating specifications, marine classification society standards, raw material safety data sheets, and regional manufacturing capacity analysis for water-based, solvent-based, and powder coating technologies.


Primary Research

To gather both qualitative and quantitative information, the primary research process involved interviewing players from both the supply and demand sides. Executives from coating companies, resin suppliers, and additive producers served as supply-side sources, including CEOs, VPs of business development, chief tech officers, and worldwide regulatory heads. Directors of procurement from original equipment manufacturers (OEMs) in the automotive, marine, and industrial fleets as well as from railway authorities and asset maintenance managers in the oil and gas, power generation, and infrastructure industries made up the demand-side sources. Application technology uptake, VOC compliance costs, segment-specific pricing dynamics, and the validation of raw material pricing volatility and sustainable coating formulation pipelines were all achieved through primary research.

Primary Respondent Breakdown:

By Designation: C-level Primaries (28%), Director Level (32%), Others (40%)

By Region: Asia-Pacific (38%), North America (25%), Europe (30%), Rest of World (7%)


Market Size Estimation

Global market valuation was derived through production volume mapping and revenue analysis across the value chain. The methodology included:

Identification of 60+ key coating manufacturers and 40+ raw material suppliers across North America, Europe, Asia-Pacific, and Latin America

Product mapping across acrylic, epoxy, polyurethane, polyester, and fluoropolymer resin systems; solvent-based, water-based, and powder technologies; and end-use segments including automotive OEM, automotive refinish, general industrial, coil coatings, marine protective, and packaging coatings

Analysis of reported and modeled annual revenues specific to industrial coating portfolios, including trade data analysis for coating imports/exports by HS Code 3208 (paints and varnishes) and 3209 (based on synthetic polymers)

Coverage of manufacturers representing 75-80% of global market share in 2024

Extrapolation using bottom-up (surface area to be coated × coating thickness × density × price per liter by end-use industry and region) and top-down (manufacturer revenue validation adjusted for raw material cost pass-through) approaches to derive segment-specific valuations and technology penetration rates

The methodology accounts for volatile raw material costs (crude oil derivatives, titanium dioxide, epoxy resins), stringent environmental regulations driving water-based and powder coating adoption, and regional manufacturing shifts in automotive and industrial production hubs.

Download Free Sample

Kindly complete the form below to receive a free sample of this Report

Download PDF ×

We do not share your information with anyone. However, we may send you emails based on your report interest from time to time. You may contact us at any time to opt-out.