Infrastructure Construction Market (2026 - 2035)

Infrastructure Construction Market Research Report Information By Type (Energy Construction and Utilities Infrastructure Construction), By Application (Civil Use and Military Use), And By Region (North America, Europe, Asia-Pacific, And Rest of The World) –Market Forecast Till 2035.
ID: MRFR/PCM/14609-HCR
128 Pages
Snehal Singh
Last Updated: June 29, 2026
Infrastructure Construction Market
Market Size
Forecast Period2026-2035
CAGR (2026-2035)6.72%
2025 Market SizeUSD 4.05 Trillion
2035 Market SizeUSD 7.76 Trillion
Key Players
VINCI SA
ACS Group
China State Construction Engineering
Bouygues Construction
Bechtel Corporation
Skanska AB
Opportunities
  • Modular and Prefabricated Construction
  • Data Monetization Through Digital Twins
  • Climate-Resilience Retrofitting

Infrastructure Construction Market Summary

The Infrastructure Construction Market reached an estimated USD 4.05 trillion in 2025 and is projected to grow from USD 4.32 trillion in 2026 to USD 7.76 trillion by 2035, registering a CAGR of 6.72% across the forecast window. This expansion is anchored in multi-year fiscal commitments—the U.S. Infrastructure Investment and Jobs Act alone channels over USD 550 billion into roads, bridges, and broadband through 2030, while the European Union's REPowerEU plan redirects roughly EUR 300 billion toward energy and transport resilience [1][2]. These spending programs signal a structural shift from deferred maintenance to planned capital deployment.

The market for infrastructure construction is going through a generational shift in technology. Drone-based site surveys, AI-driven scheduling systems, and building information modeling are replacing analog project management and paper-based permitting. forecasts that full-scale digitization might result in yearly savings of USD 1.6 trillion for the building industry worldwide [3]. Governments now require BIM in more than 40 nations for publicly funded projects that surpass predetermined thresholds. This has accelerated adoption curves and shortened delivery timeframes for water treatment plants, rail routes, and bridges.

Due to India's National Infrastructure Pipeline and China's ongoing urbanization drive, the Asia-Pacific accounts for about 42.1% of the infrastructure construction market. With a 7.93% CAGR, the Middle East and Africa region is the fastest-growing geography as sovereign wealth funds in Saudi Arabia and the United Arab Emirates invest in massive projects. Thanks to improvements made to the EU's Trans-European Transport Network, Europe has the second-largest share at roughly 22.8%. Businesses that can combine digital delivery with climate-adaptive design will be rewarded in the coming ten years.


Key Report Takeaways

• By Infrastructure Segment

  • Transportation held a 34.0% revenue share of the Infrastructure Construction Market in 2025, reflecting sustained rail and highway expenditure.
  • Utilities are projected to expand at a 7.15% CAGR through 2035 as grid modernization accelerates globally.
  • Social infrastructure—hospitals, schools, and civic buildings—accounted for roughly USD 972 billion in 2025.

• By Construction Type

  • New construction captured a 68.1% share of the Infrastructure Construction Market in 2025.
  • Renovation activity is forecast to record the highest segment CAGR of 6.46% over 2026–2035.

• By Investment Source

  • Public funding represented 56.3% of the Infrastructure Construction Market in 2025.
  • Private capital is forecast to grow at a 6.63% CAGR as availability-payment concession models gain traction.

• By Region

  • Asia-Pacific accounted for a 42.1% share in 2025, led by China, India, and Japan.
  • The Middle East & Africa region is predicted to expand at the fastest CAGR of 7.93% through 2035.


Market Size and Forecast (2021–2035)

Market Research Future derives its sizing estimates through a triangulated methodology combining top-down macroeconomic modeling, bottom-up project pipeline analysis across 60+ countries, and validation against public procurement databases and annual reports of leading contractors.
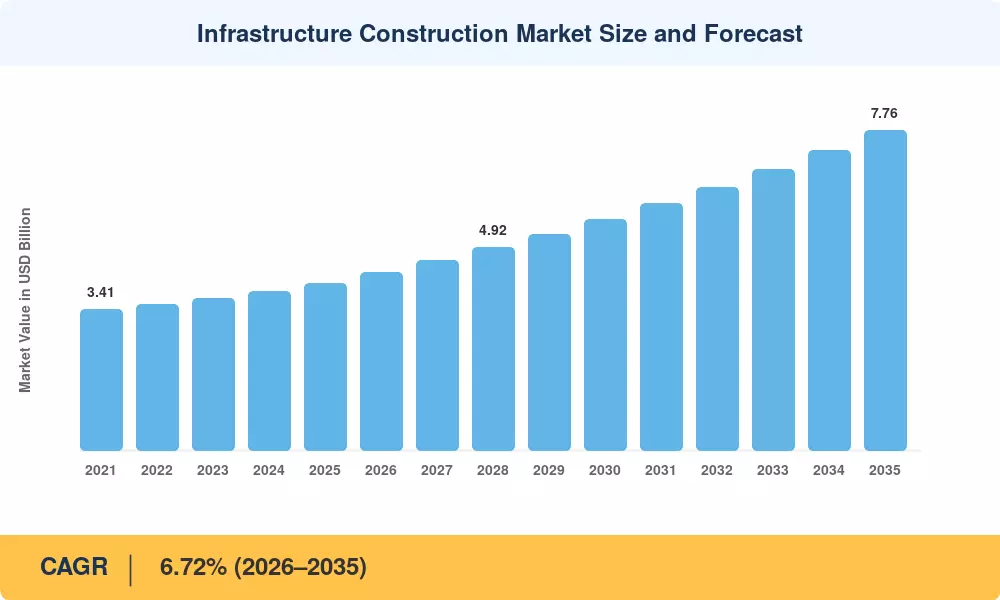
Infrastructure Construction Market Size and Forecast
Our Impact
Enabled $4.3B Revenue Impact for Fortune 500 and Leading Multinationals
Partnering with 2000+ Global Organizations Each Year
30K+ Citations by Top-Tier Firms in the Industry

Driver Impact Analysis

Driver ~% Impact on CAGR Geographic Relevance Impact Timeline
Government fiscal stimulus packages +1.8% Global Short-term (≤2 yr)
Grid modernization and renewable integration +1.2% North America, Europe Medium-term (2–4 yr)
Urbanization in emerging economies +1.0% Asia-Pacific, Africa Long-term (≥4 yr)
Electrified transport corridor expansion +0.8% Europe, Asia-Pacific Medium-term (2–4 yr)
Digital construction adoption (BIM, AI, drones) +0.7% Global Medium-term (2–4 yr)
Private concession and PPP models +0.5% Middle East, South America Long-term (≥4 yr)
Climate-adaptation mandates +0.4% North America, Europe Long-term (≥4 yr)


Government Fiscal Stimulus Packages

Sovereign spending remains a core catalyst for infrastructure construction. The U.S. Federal Highway Administration confirms the Bipartisan Infrastructure Law directs USD 550 billion in new spending through 2026. Simultaneously, India’s Ministry of Finance expanded public capital expenditure to INR 12.2 trillion for the fiscal year 2026-27, driving vast, bankable construction pipelines worldwide.


Grid Modernization and Renewable Integration

Aging utility networks require massive structural rebuilding to integrate clean power. The International Energy Agency (IEA) Electricity 2026 report states that surging electricity demand requires annual global investments in grids to rise by 50% by 2030. This wave of construction covers substation upgrades, high-voltage direct current links, and utility-scale battery storage installations.


Urbanization in Emerging Economies

Rapid demographic shifts necessitate heavy civic infrastructure development. Data from the United Nations Department of Economic and Social Affairs projects that global urbanization will add 2.5 billion more residents to cities by 2050. Because 90% of this growth is concentrated in Asia and Africa, developing nations are rapidly constructing transit, wastewater, and airport facilities.


Electrified Transport Corridor Expansion

Decarbonization policies make transport the largest segment in the infrastructure market. The European Commission's TEN-T regulation mandates the electrification of core rail lines by 2030, while China's National Railway Administration reports its high-speed rail network exceeds 45,000 km. These massive state-led expansions solidify long-term civil engineering and corridor construction pipelines globally.


Restraints Impact Analysis

Restraint ~% Impact on CAGR Geographic Relevance Impact Timeline
Skilled labor shortages –0.9% Global Short-term (≤2 yr)
Raw material price volatility –0.7% Global Medium-term (2–4 yr)
Permitting and regulatory delays –0.5% North America, Europe Long-term (≥4 yr)
Rising interest rates and financing costs –0.4% Global Short-term (≤2 yr)
Geopolitical supply-chain disruptions –0.3% Europe, Asia-Pacific Medium-term (2–4 yr)


Skilled Labor Shortages

Structural workforce deficits increasingly restrict sector capacity. The U.S. Bureau of Labor Statistics reported that unfilled domestic construction job openings reached 259,000 by April 2026, marking a 25% year-over-year surge. This structural labor tightness elevates project execution risks, delays complex megaproject timelines, and inflates overall baseline execution costs across the global infrastructure construction market.


Raw Material Price Volatility

Unpredictable procurement costs create severe margin pressures for fixed-price contracts. Industrial data from the U.S. Bureau of Labor Statistics highlights that key infrastructure inputs—including concrete, structural steel, and copper—experienced significant localized price fluctuations exceeding 20% post-pandemic. Ongoing supply chain adjustments continue to trigger cost overruns, hindering stable procurement cycles worldwide.


Permitting and Regulatory Delays

Extensive compliance timelines slow down public capital deployment and project velocity. Documentation from the U.S. Government Accountability Office reveals that major environmental impact statements for large-scale transportation and highway projects frequently require over four years of federal review. These extended regulatory bottlenecks delay actual field construction and significantly reduce immediate pipeline spending velocity globally.


Infrastructure Construction Market Opportunities

Modular and Prefabricated Construction

Off-site manufacturing of structural modules significantly accelerates public works deployment. Documentation from Singapore’s Building and Construction Authority confirms that pre-fabricated pre-finished volumetric construction cuts project timelines by up to 50%. Standardizing these factory-built components reduces on-site labor requirements, opening a highly profitable, incentive-backed manufacturing segment within the broader infrastructure construction market.


Data Monetization Through Digital Twins

Asset owners are creating long-term revenue streams by pairing physical builds with digital counterparts. Technical guidelines from the International Telecommunication Union (ITU) explain that deploying urban digital twins allows municipal authorities to analyze real-time data continuously. Selling these traffic-flow and utility analytics to private operators transforms traditional physical assets into continuous, software-driven revenue engines.


Climate-Resilience Retrofitting

Escalating weather events require a major shift toward structural adaptation. According to the United Nations Environment Programme (UNEP) status reports, approximately half of the global urban buildings expected to exist by 2050 are yet to be built or renovated. This creates a massive renovation-led pipeline for retrofitting flood barriers, heat-resistant materials, and seismic bracing.


African Continental Free Trade Area Corridors

Intra-continental trade pacts are driving an expansion of cross-border transport infrastructure. The African Development Bank reports that it has invested over USD 55 billion in regional economic corridors, including USD 8 billion specifically targeting 109 cross-border projects. These ongoing investments to connect the USD 3.4 trillion single market present huge order books for civil contractors.


Green Bond Financing

The growth of sustainable capital markets directly lowers upfront financing hurdles for low-carbon projects. The United Nations "Financing for Sustainable Development Report 2026" highlights that while an annual USD 4 trillion SDG financing gap remains, the rapid scaling of green and sustainability-linked bonds gives certified zero-emission transit hubs and clean energy grids direct access to cheaper capital.


Infrastructure Construction Market Future Outlook

Autonomous and Robotics-Enhanced Construction

Advanced automation is transforming field operations to improve worker well-being. A formal International Labour Organization (ILO) report notes that heavy automation effectively replaces personnel in hazardous "3D" jobs. This technological integration is driving the commercial adoption of automated earthmoving fleets and robotic systems, safely mitigating long-term operational risks across the global infrastructure construction market.


Platform Economics and Digital Procurement

State-led transitions to virtual tender ecosystems are optimizing public procurement cycles. Comprehensive data from the United Nations Department of Economic and Social Affairs reveals that total public procurement spending averages between 13% and 20% of global gross domestic product. Modernizing these trillions via unified digital government platforms speeds up capital deployment workflows immensely.


Electrification Supercycle

Net-zero infrastructure mandates require immense, structural grid and charging investments worldwide. The International Energy Agency (IEA) World Energy Investment 2026 report highlights that global electricity-related spending is surging to USD 1.6 trillion this year alone. This massive funding establishes a policy-insured demand layer for civil engineering, grid interconnectors, and utility-scale energy storage pipelines.


ESG Disclosure and Sustainable Materials

Tightening regulatory climate frameworks are forcing contractors toward certified low-carbon building systems. The United Nations Environment Programme (UNEP) Global Status Report indicates that green building certifications have nearly tripled over the past decade. This rapid structural shift forces the baseline integration of alternative cements and recycled steel throughout the infrastructure construction market.


Infrastructure Construction Market Segmentation

By Infrastructure Segment

Segment Metric Primary Demand Driver
Transportation 34.0% share (2025) Rail electrification and highway rehabilitation
Utilities 7.15% CAGR Renewable grid integration and water treatment
Social USD 972 billion (2025) Hospital and education facility expansion
Extraction 5.48% CAGR Mining and oil & gas site development


Transportation remains the dominant segment of the Infrastructure Construction Market, driven by sustained government allocation to road, rail, port, and airport builds. China, the United States, and India collectively account for over 55% of global transport-linked construction spending. Electrified rail corridors are the fastest-growing sub-category within this segment, as governments seek to decarbonize freight movement and reduce highway congestion [11].

Utilities represent the second-largest segment. Aging power grids in North America and Europe require replacement at a pace that outstrips historical investment levels. The IEA projects that annual grid spending must roughly double from 2023 levels to support the renewable capacity additions planned through 2035 [2]. Water and wastewater treatment plants add a parallel demand stream, particularly across Southeast Asia and Sub-Saharan Africa.

By Construction Type

Segment Metric Primary Demand Driver
New Construction 68.1% share (2025) Greenfield project pipelines in emerging economies
Renovation 6.46% CAGR Climate-resilience retrofitting and code upgrades


New construction dominates the Infrastructure Construction Market because emerging-economy urbanization generates large-scale greenfield demand. Renovation, while smaller in absolute terms, is growing at a faster rate as OECD governments prioritize life-extension programs for bridges, tunnels, and dams built in the mid-20th century.

By Investment Source

Segment Metric Primary Demand Driver
Public 56.3% share (2025) Sovereign fiscal packages and multilateral lending
Private 6.63% CAGR PPP concessions and infrastructure funds


Public funding underpins the majority of the Infrastructure Construction Market, reflecting the essential-service nature of roads, bridges, and water systems. Private capital's share is growing as institutional investors—pension funds, sovereign wealth funds, and infrastructure-focused private equity—seek inflation-linked, long-duration assets through availability-payment concession models [17].


Regional Market Share Analysis

Region Metric Primary Investment Themes
Asia-Pacific 42.1% share (2025) High-speed rail, urban metro systems and water treatment
Europe 22.8% share (2025) TEN-T corridors, grid upgrades, green renovation
North America 19.4% share (2025) Highway rehabilitation, broadband, grid hardening
Middle East & Africa 7.93% CAGR (2026–2035) Giga-projects, AfCFTA corridors, desalination
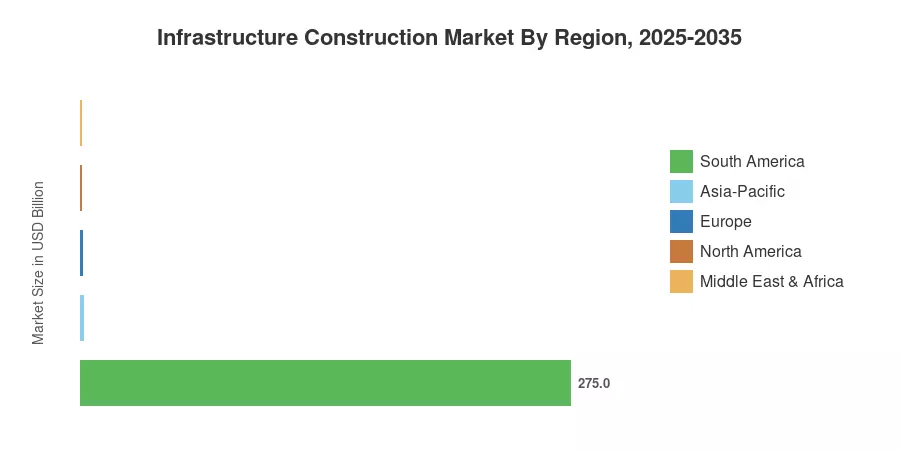
South America USD 275 billion (2025) Port modernization, urban transit, hydropower
Total USD 4.05 Trillion (2025)

The Infrastructure Construction Market displays a multi-polar regional structure, with Asia-Pacific commanding the largest share and the Middle East & Africa delivering the fastest expansion rate.


North America

Country Metric Key Driver
United States 78.4% of regional share Bipartisan Infrastructure Law spending
Canada 13.2% of regional share Transit Fund and housing-linked builds
Mexico 8.4% of regional share Nearshoring corridor development


The Infrastructure Construction Market in North America benefits from multi-year federal authorization cycles that provide contractor visibility. The CHIPS and Science Act supplements traditional infrastructure bills by funding semiconductor fabrication campus utilities, while Canada's National Trade Corridors Fund accelerates port and highway capacity projects [1][22].

Europe

Country Metric Key Driver
Germany 6.21% CAGR Autobahn renewal and rail electrification
United Kingdom USD 178 billion (2025) HS2 and Northern Powerhouse Rail
France 14.8% of regional share Grand Paris Express metro expansion
Italy 5.95% CAGR NRRP-funded bridge and tunnel upgrades
Spain USD 62 billion (2025) High-speed AVE extensions
Nordic Countries 6.48% CAGR Arctic transport links and offshore grid
Russia 8.9% of regional share Eastern rail corridor development
Rest of Europe USD 105 billion (2025) EU cohesion fund recipients


European activity in the Infrastructure Construction Market is shaped by the EU's binding climate targets, which require member states to allocate at least 37% of Recovery and Resilience Facility funds to green objectives. The Trans-European Transport Network revision adopted in 2024 sets 2040 completion deadlines for core corridors, compelling frontloaded investment [2][11].

Asia-Pacific

Country Metric Key Driver
China 48.2% of regional share Belt and Road domestic feeder networks
India 7.85% CAGR National Infrastructure Pipeline
Japan USD 198 billion (2025) Seismic resilience and maglev rail
South Korea 5.8% of regional share New town smart-city builds
ASEAN 7.42% CAGR Metro Manila, Jakarta MRT, Vietnam expressways
Rest of Asia-Pacific USD 89 billion (2025) Bangladesh, Sri Lanka transit projects


The Infrastructure Construction Market in Asia-Pacific is propelled by the largest concentration of greenfield project activity globally. China's 14th Five-Year Plan channels CNY 10.2 trillion into transport and water, while India targets 25,000 km of new highway construction annually through 2030 [9][23].

South America

Country Metric Key Driver
Brazil 58.3% of regional share PAC accelerated growth program
Argentina 5.52% CAGR Vaca Muerta pipeline and road links
Rest of South America USD 52 billion (2025) Chile metro, Colombia 4G toll roads


Brazil's Programa de Aceleração do Crescimento (PAC) earmarks BRL 1.7 trillion for roads, sanitation, and energy through 2030, making it the anchor of the Infrastructure Construction Market in South America [24].

Middle East & Africa

Country Metric Key Driver
Saudi Arabia 38.5% of regional share NEOM and Vision 2030 giga-projects
UAE USD 48 billion (2025) Expo legacy districts, Etihad Rail
South Africa 5.81% CAGR Renewable energy grid connections
Egypt 7.15% CAGR New Administrative Capital and Suez upgrades
Rest of MEA USD 67 billion (2025) East African rail, West African ports


Saudi Arabia's Public Investment Fund has committed over USD 3.5 trillion in total project value under Vision 2030, making the Kingdom the largest single-country growth engine for the Infrastructure Construction Market in this region [10].


Infrastructure Construction Market By Region, 2025-2035

Competitive Benchmarking

The Infrastructure Construction Market exhibits low market concentration, with the top five firms collectively holding an estimated 8–12% of global revenue. Fragmentation is structural: project delivery is inherently localized, and domestic licensing and labor regulations create barriers to cross-border consolidation. The Herfindahl-Hirschman Index for the market sits below 200, indicating a highly competitive field with thousands of active contractors.

Company Est. Revenue Share Range Key Offerings Strategic Positioning
VINCI SA ~2.5–3.5% Concessions, road and rail construction, energy networks Vertically integrated concession-contractor model
ACS Group ~2.0–3.0% Highways, airports and PPP management Global reach via Hochtief and Turner subsidiaries
China State Construction Engineering (CSCEC) ~2.0–3.0% Mega-project delivery, housing, transit State-backed scale advantage in domestic and BRI markets
Bouygues Construction ~1.5–2.5% Civil works, rail and public buildings Strong European and African presence
Bechtel Corporation ~1.5–2.5% Mega-project EPC, LNG, rail, airports Private ownership enables long-cycle project commitments
Skanska AB ~1.0–2.0% Green building, highway, bridge construction Sustainability leadership in Nordic and U.S. markets
Fluor Corporation ~1.0–1.5% EPC services, government infrastructure Defense and federal infrastructure specialization
AECOM ~1.0–1.5% Program management, design-build advisory Asset-light advisory model post-divestiture
Strabag SE ~0.8–1.5% Tunneling, road, and rail construction Central and Eastern European market leader
Larsen & Toubro ~1.0–2.0% Heavy civil, hydrocarbon, power infrastructure Dominant Indian contractor with Middle East expansion


Recent News & Developments

Vinci SA (January 2026)—Announced a major push into hybrid infrastructure, focusing heavily on decarbonized transportation systems, digitized utility networks, and long-term asset value-creation strategies.

California High-Speed Rail Authority (June, 2026)—Executed a co-development agreement with Momentum Alliance Partners to accelerate the expansion of its multi-billion-dollar high-speed rail corridor project.


  • Arup, Jacobs, and CDPQ Infra (June, 2026)—Formed a strategic public-private partnership consortium to deliver and commercialize extensive new segments of high-speed rail transit infrastructure.


Infrastructure Construction Market Report Scope

Item Detail
Market Scope Global Infrastructure Construction Market covering transportation, utilities, social, and extraction segments
Study Period 2021–2035
CAGR 6.72% (2026–2035)
Base Year Value USD 4.05 Trillion (2025)
Forecast Endpoint USD 7.76 Trillion (2035)
Fastest Growing Segment Renovation (by construction type); Middle East & Africa (by geography)
Companies Profiled 10 (VINCI, ACS, CSCEC, Bouygues, Bechtel, Skanska, Fluor, AECOM, Strabag, Larsen & Toubro)
Valuation Currency USD (constant 2025 dollars)


FAQs

How do availability-payment concessions differ from traditional toll-based PPPs for infrastructure investors?
Availability-payment models guarantee fixed periodic payments from the government regardless of traffic volume, shifting demand risk away from the private partner. This structure appeals to pension funds and insurers seeking stable, inflation-linked returns [17].
Which construction materials face the greatest supply-chain risk through 2030?
Copper and green steel are the most constrained inputs, driven by electrification demand and decarbonization mandates, respectively. Contractors are increasingly locking in long-term offtake agreements to hedge price volatility [21].
How does BIM adoption affect project delivery timelines in the Infrastructure Construction Market?
Mandatory BIM implementation has reduced design-phase rework by 25–35% on average across UK and Singaporean public projects. The resulting schedule compression shortens overall delivery by 10–15% [3].
What role do multilateral development banks play in financing the Infrastructure Construction Market?
The World Bank, Asian Development Bank, and AfDB collectively disburse USD 80–100 billion annually in infrastructure lending. These institutions also de-risk private co-investment through partial credit guarantees [5][14].
How are contractors addressing Scope 3 emissions in the Infrastructure Construction Market?
Leading firms now require Environmental Product Declarations from material suppliers and embed carbon budgets into tender specifications. VINCI and Skanska have published Scope 3 reduction roadmaps tied to Science Based Targets [15].
What insurance products are emerging for climate-exposed infrastructure assets?
Parametric insurance policies triggered by predefined weather thresholds—wind speed, rainfall volume, seismic magnitude—are gaining traction. These products offer faster payouts than traditional indemnity coverage, reducing post-disaster reconstruction delays [20].
How does the Infrastructure Construction Market differ from the broader building construction sector?
This market covers publicly accessible assets—roads, bridges, utilities, and civic facilities—rather than residential or commercial buildings. Public funding dominates, and project scales are typically larger with longer delivery timelines [8].    
Author
Author
Author Profile
Snehal Singh LinkedIn
Manager - Research
High acumen in analyzing complex macro & micro markets with more than 6 years of work experience in the field of market research. By implementing her analytical skills in forecasting and estimation into market research reports, she has expertise in Packaging, Construction, and Equipment domains. She handles a team size of 20-25 resources and ensures smooth running of the projects, associated marketing activities, and client servicing.

Research Approach


Secondary Research

The secondary research process involved a comprehensive analysis of regulatory databases, peer-reviewed engineering and construction journals, industry publications, and authoritative infrastructure organizations. Key sources included the US Department of Transportation (DOT), Federal Highway Administration (FHWA), US Army Corps of Engineers, European Commission Directorate-General for Regional and Urban Policy (DG REGIO), European Investment Bank (EIB), World Bank Infrastructure Finance Database, Asian Development Bank (ADB) Infrastructure Statistics, International Energy Agency (IEA), International Renewable Energy Agency (IRENA), US Energy Information Administration (EIA), Organisation for Economic Co-operation and Development (OECD) Infrastructure Statistics, International Labour Organization (ILO) Construction Employment Data, Global Infrastructure Hub (GI Hub), National Association of State Budget Officers (NASBO), US Bureau of Transportation Statistics (BTS), Eurostat Construction Statistics, China National Bureau of Statistics (NBS), India Ministry of Statistics and Programme Implementation (MOSPI), Japan Ministry of Land, Infrastructure, Transport and Tourism (MLIT), UK Office for National Statistics (ONS) Construction Output, and national infrastructure ministry reports from key markets. These sources were used to collect construction spending statistics, public procurement data, regulatory policy frameworks, infrastructure project pipelines, demographic and urbanization trends, and market landscape analysis for energy construction, utilities infrastructure construction, civil use, and military use segments.


Primary Research

Qualitative and quantitative insights were obtained by interviewing supply-side and demand-side stakeholders during the primary research process. CEOs, VPs of Business Development, leaders of infrastructure project bidding, and commercial directors from general contracting firms, engineering procurement and construction (EPC) companies, infrastructure developers, and heavy equipment OEMs comprised supply-side sources. Government infrastructure planning officers, public works department directors, ministry of defense procurement leads, utility board commissioners, municipal urban planning authorities, and procurement heads from state-owned enterprises and public-private partnership (PPP) agencies comprised demand-side sources. The primary research validated market segmentation, confirmed project pipeline timelines, and collected insights on contract award patterns, tendering strategies, government budget allocation dynamics, and public-private financing structures.

Primary Respondent Breakdown:

By Designation: C-level Primaries (32%), Director Level (30%), Others (38%)

By Region: North America (32%), Europe (30%), Asia-Pacific (28%), Rest of World (10%)


Market Size Estimation

Global market valuation was derived through revenue mapping and project volume analysis. The methodology included:

Identification of 50+ key infrastructure construction contractors and developers across North America, Europe, Asia-Pacific, Latin America, and the Middle East & Africa

Product mapping across energy construction (renewable power plants, fossil fuel facilities, grid infrastructure) and utilities infrastructure construction (water management, telecommunications, smart grids, waste management)

Analysis of reported and modeled annual revenues specific to infrastructure construction portfolios

Coverage of contractors and developers representing 70–75% of the global market share in 2024

Extrapolation using bottom-up (project volume × average contract value by country) and top-down (contractor revenue validation) approaches to derive segment-specific valuations

Download Free Sample

Kindly complete the form below to receive a free sample of this Report

Download PDF ×

We do not share your information with anyone. However, we may send you emails based on your report interest from time to time. You may contact us at any time to opt-out.
















