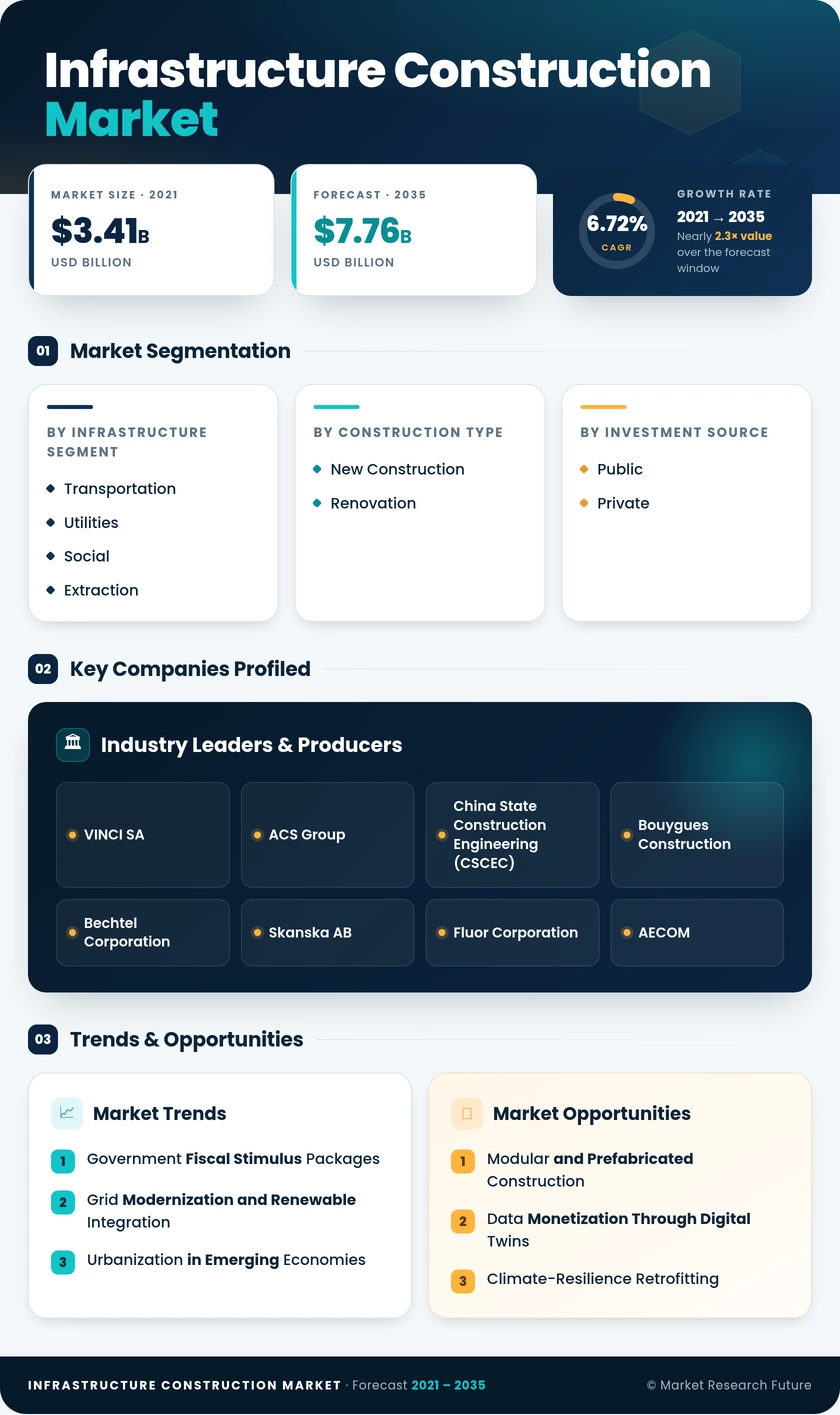
Infrastructure Construction Market (2026 - 2035)

ID: MRFR/PCM/14609-HCR
128 Pages
Snehal Singh
Last Updated: June 29, 2026
Infrastructure Construction Market Research Report Information By Type (Energy Construction and Utilities Infrastructure Construction), By Application (Civil Use and Military Use), And By Region (North America, Europe, Asia-Pacific, And Rest of The World) –Market Forecast Till 2035.
Infrastructure Construction Market
Market Size
Forecast Period2026-2035
CAGR (2026-2035)6.72%
2025 Market SizeUSD 4.05 Trillion
2035 Market SizeUSD 7.76 Trillion
Key Players
VINCI SA
ACS Group
China State Construction Engineering
Bouygues Construction
Bechtel Corporation
Skanska AB
Opportunities
  • Modular and Prefabricated Construction
  • Data Monetization Through Digital Twins
  • Climate-Resilience Retrofitting
  1. 1 Market Overview |
    1. 1.1 Study Assumptions & Market Definition |
    2. 1.2 Scope of the Study |
    3. 1.3 Research Methodology
  2. 2 Market Summary & Key Takeaways
  3. 3 Market Dynamics |
    1. 3.1 Market Drivers Analysis | |
      1. 3.1.1 Government Fiscal Stimulus Packages | |
      2. 3.1.2 Grid Modernization and Renewable Integration | |
      3. 3.1.3 Urbanization in Emerging Economies | |
      4. 3.1.4 Electrified Transport Corridor Expansion | |
      5. 3.1.5 Digital Construction Adoption (BIM, AI, Drones) | |
      6. 3.1.6 Private Concession and PPP Models | |
      7. 3.1.7 Climate-Adaptation Mandates |
    2. 3.2 Market Restraints Analysis | |
      1. 3.2.1 Skilled Labor Shortages | |
      2. 3.2.2 Raw Material Price Volatility | |
      3. 3.2.3 Permitting and Regulatory Delays | |
      4. 3.2.4 Rising Interest Rates and Financing Costs | |
      5. 3.2.5 Geopolitical Supply-Chain Disruptions |
    3. 3.3 Market Opportunity Analysis | |
      1. 3.3.1 Modular and Prefabricated Construction | |
      2. 3.3.2 Data Monetization Through Digital Twins | |
      3. 3.3.3 Climate-Resilience Retrofitting | |
      4. 3.3.4 African Continental Free Trade Area Corridors | |
      5. 3.3.5 Green Bond Financing |
    4. 3.4 Industry Value Chain Analysis |
    5. 3.5 Porter's Five Forces Analysis
  4. 4 Global Infrastructure Construction Market Size & Forecast (2021–2035) |
    1. 4.1 Historical Market Size (2021–2025) |
    2. 4.2 Current & Forecast Market Size (2026–2035) |
    3. 4.3 Market Size by Revenue (USD Trillion) |
    4. 4.4 Year-over-Year Growth Analysis
  5. 5 Segmentation Analysis |
    1. 5.1 By Infrastructure Segment | |
      1. 5.1.1 Transportation | |
      2. 5.1.2 Utilities | |
      3. 5.1.3 Social | |
      4. 5.1.4 Extraction |
    2. 5.2 By Construction Type | |
      1. 5.2.1 New Construction | |
      2. 5.2.2 Renovation |
    3. 5.3 By Investment Source | |
      1. 5.3.1 Public | |
      2. 5.3.2 Private
  6. 6 Regional Analysis |
    1. 6.1 North America | |
      1. 6.1.1 United States | |
      2. 6.1.2 Canada | |
      3. 6.1.3 Mexico |
    2. 6.2 Europe | |
      1. 6.2.1 Germany | |
      2. 6.2.2 United Kingdom | |
      3. 6.2.3 France | |
      4. 6.2.4 Italy | |
      5. 6.2.5 Spain | |
      6. 6.2.6 Nordic Countries | |
      7. 6.2.7 Russia | |
      8. 6.2.8 Rest of Europe |
    3. 6.3 Asia-Pacific | |
      1. 6.3.1 China | |
      2. 6.3.2 India | |
      3. 6.3.3 Japan | |
      4. 6.3.4 South Korea | |
      5. 6.3.5 ASEAN | |
      6. 6.3.6 Rest of Asia-Pacific |
    4. 6.4 South America | |
      1. 6.4.1 Brazil | |
      2. 6.4.2 Argentina | |
      3. 6.4.3 Rest of South America |
    5. 6.5 Middle East & Africa | |
      1. 6.5.1 Saudi Arabia | |
      2. 6.5.2 UAE | |
      3. 6.5.3 South Africa | |
      4. 6.5.4 Egypt | |
      5. 6.5.5 Rest of MEA
  7. 7 Competitive Landscape |
    1. 7.1 Market Share Analysis (2025) |
    2. 7.2 Competitive Benchmarking Matrix |
    3. 7.3 Company Profiles | |
      1. 7.3.1 VINCI SA | |
      2. 7.3.2 ACS Group | |
      3. 7.3.3 China State Construction Engineering (CSCEC) | |
      4. 7.3.4 Bouygues Construction | |
      5. 7.3.5 Bechtel Corporation | |
      6. 7.3.6 Skanska AB | |
      7. 7.3.7 Fluor Corporation | |
      8. 7.3.8 AECOM | |
      9. 7.3.9 Strabag SE | |
      10. 7.3.10 Larsen & Toubro
  8. 8 Future Outlook & Strategic Recommendations (2026–2035) |
    1. 8.1 Autonomous and Robotics-Enhanced Construction |
    2. 8.2 Platform Economics and Digital Procurement |
    3. 8.3 Electrification Supercycle |
    4. 8.4 ESG Disclosure and Sustainable Materials
  9. 9 Recent Developments & News
  10. 10 Frequently Asked Questions (FAQs)
  11. 11 Report Scope & Methodology |
    1. 11.1 Study Period & Base Year |
    2. 11.2 Data Sources & Citations |
    3. 11.3 Abbreviations
  12. 12 LIST OF TABLES |
  13. TABLE 1 Global Infrastructure Construction Market Size & Forecast, by Revenue (USD Trillion), 2021–2035 |
  14. TABLE 2 Global Infrastructure Construction Market – Year-over-Year Growth Analysis, 2021–2035 |
  15. TABLE 3 Global Infrastructure Construction Market – Driver Impact Analysis |
  16. TABLE 4 Global Infrastructure Construction Market – Restraint Impact Analysis |
  17. TABLE 5 Global Infrastructure Construction Market Size, by Infrastructure Segment, 2021–2035 |
  18. TABLE 6 Global Infrastructure Construction Market Size, by Construction Type, 2021–2035 |
  19. TABLE 7 Global Infrastructure Construction Market Size, by Investment Source, 2021–2035 |
  20. TABLE 8 Global Infrastructure Construction Market Size, by Region, 2021–2035 |
  21. TABLE 9 North America Infrastructure Construction Market Size, by Country, 2021–2035 |
  22. TABLE 10 Europe Infrastructure Construction Market Size, by Country, 2021–2035 |
  23. TABLE 11 Asia-Pacific Infrastructure Construction Market Size, by Country, 2021–2035 |
  24. TABLE 12 South America Infrastructure Construction Market Size, by Country, 2021–2035 |
  25. TABLE 13 Middle East & Africa Infrastructure Construction Market Size, by Country, 2021–2035 |
  26. TABLE 14 Competitive Benchmarking Matrix – Global Infrastructure Construction Market, 2025 |
  27. TABLE 15 Company Profiles – Key Players, Global Infrastructure Construction Market |
  28. TABLE 16 Recent Developments & Strategic Announcements, 2023–2025 |
  29. TABLE 17 Report Scope & Methodology Summary |
  30. TABLE 18 Detailed Sources and Citations
  31. 13 LIST OF FIGURES |
  32. FIGURE 1 Global Infrastructure Construction Market Dynamics (Drivers, Restraints, Opportunities) |
  33. FIGURE 2 Industry Value Chain Analysis – Infrastructure Construction Market |
  34. FIGURE 3 Porter's Five Forces Analysis – Infrastructure Construction Market |
  35. FIGURE 4 Global Infrastructure Construction Market Size Trend, 2021–2035 (USD Trillion) |
  36. FIGURE 5 Infrastructure Construction Market Share, by Infrastructure Segment, 2025 (%) |
  37. FIGURE 6 Infrastructure Construction Market Share, by Construction Type, 2025 (%) |
  38. FIGURE 7 Infrastructure Construction Market Share, by Investment Source, 2025 (%) |
  39. FIGURE 8 Infrastructure Construction Market Share, by Region, 2025 (%) |
  40. FIGURE 9 North America Infrastructure Construction Market Share, by Country, 2025 (%) |
  41. FIGURE 10 Europe Infrastructure Construction Market Share, by Country, 2025 (%) |
  42. FIGURE 11 Asia-Pacific Infrastructure Construction Market Share, by Country, 2025 (%) |
  43. FIGURE 12 South America Infrastructure Construction Market Share, by Country, 2025 (%) |
  44. FIGURE 13 Middle East & Africa Infrastructure Construction Market Share, by Country, 2025 (%) |
  45. FIGURE 14 Competitive Landscape – Market Share of Top 10 Players, 2025 (%)

SEGMENTATION QUICK REFERENCE

DimensionSub-SegmentsDominant SegmentFastest Growing Segment
By Infrastructure SegmentTransportation, Utilities, Social, ExtractionTransportation (34.0% share, 2025)Utilities (7.15% CAGR)
By Construction TypeNew Construction, RenovationNew Construction (68.1% share, 2025)Renovation (6.46% CAGR)
By Investment SourcePublic, PrivatePublic (56.3% share, 2025)Private (6.63% CAGR)
By GeographyNorth America, Europe, Asia-Pacific, South America, Middle East & AfricaAsia-Pacific (42.1% share, 2025)Middle East & Africa (7.93% CAGR)


MARKET SEGMENTATION OVERVIEW

By Infrastructure Segment

Sub-SegmentKey Trend
TransportationElectrified rail and automated port construction driving sustained capex
UtilitiesGrid modernization for distributed renewable integration
SocialPost-pandemic hospital and education facility building programs
ExtractionInfrastructure Construction Market site expansion and oil & gas field development


Transportation leads with over one-third of total spending, propelled by highway rehabilitation backlogs and high-speed rail programs across Asia and Europe. Utilities follow closely as the fastest-growing segment due to the global push toward renewable energy grid connectivity.

By Construction Type

Sub-SegmentKey Trend
New ConstructionGreenfield mega-projects in emerging economies
RenovationClimate-resilience retrofitting and aging asset life-extension


New construction commands the majority of revenue, though renovation is accelerating as OECD nations confront deferred maintenance on mid-century bridges, dams, and water mains.

By Investment Source

Sub-SegmentKey Trend
PublicSovereign fiscal programs and multilateral development bank lending
PrivateAvailability-payment concessions and green bond-financed builds


Public funding remains the dominant source, but private capital's share is expanding as institutional investors seek inflation-hedged, long-duration infrastructure returns through structured concession models.


 

Download PDF ×

We do not share your information with anyone. However, we may send you emails based on your report interest from time to time. You may contact us at any time to opt-out.