Interactive Projector Market (2026 - 2035)

Interactive Projector Market Size, Share and Research Report By Dimension (3D and 2D), Display Type (LCoS (Liquid Crystal on Silicon), DLP (Digital Light Processing) and LCD (Liquid Colour Display)), By Projection Distance (Short Throw, Ultra-Short Throw and Standard Throw), By Resolution (Wide XGA, X, Wide UXGA and HD), By Application (Media & Entertainment, Enterprises, Tourism & Hospitality, Healthcare, Education and Others), And By Region (North America, Europe, Asia-Pacific, And Rest Of The World) –Industry Forecast Till 2035
ID: MRFR/SEM/4431-HCR
200 Pages
Ankit Gupta
Last Updated: July 22, 2026
Interactive Projector Market
Market Size
Forecast Period2026-2035
CAGR (2026-2035)13.50%
2026 Market SizeUSD 4.67 Billion
2035 Market SizeUSD 14.60 Billion
Key Players
Seiko Epson
BenQ
Sony
Panasonic Connect
Optoma
Sharp NEC Display
Opportunities
  • Immersive Healthcare Training and Surgical Visualization
  • Projection-as-a-Service and Subscription Models
  • Emerging-Market Government Classroom Programs

Interactive Projector Market Summary

The Interactive Projector Market reached an estimated USD 4.10 Billion in 2025, with forward projections placing the sector at USD 4.67 Billion in 2026 and USD 14.60 Billion by 2035, reflecting a compound annual growth rate of 13.50% over 2026–2035. Government education digitization mandates — including the EU's Digital Education Action Plan allocating EUR 2.5 Billion through 2027 and India's PM eVIDYA initiative — have provided direct procurement channels for classroom-grade projection hardware [1][2]. Enterprise hybrid work investments, which exceeded USD 72 billion globally in 2024 according to the sources [3], now funnel meaningful budget share toward collaborative display technologies in training rooms and boardrooms.

A clear technology migration is reshaping the competitive field. Legacy lamp-based models, while still significant in price-sensitive segments, are steadily yielding floor space to laser phosphor engines and ultra-short throw (UST) form factors that reduce installation complexity and total cost of ownership. The shift toward 4K native resolution — accelerated by falling panel costs and growing availability of high-definition instructional content — has turned resolution into a decisive purchase criterion for institutional buyers planning five-to-seven-year refresh cycles [4].

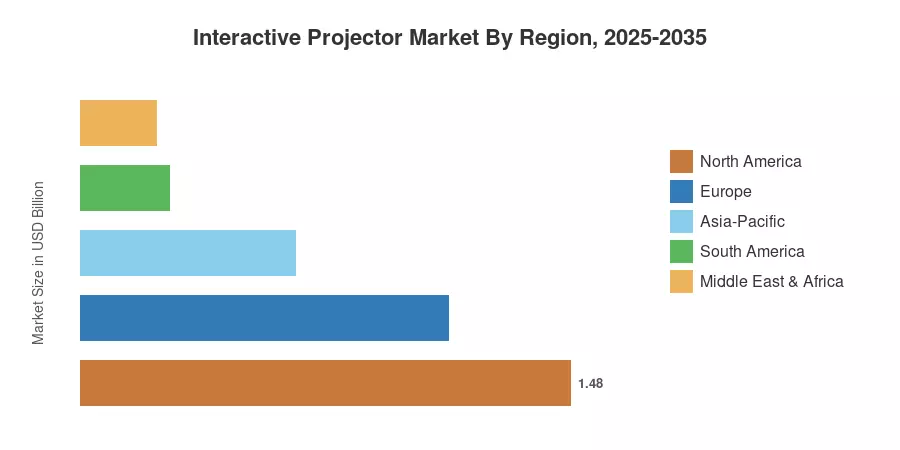
North America commanded roughly 36.0% of the Interactive Projector Market in 2025, anchored by K-12 federal funding programs and corporate AV refresh spending. Asia-Pacific is the fastest-growing region, propelled by China's smart-classroom expansion, India's state-level digitization budgets, and Japan's enterprise modernization initiatives. Europe holds the second-largest position with approximately a 27.0% share, driven by sustainability-linked procurement standards favoring energy-efficient laser projectors. The next decade promises accelerating consolidation around vendors that combine hardware performance with integrated software ecosystems.


Key Report Takeaways

• By Technology

  • 3LCD models captured the leading share of the Interactive Projector Market in 2025, representing approximately 60.0% of global shipments, owing to superior color accuracy favored in education.
  • LCoS-based systems are projected to grow at a 14.5% CAGR through 2035, driven by premium corporate and simulation applications.


• By Hardware Configuration


  • Ultra-short throw units accounted for roughly 71.0% of the Interactive Projector Market by projection distance, benefiting from compact installation in space-constrained classrooms.

• By Application

  • Education held the dominant application share of the Interactive Projector Market in 2025 at approximately 49.0%, reflecting ongoing K-12 infrastructure upgrades worldwide.


• By End User


  • Healthcare applications are registering the fastest sectoral CAGR at 14.5%, fueled by surgical visualization and medical training use cases.

• By Region

  • North America led the Interactive Projector Market with a 36.0% regional share in 2025, supported by Title IV-A funding and corporate AV capital cycles.
  • Asia-Pacific is advancing at the highest regional CAGR, with government smart-classroom programs in China and India accelerating deployments.


Market Size and Forecast (2021–2035)

Market Research Future's sizing model integrates top-down revenue benchmarks from vendor disclosures, import–export databases, and channel surveys with bottom-up unit shipment tracking across 48 country markets. Historical figures (2021–2024) reflect confirmed industry revenues; the base year (2025) is estimated; and the forecast period (2026–2035) applies a calibrated CAGR informed by demand modeling, policy pipeline analysis, and technology cost curves.
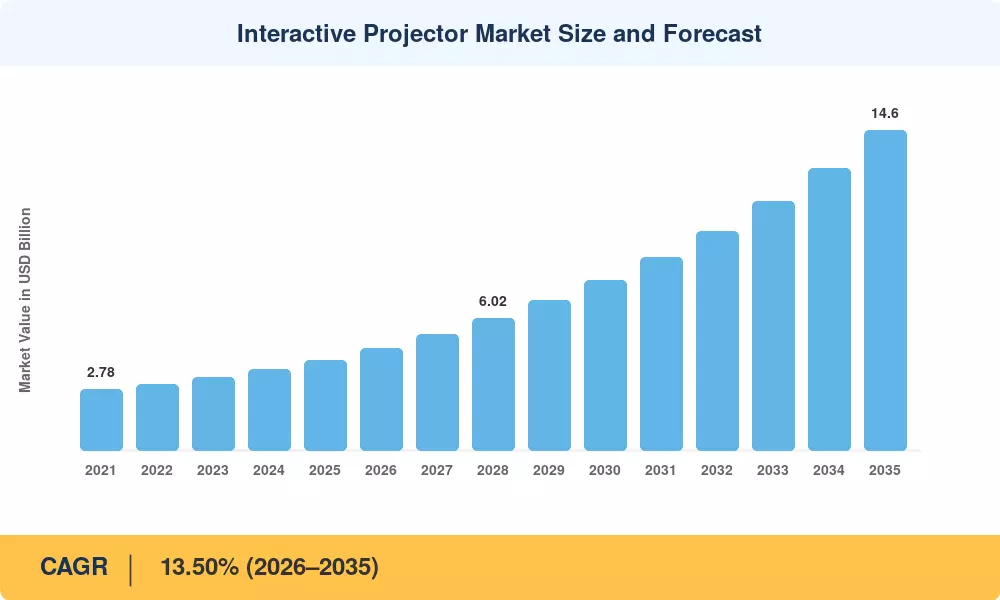
Interactive Projector Market Size and Forecast
Our Impact
Enabled $4.3B Revenue Impact for Fortune 500 and Leading Multinationals
Partnering with 2000+ Global Organizations Each Year
30K+ Citations by Top-Tier Firms in the Industry

Driver Impact Analysis

Driver ~% Impact on CAGR Geographic Relevance Impact Timeline
K-12 and higher-education digitization mandates ~22% Global Short-term (≤2 yr)
Hybrid and distributed enterprise collaboration ~20% North America, Europe Medium-term (2–4 yr)
Laser light-source cost reduction ~18% Global Medium-term (2–4 yr)
4K and ultra-high-resolution content proliferation ~14% North America, APAC Long-term (≥4 yr)
Smart-city and digital government infrastructure ~12% Asia-Pacific, MEA Long-term (≥4 yr)
Healthcare visualization and surgical training ~8% North America, Europe Medium-term (2–4 yr)
Wireless casting and BYOD interoperability ~6% Global Short-term (≤2 yr)


K-12 and Higher-Education Digitization

Governments worldwide have earmarked unprecedented budgets for classroom technology. The U.S. Department of Education's Title IV-A program channeled over USD 1.2 billion annually toward technology infrastructure between 2022 and 2025, with interactive display hardware qualifying as an approved expenditure category [1]. India's Samagra Shiksha Abhiyan allocated INR 37,000 Crore (approximately USD 4.4 Billion) for school infrastructure upgrades between 2021 and 2026, explicitly including digital projection systems in eligible procurement lists [2]. These mandates create a floor of institutional demand that insulates the Interactive Projector Market from consumer discretionary cycles.

Hybrid and Distributed Enterprise Collaboration

estimated that global spending on collaborative workspace technology reached USD 72 billion in 2024, with projection and display hardware capturing roughly 8% of that envelope [3]. Enterprises migrating from static conference-room setups to interactive huddle-space configurations require projection systems that support multi-user annotation, wireless device mirroring, and video-conferencing integration. The Interactive Projector Market benefits directly as corporations standardize on touch-enabled, software-bundled projectors to reduce the total number of peripheral devices per room.

Laser Light-Source Cost Reduction

Strategies Unlimited [4] reports that the average selling price of blue laser diode modules decreased by approximately 35% between 2021 and 2025. Laser-based interactive projectors have transitioned from premium-only positioning to mid-tier institutional budgets as a result of this cost trajectory. Laser engines, which are rated at 20,000–30,000 hours, eliminate the need for lamp replacement costs, which have historically been USD 200–400 per unit every 3,000–5,000 hours. Consequently, the total cost of ownership argument becomes more significant in competitive tenders.


4K Content Proliferation and Resolution Migration

The availability of native 4K instructional content through platforms such as Google Classroom, Microsoft Teams for Education, and proprietary LMS ecosystems has shifted buyer expectations [6]. Procurement specifications in the U.S., South Korea, and the Nordic countries increasingly mandate minimum WUXGA resolution for new classroom installations, creating a pull-through effect for the Interactive Projector Market.


Restraints Impact Analysis

The restraint impact percentages below are directional estimates of negative pressure on market growth. They do not subtract directly from the headline CAGR; instead, they reflect the relative magnitude of each barrier as modeled through procurement delay data, technology adoption friction, and competitive substitution analysis.

Restraint ~% Negative Impact Geographic Relevance Impact Timeline
Interactive flat-panel display substitution ~30% North America, Europe Short-term (≤2 yr)
Ambient light performance limitations ~25% Global Medium-term (2–4 yr)
High upfront cost for laser 4K systems ~20% Emerging markets Short-term (≤2 yr)
Fragmented software interoperability standards ~15% Global Medium-term (2–4 yr)
Skilled installer and calibration labor shortage ~10% Asia-Pacific, MEA Long-term (≥4 yr)


Interactive Flat-Panel Display Substitution

In smaller classroom environments where ambient light management is inadequate, large-format interactive flat-panel displays (IFPDs) have gained a substantial market share, particularly 75-inch and 86-inch models from vendors such as Promethean and SMART Technologies [13]. IFPDs provide pixel-level touch precision without the need for external sensor bars and eradicate the need for lamp or laser maintenance. For the first time in 2023, IFPD unit shipments in North America exceeded those of interactive projectors, resulting in pricing and total cost pressure on the Interactive Projector Market in the sub-100-inch diagonal size range.


Ambient Light Performance Limitations

The contrast fidelity of even the most powerful interactive projectors is compromised in rooms with substantial ambient light, whether it is natural or artificial. According to research conducted by the sources, the perceived contrast ratio of projected images in classrooms with an average luminance of 500 lux was reduced by 40–60% in comparison to controlled demonstration environments [14]. In retrofit scenarios where window treatments or lighting controls are not budgeted, this performance gap increases the sales cycle length and reduces consumer confidence in the Interactive Projector Market.


High Upfront Cost for Laser 4K Systems

While total cost of ownership favors laser over lamp, the initial acquisition cost of a 4K laser UST interactive projector still exceeds USD 3,500 per unit — roughly 2.5 times that of an equivalent-lumen lamp-based HD model [5]. Schools and government offices in South Asia, Sub-Saharan Africa, and Latin America frequently operate under single-fiscal-year capital budgets that make the higher purchase price prohibitive regardless of lifecycle savings.


Interactive Projector Market Opportunities

Immersive Healthcare Training and Surgical Visualization

Hospitals and medical schools are deploying interactive projection on operating tables and anatomy labs, where large, adjustable image surfaces outperform fixed monitors. The global medical simulation market is projected to exceed USD 4.8 billion by 2030, creating a high-value niche for the Interactive Projector Market that commands premium ASPs.

Projection-as-a-Service and Subscription Models

Hardware vendors are beginning to bundle projectors with cloud management software, content licensing, and predictive maintenance contracts under multi-year subscription frameworks. This approach converts capital expenditure into operating expenditure, lowers the barrier for budget-constrained schools, and generates recurring revenue streams that improve vendor margin predictability [10].

Emerging-Market Government Classroom Programs

Countries including Nigeria, Indonesia, and Bangladesh have announced classroom digitization targets covering more than 350,000 schools collectively between 2025 and 2032 [8]. Interactive projectors are the default technology choice in large classrooms exceeding 60 students, where flat-panel display sizes become impractical and cost-prohibitive. The Interactive Projector Market stands to capture a disproportionate share of these government tenders.

Retail and Experiential Marketing Installations

Interactive floor and wall projection for retail environments, museum exhibits, and event activations represents a growing non-traditional channel. Estimated the global digital signage market at USD 27.8 billion in 2024, with interactive projection installations growing at roughly 18% annually within that category.

AI-Driven Auto-Calibration and Gesture Recognition

Machine-learning algorithms that automatically correct keystone distortion, optimize color temperature for ambient conditions, and enable touchless gesture control are removing historical installation and usability friction. Vendors embedding edge AI processors directly into projector chassis can differentiate on user experience and justify premium pricing in the Interactive Projector Market [9].


Interactive Projector Market Future Outlook

AI-Integrated Projection Ecosystems

Edge-AI chipsets embedded within projector hardware will enable real-time gesture recognition, automatic room-environment calibration, and adaptive content formatting by 2028. A recent source projects that 45% of enterprise presentation devices shipped in 2030 will include on-device AI inference capabilities [9]. For the Interactive Projector Market, this translates into higher ASPs, stronger vendor lock-in through proprietary AI feature sets, and a new battleground for competitive differentiation.

Platform Economics and Software-Defined Revenue

The projection industry is pivoting from one-time hardware sales toward platform-based recurring revenue models. Vendors that integrate cloud-based device management, content delivery networks, and usage analytics can convert a USD 3,000 hardware sale into a USD 600-per-year SaaS relationship extending across a seven-year product lifecycle [10]. This shift will restructure margin profiles within the Interactive Projector Market and favor scale players with existing software engineering talent.

Sustainability and Circular-Economy Mandates

The European Commission's Ecodesign for Sustainable Products Regulation, effective from 2026, will impose minimum energy-efficiency thresholds and reparability scoring on electronic display equipment [11]. Laser projectors, with lifespans three to five times longer than lamp-based units, are well-positioned to meet these requirements. Vendors that proactively adopt modular designs and take-back programs will gain preferential access to public procurement in the EU and other jurisdictions adopting similar frameworks.

Convergence with Augmented and Mixed Reality

Interactive projection surfaces will increasingly interact with spatial computing platforms and AR headsets by the early 2030s. Projection-surface anchoring is a feature that is supported by both Microsoft's Mesh platform and Apple's Vision ecosystem. This feature involves a physical projected display that functions as a shared collaboration canvas that is visible to both in-room and remote participants [18]. As these hybrid use cases mature, the Interactive Projector Market is expected to absorb a portion of the spatial computing hardware budget.


Interactive Projector Market Segmentation

By Dimension

Segment Metric (2025) Primary Demand Driver
2D 85.0% share Standard classroom and boardroom deployment
3D 16.4% CAGR (2026–2035) Medical imaging, design visualization


Two-dimensional projection dominates the Interactive Projector Market because the vast majority of instructional and corporate content is authored in 2D formats. The segment's scale advantage keeps per-unit costs low and content compatibility universal. Three-dimensional interactive projection, while niche, is gaining traction in architectural design studios and medical anatomy labs where spatial depth perception reduces cognitive load during training exercises.

By Technology

Segment Metric (2025) Primary Demand Driver
3LCD 60.0% share Color brightness for lit classrooms
DLP USD 1.23 Billion Cost-competitive portable units
LCoS 14.5% CAGR (2026–2035) Premium simulation and cinema applications


The Interactive Projector Market remains anchored by 3LCD technology, which delivers equal white and color brightness — a critical specification for rooms where ambient light cannot be fully controlled. DLP platforms maintain relevance through compact, cost-effective portable models favored by traveling trainers and small enterprises. LCoS technology, offering the highest native contrast ratios, is carving a premium lane in corporate executive briefing centers and immersive training facilities.

By Light Source

Segment Metric (2025) Primary Demand Driver
Lamp 50.0% share Budget-driven institutional buyers
Laser 18.5% CAGR (2026–2035) Zero-maintenance, long-life operations
LED USD 0.31 Billion Ultra-portable micro-projection units


Lamp-based units retain a slim majority share in the Interactive Projector Market, largely because replacement lamps remain available and purchase prices sit 40–60% below laser equivalents. Laser systems are rapidly eroding that lead; their 20,000-plus-hour rated lifespan eliminates maintenance visits that disrupt classroom schedules.

By Resolution

Segment Metric (2025) Primary Demand Driver
HD (WXGA and below) 44.5% share Cost-sensitive bulk procurement
Full HD USD 1.15 Billion Corporate and mid-tier education
4K and Above 19.0% CAGR (2026–2035) Premium content fidelity


HD projectors remain the volume anchor for cost-sensitive, large-scale deployments, while Full HD dominates overall market value across corporate and mid-tier education sectors. Meanwhile, adoption of 4K and higher resolutions is accelerating rapidly to serve high-end environments that demand maximum visual fidelity.

By Application

Segment Metric (2025) Primary Demand Driver
Education 49.0% share K-12 and university classroom upgrades
Corporate & Enterprise USD 1.07 Billion Hybrid meeting room installations
Healthcare 14.5% CAGR (2026–2035) Surgical planning, anatomy training
Retail & Entertainment USD 0.28 Billion Experiential marketing, museums
Government & Defense 13.0% CAGR (2026–2035) Command-center visualization


Education anchors the Interactive Projector Market, with K-12 school districts driving the largest individual purchase orders globally. Corporate and enterprise deployments form the second-largest revenue pool, as organizations standardize huddle-room and boardroom configurations around interactive projection rather than multiple discrete peripherals.

By Connectivity

Segment Metric (2025) Primary Demand Driver
Wired 63.0% share Reliability in institutional networks
Wireless 17.2% CAGR (2026–2035) BYOD and multi-device casting


Wired connections maintain the dominant share driven by institutional demands for security and network reliability, while wireless functionality represents the fastest-growing segment as organizations adapt to bring-your-own-device (BYOD) and multi-device collaboration.

By Projection Distance

Segment Metric (2025) Primary Demand Driver
Ultra-Short Throw 71.0% share Shadow-free installation, small rooms
Short Throw 13.8% CAGR (2026–2035) Mid-size conference rooms
Standard Throw USD 0.37 Billion Large auditoriums, legacy installs


Ultra-short throw projectors command the vast majority of the market due to their shadow-free operation in compact spaces, while short-throw models show strong momentum for mid-sized rooms. Standard throw units continue to generate steady revenue by serving large auditoriums and legacy setups requiring longer projection distances.


Regional Market Share Analysis

Region Metric (2025) Primary Investment Themes
North America 36.0% share K-12 federal funding, enterprise collaboration
Europe 27.0% share Sustainability procurement, higher education
Asia-Pacific 15.8% CAGR (2026–2035) Smart-classroom mandates, urbanization
South America USD 0.27 Billion Government digitization, cost-sensitive segments
Middle East & Africa USD 0.23 Billion Smart-city initiatives, oil-economy diversification
Total USD 4.10 Billion

The Interactive Projector Market exhibits distinct regional demand patterns shaped by education policy maturity, corporate AV spending levels, and technology import dynamics.


North America

Country Metric Key Driver
US 72.0% of regional share Title IV-A funding, corporate AV budgets
Canada 16.5% of regional share Provincial education technology grants
Mexico USD 0.17 Billion SEP digital school modernization


The United States remains the single largest country market globally, with school districts in Texas, California, and New York accounting for outsized procurement volumes. Canada's Interactive Projector Market benefits from provincial grants such as Ontario's Broadband and Digital Infrastructure Fund, while Mexico's Secretaría de Educación Pública has included projection hardware in its Estrategia Digital Nacional roadmap through 2028 [1][16].

Europe

Country Metric Key Driver
Germany 22.0% of regional share Industrie 4.0 training facilities
UK 19.5% of regional share DfE EdTech procurement framework
France 15.0% of regional share Plan France 2030 education component
Italy USD 0.13 Billion PNRR digitization funding
Spain 9.2% CAGR Escuela Digital program
Nordic Countries USD 0.11 Billion Sustainability-led procurement
Russia 5.0% of regional share Import substitution constraints
Rest of Europe USD 0.09 Billion EU Structural Fund allocations


Germany and the UK jointly represent over 40% of the European Interactive Projector Market. The EU's Digital Education Action Plan (2021–2027) provides co-financing for interactive classroom installations across member states, particularly in Southern and Eastern Europe where digitization gaps persist [2][11].

Asia-Pacific

Country Metric Key Driver
China 35.0% of regional share Ministry of Education smart-campus mandates
India 17.2% CAGR Samagra Shiksha and NEP 2020
Japan USD 0.18 Billion GIGA School and enterprise AV
South Korea 14.0% of regional share K-Smart School initiative
ASEAN 16.5% CAGR Philippines and Vietnam classroom programs
Rest of Asia-Pacific USD 0.07 Billion Emerging institutional demand


China's Ministry of Education mandated interactive display coverage in 80% of urban primary schools by 2025, creating a multi-billion-dollar addressable base. India's National Education Policy 2020 and its associated Samagra Shiksha framework drive the Interactive Projector Market in the subcontinent, with state-level tenders frequently specifying UST laser projectors for classrooms exceeding 40 students [2][8].

South America

Country Metric Key Driver
Brazil 58.0% of regional share FNDE digital education procurement
Argentina 11.8% CAGR Conectar Igualdad classroom initiative
Rest of South America USD 0.06 Billion Multilateral development bank funding


Brazil's FNDE (Fundo Nacional de Desenvolvimento da Educação) has directed procurement budgets toward interactive AV hardware for public schools, making it the clear anchor of the South American Interactive Projector Market. Argentina's Conectar Igualdad program has expanded to include projection equipment alongside its laptop distribution goals [8].

Middle East & Africa

Country Metric Key Driver
Saudi Arabia 30.0% of regional share Vision 2030 education modernization
UAE 25.0% of regional share Smart Dubai and ADEK school standards
South Africa 12.5% CAGR Provincial ICT roll-out programs
Egypt USD 0.03 Billion Knowledge Bank digital classrooms
Rest of MEA USD 0.05 Billion AfDB and World Bank funding


Saudi Arabia's Vision 2030 education pillar has committed over USD 21 billion to school infrastructure modernization, with interactive projection featuring prominently in smart-classroom specifications. The UAE's ADEK standards for Abu Dhabi schools require interactive display capabilities in every newly constructed classroom, sustaining demand for the Interactive Projector Market in the Gulf Cooperation Council corridor [8][17].


Interactive Projector Market By Region, 2025-2035

Competitive Benchmarking

The Interactive Projector Market exhibits medium concentration, with the top five vendors collectively holding an estimated 45–55% revenue share. The Herfindahl-Hirschman Index (HHI) is estimated at approximately 850–1,050, indicating a moderately competitive field. Japanese manufacturers historically dominate the technology tier, while Taiwanese and Chinese vendors compete aggressively on price. Differentiation increasingly hinges on bundled software ecosystems, warranty terms, and channel partner density rather than pure hardware specifications.

Company Est. Revenue Share Range Key Offerings for Interactive Projector Market Strategic Positioning
Seiko Epson ~12–15% BrightLink UST series, 3LCD laser engines Broadest education channel footprint globally
BenQ ~9–12% EW/LH series with touch module, DLP laser Value-driven institutional and SMB positioning
Sony ~7–10% VPL series, native 4K LCoS projection Premium corporate and simulation segments
Panasonic Connect ~6–9% PT-MZ series, solid-shine laser, wireless management Enterprise and large-venue focus
Optoma ~5–7% EH/ZH series, DLP laser, compact form factors Aggressive pricing in mid-tier education
Sharp NEC Display ~4–6% PE/PA series, MultiPresenter software integration Higher-education and government specialist
Casio ~3–5% LampFree hybrid LED-laser models Ultra-low maintenance positioning
ViewSonic ~3–5% LS series, myViewBoard collaboration software Software-led differentiation for K-12
Ricoh ~2–4% PJ WXC series, short-throw interactive models Office-centric MFP cross-sell strategy
Dell Technologies ~2–4% S-series interactive projectors, IT ecosystem bundling Enterprise IT procurement integration


Recent News & Developments

  • Epson (October 2024): Launched the BrightLink 770Fi, its first native 4K UST interactive laser projector, targeting K-12 districts upgrading from HD models. The 4,500-lumen unit integrates finger-touch and pen-touch without an external module [4].
  • Panasonic Connect (March 2024): Partnered with Zoom to embed native Zoom Rooms certification in its PT-MZ series, positioning interactive projectors as primary Zoom meeting-room endpoints for distributed enterprise teams [3].
  • ViewSonic (January 2025): Released myViewBoard Classroom 4.0, a software platform that converts any ViewSonic projector into a collaborative whiteboard with real-time polling and AI-generated lesson summarization [9].
  • European Commission (June 2024): Published draft Ecodesign implementing rules that set minimum energy-efficiency indices for projectors sold in the EU single market, favoring laser over lamp technologies [11].
  • Sony (November 2024): Unveiled the VPL-PHZ61 with integrated edge-AI auto-calibration, automatically adjusting keystoning and color temperature based on room-light sensor inputs, reducing installer setup time by an estimated 65% [9].


Interactive Projector Market Report Scope

Parameter Detail
Market Scope Global Interactive Projector Market — hardware revenue, excluding standalone flat-panel displays
Study Period 2021–2035
CAGR (Forecast) 13.50% (2026–2035)
Base Year 2025 — USD 4.10 Billion
2026 Forecast Starting Value USD 4.67 Billion
2035 Forecast Endpoint USD 14.60 Billion
Fastest Growing Segment Laser light source (18.5% CAGR); 4K resolution (19.0% CAGR)
Companies Profiled 10 (Seiko Epson, BenQ, Sony, Panasonic Connect, Optoma, Sharp NEC Display, Casio, ViewSonic, Ricoh, Dell Technologies)
Valuation Currency USD Billion


FAQs

How does lamp replacement frequency affect total cost comparisons between lamp and laser interactive projectors?
Lamp units need bulb changes every 3,000–5,000 hours at USD 200–400 each, adding USD 1,200+ over a seven-year lifecycle. Laser systems eliminate this cost entirely [4].
What interoperability certifications should procurement teams require when specifying interactive projectors for Zoom or Teams rooms?
Specify Zoom Rooms or Microsoft Teams Rooms hardware certification, which guarantees native one-touch meeting launch and peripheral auto-discovery without third-party middleware [3].
At what screen size does an interactive projector become more cost-effective than an interactive flat-panel display?
Above 100-inch diagonal, projectors typically cost 30–50% less per inch than equivalent IFPDs, making them the default for large classrooms and auditoriums [13].
How do touch-overlay sensor technologies differ in accuracy between infrared and camera-based systems?
Infrared frames achieve ±1 mm accuracy with up to 32 simultaneous touch points. Camera-based systems offer ±2 mm precision but add simpler retrofit flexibility [7].
What network bandwidth is required for reliable wireless casting to an interactive projector in a multi-device classroom?
A dedicated 5 GHz Wi-Fi channel with 50 Mbps per concurrent stream supports up to six simultaneous device mirrors at Full HD without latency degradation [7].
How are trade tariffs on optical components influencing Interactive Projector Market pricing in 2025?
U.S. Section 301 tariffs on Chinese-origin optical assemblies add 7–12% to landed costs, pushing some vendors to diversify sourcing to Vietnam and Thailand [5].
What warranty and service-level terms distinguish tier-one Interactive Projector Market vendors from value brands?
Tier-one vendors typically offer five-year or 20,000-hour laser warranties with next-business-day on-site swap, versus three-year depot-return terms from value-tier suppliers [21].    
Author
Author
Author Profile
Ankit Gupta LinkedIn
Team Lead - Research
Ankit Gupta is a seasoned market intelligence and strategic research professional with over six plus years of experience in the ICT and Semiconductor industries. With academic roots in Telecom, Marketing, and Electronics, he blends technical insight with business strategy. Ankit has led 200+ projects, including work for Fortune 500 clients like Microsoft and Rio Tinto, covering market sizing, tech forecasting, and go-to-market strategies. Known for bridging engineering and enterprise decision-making, his insights support growth, innovation, and investment planning across diverse technology markets.
Download Free Sample

Kindly complete the form below to receive a free sample of this Report

Download PDF ×

We do not share your information with anyone. However, we may send you emails based on your report interest from time to time. You may contact us at any time to opt-out.
















