• Cat-intel
  • MedIntelliX
  • Resources
  • About Us
  • Hero Background
    English
    Chinese
    French
    Japanese
    Korean
    German
    Spanish

    Ion Exchange Resins Market Analysis

    ID: MRFR/CnM/4575-CR
    128 Pages
    Chitranshi Jaiswal
    March 2024

    Ion Exchange Resins Market Research Report By Type (Cation Exchange Resins, Anion Exchange Resins, Mixed Bed Resins), By Application (Water Treatment, Chemical Processing, Pharmaceuticals, Food and Beverage, Nuclear Power), By End Use Industry (Power Generation, Water Treatment Plants, Pulp and Paper, Mining, Electronics), By Form (Granular, Bead, Synthetic, Natural) and By Regional (North Ame...

    Share:
    Download PDF ×

    We do not share your information with anyone. However, we may send you emails based on your report interest from time to time. You may contact us at any time to opt-out.

    Ion Exchange Resins Market Infographic
    $ 4,950.0
    $ 5,950.0
    $ 7,250.0

    Market Analysis

    In-depth Analysis of Ion Exchange Resins Market Industry Landscape

    The ion exchange resins market is influenced by various market dynamics that impact its growth and trajectory. Ion exchange resins are widely used in industries such as water treatment, pharmaceuticals, food and beverages, power generation, and chemical processing. One of the key factors driving the growth of the ion exchange resins market is the increasing demand for clean and safe water across the globe. As water scarcity becomes a growing concern, the need for efficient water treatment solutions has led to a rise in the adoption of ion exchange resins.

    Moreover, the stringent environmental regulations imposed by governments and regulatory bodies regarding water quality and wastewater treatment have also fueled the demand for ion exchange resins. These resins are effective in removing impurities, heavy metals, and contaminants from water, making it suitable for various applications. Additionally, the growing awareness among consumers about the importance of clean water for health and sanitation has further boosted the market for ion exchange resins.

    Another significant factor driving market growth is the expanding industrial sector, particularly in developing economies. Industries such as pharmaceuticals, food and beverages, and chemical processing require water of high purity for their manufacturing processes. Ion exchange resins play a crucial role in purifying water and removing unwanted substances, thereby ensuring the quality and safety of the final products. As industrial activities continue to grow, the demand for ion exchange resins is expected to rise correspondingly.

    The ion exchange resins are used to remove chlorine, organic compounds, and significant other element and are prepared before industrial usage. Such factors are expected to propel the overall growth of the ion exchange resins industry during the forecast period.

    Furthermore, technological advancements and innovations in ion exchange resins have also contributed to market growth. Manufacturers are constantly investing in research and development to improve the performance and efficiency of ion exchange resins. Newer generations of resins with enhanced properties such as higher capacity, faster kinetics, and greater selectivity are being introduced into the market, catering to the evolving needs of various industries.

    However, the ion exchange resins market also faces certain challenges that may hinder its growth. One such challenge is the availability of alternative water treatment technologies such as membrane filtration, reverse osmosis, and UV disinfection. These technologies offer alternatives to ion exchange resins and compete with them in the market. Additionally, fluctuations in raw material prices, particularly those of petrochemical-based resins, can impact the cost structure of ion exchange resins, affecting their competitiveness in the market.

    Moreover, the ion exchange resins market is highly fragmented, with numerous players operating in the industry. This intense competition can lead to price wars and margin pressures for manufacturers, especially in mature markets. However, it also presents opportunities for innovation and differentiation among market players, as they strive to offer unique products and solutions to gain a competitive edge.

    Despite these challenges, the ion exchange resins market is expected to witness steady growth in the coming years, driven by the increasing demand for clean water, stringent environmental regulations, expanding industrial activities, and technological advancements. Market players need to focus on continuous innovation, product differentiation, and strategic partnerships to capitalize on the opportunities in this dynamic market landscape. Additionally, investments in research and development, as well as geographic expansion into emerging markets, can help companies unlock new growth avenues and strengthen their position in the global ion exchange resins market.

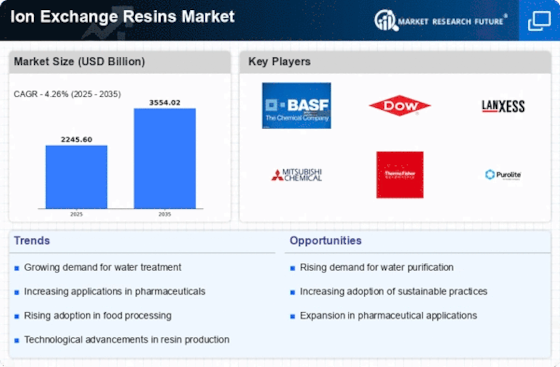
    Market Summary

    As per Market Research Future Analysis, the Global Ion Exchange Resins Market was valued at 2245.60 USD Billion in 2024 and is projected to reach 3554.02 USD Billion by 2035, reflecting a CAGR of 4.26% from 2025 to 2035. The market is driven by increasing demand for water treatment solutions, expansion of end-user industries, and technological advancements in ion exchange processes.

    Key Market Trends & Highlights

    The Ion Exchange Resins Market is witnessing significant growth due to various trends.

    • The market is expected to grow from 3.24 USD Billion in 2023 to 4.5 USD Billion by 2032.
    • Cation Exchange Resins dominated the market with a valuation of 1.5 USD Billion in 2023.
    • The APAC region is valued at 1.05 USD Billion, showing robust growth due to industrialization.
    • Power Generation is a dominant end-use industry, utilizing ion exchange resins for water purification.

    Market Size & Forecast

    2024 Market Size USD 2245.60 Billion
    2035 Market Size USD 3554.02 Billion
    CAGR (2024-2035) 4.26%
    Largest Regional Market Share in 2023 North America.

    Major Players

    Key companies include Solvay, Tosoh, Fujifilm, Thermo Fisher Scientific, ResinTech, Purolite, Kurita Water Industries, Lanxess, DuPont, SABIC, Honeywell International, Dow Ion Exchange, Mitsubishi Chemical, and BASF.

    Market Trends

    The growth of the ion exchange resins market is being supported by a number of important factors. The growing need for water treatment solutions is one important contributing element. The need for efficient water filtration techniques is growing as businesses and governments work to comply with more stringent environmental standards.

    The market is also being driven by the growth of the food and beverage and pharmaceutical industries, both of which depend on high-quality water purification for their operations. Ion exchange resins are becoming more appealing for a range of industrial applications as a result of technological developments in resin production and applications that further increase efficiency.

    As the emphasis on sustainability grows, there are many opportunities in the market for ion exchange resins. Businesses might investigate the creation of novel bio-based resins to satisfy customers who care about the environment.

    The market can also seize chances by creating creative recycling methods for spent resins, which would not only limit waste but also lower costs for enterprises in light of the growing worldwide awareness of water shortage. 

    Furthermore, there is potential for market expansion into emerging economies, where industrial growth is driving demand for water treatment solutions. Recent trends indicate a shift toward more specialized and application-specific resin products.

    Companies are increasingly investing in research and development to create resins that can better serve niche markets, such as mining and nuclear applications, where traditional resins may not suffice. There is also an upward trend in the incorporation of smart technologies into resin applications, allowing for real-time monitoring and enhanced performance.

    This innovation is setting the stage for significant developments within the ion exchange resins sector, encouraging broader market participation and fostering a competitive landscape. As these trends and opportunities evolve, the Ion Exchange Resins Market is poised for continued growth and transformation.

    The increasing demand for high-purity water in various industrial applications is driving the growth of the ion exchange resins market, as these materials are essential for effective water treatment and purification processes.

    U.S. Environmental Protection Agency

    Ion Exchange Resins Market Market Drivers

    Rising Environmental Concerns and Regulations

    The Global Ion Exchange Resins Market Industry is shaped by rising environmental concerns and stringent regulations aimed at reducing pollution. Governments are increasingly enforcing laws that mandate the treatment of industrial effluents and wastewater before discharge. Ion exchange resins are effective in removing heavy metals and other hazardous substances, making them a preferred choice for industries seeking compliance. This regulatory landscape is likely to drive market growth, as companies invest in ion exchange technologies to meet environmental standards and avoid penalties, thereby contributing to a projected CAGR of 3.85% from 2025 to 2035.

    Increasing Demand for Water Treatment Solutions

    The Global Ion Exchange Resins Market Industry experiences a surge in demand for water treatment solutions, driven by the growing need for clean and safe drinking water. As urbanization accelerates, the pressure on water resources intensifies, prompting municipalities and industries to invest in advanced water purification technologies. Ion exchange resins play a pivotal role in removing contaminants and ensuring water quality. The market is projected to reach 3.31 USD Billion in 2024, reflecting a robust growth trajectory as governments worldwide implement stricter regulations on water quality standards.

    Technological Advancements in Resin Manufacturing

    The Global Ion Exchange Resins Market Industry benefits from ongoing technological advancements in resin manufacturing processes. Innovations such as the development of high-capacity and selective ion exchange resins enhance performance and efficiency in various applications, including water treatment and chemical processing. These advancements not only improve the effectiveness of ion exchange systems but also reduce operational costs for end-users. As industries seek to optimize their processes, the demand for advanced ion exchange resins is expected to rise, further propelling market growth and contributing to the overall expansion of the industry.

    Growing Applications in Food and Beverage Industry

    The Global Ion Exchange Resins Market Industry is witnessing growing applications in the food and beverage sector, where ion exchange resins are utilized for demineralization, decolorization, and purification processes. As consumer preferences shift towards high-quality and safe food products, manufacturers are increasingly adopting ion exchange technologies to enhance product quality and shelf life. This trend is likely to drive the demand for ion exchange resins, as companies strive to meet consumer expectations and regulatory requirements. The expansion of this application area is expected to contribute positively to the market's growth trajectory.

    Expansion of Pharmaceutical and Biotechnology Sectors

    The Global Ion Exchange Resins Market Industry is significantly influenced by the expansion of the pharmaceutical and biotechnology sectors. These industries rely heavily on ion exchange resins for the purification and separation of biomolecules, which is essential for drug development and production. As the global pharmaceutical market continues to grow, driven by innovations and an aging population, the demand for high-quality ion exchange resins is expected to rise. This trend indicates a potential increase in market value, with projections suggesting it could reach 5.02 USD Billion by 2035, highlighting the critical role of ion exchange technology in these sectors.

    Market Segment Insights

    Ion Exchange Resins Market Type Insights

    The Ion Exchange Resins Market was structured around several key types that played a vital role in various industries, primarily including Cation Exchange Resins, Anion Exchange Resins, and Mixed Bed Resins.

    Among these types, Cation Exchange Resins dominated the market with a valuation of 1.5 USD Billion in 2023, illustrating their significant application in water treatment, pharmaceuticals, and food processing. Their ability to efficiently remove positively charged ions while maintaining ion exchange equilibrium reinforces their relevance in numerous industrial processes.

    On the other hand, Anion Exchange Resins showed a strong market presence as well, valued at 1.2 USD Billion in 2023. This segment addressed the removal of negatively charged ions, making it essential for applications such as deionization of water, wastewater treatment, and various biochemical processes.

    The increasing demand for clean water and sustainable practices heavily supported the growth of this type, thus driving the overall expansion within the Ion Exchange Resins Market segmentation.

    Mixed Bed resin, combining both cationic and anionic exchange processes, valued at 0.54 USD Billion in 2023, served a crucial function in achieving high-purity water. Their applications were notably significant in power plants and laboratories, where the purity of water is paramount. Despite being the smallest segment in terms of market valuation, it remained vital due to its ability to enhance operational efficiency where high-quality outputs were required.

    Ion Exchange Resins Market Application Insights

    The Ion Exchange Resins Market segment revolving around Applications is poised for substantial growth, driven by its various critical roles across multiple industries. Water Treatment was a prominent area where ion exchange resins are essential for purifying water supplies and ensuring compliance with environmental regulations.

    Chemical Processing also leverages these resins for purification and separation processes, which are vital in refining and producing chemicals. The Pharmaceuticals sector relies on ion exchange technology for drug formulation and quality assurance, contributing to consumer safety.

    The Food and Beverage industry utilizes these resins to maintain product integrity and flavor by removing impurities. Furthermore, Nuclear Power applications find ion exchange resins indispensable for managing radioactive waste and maintaining the safety of nuclear reactors.

    The overall Ion Exchange Resins Market revenue reflects a steady ascent, with factors such as increasing water scarcity, tighter regulations, and growing industrialization functioning as key growth drivers.

    Thus, the Ion Exchange Resins Market statistics highlight its vital contributions across diverse sectors while showcasing opportunities for innovations and improvements in processing techniques.

    Ion Exchange Resins Market End Use Industry Insights

    The Ion Exchange Resins Market is expected to see significant growth within the End Use Industry. This market comprises various sectors including Power Generation, Water Treatment Plants, Pulp and Paper, Mining, and Electronics, each contributing to the overall market dynamics.

    Power Generation utilizes ion exchange resins primarily for water purification and boiler-feed water treatment, making it a dominant force in the industry. Water Treatment Plants leverage these resins to ensure potable water standards, addressing ever-increasing regulatory demands globally.

    The Pulp and Paper industry relies on ion exchange resins for process water treatment, which is vital for maintaining production efficiency and product quality. In Mining, ion exchange resins play an essential role in metal recovery and wastewater management, reflecting its growing importance in sustainable practices.

    Lastly, the Electronics sector requires high-purity water for manufacturing processes, revealing the critical nature of ion exchange resins in ensuring product integrity. The diversity in application across these various sectors highlights the importance of the Ion Exchange Resins Market and illustrates the potential for market growth driven by increasing demand for water treatment and purification processes.

    Ion Exchange Resins Market Form Insights

    The Ion Exchange Resins Market, under the Form segment, is witnessing growth driven by diverse applications across industries such as water treatment, pharmaceuticals, and food processing. The market data reveals that Granular and Bead forms play a crucial role, often being favored for their efficiency in adsorption and ion exchange processes.

    Synthetic forms have gained traction due to their consistent performance and adaptability in complex environments, while Natural forms are valued for their eco-friendliness and sustainability aspects.

    The Ion Exchange resin Market is driven by increasing demand for clean water and stricter regulations on effluent discharge, presenting opportunities for innovative resin developments. However, challenges such as fluctuating raw material costs and competition from alternative water treatment methods may impact overall market dynamics.

    As the market grows, the segmentation of the Ion Exchange Resins Market will continue to evolve, responding to emerging trends and consumer needs.

    Get more detailed insights about Ion Exchange Resins Market Research Report – Forecast to 2032

    Regional Insights

    Within the regional segmentation, North America held a majority position with valuations of 1.25 USD Billion for the same year, reflecting its significant industrial applications and demand for water treatment solutions. Europe followed with a valuation of 0.85 USD Billion, driven by stringent environmental regulations and an increased focus on sustainable practices.

    The APAC region, valued at 1.05 USD Billion, demonstrated robust growth due to rising industrialization and urbanization, appealing for improved water purification processes.

     South America, with a lower valuation of 0.05 USD Billion and MEA, at 0.04 USD Billion, showed potential for future expansion but had a minor share in the overall market.

    These regions contributed to the Ion Exchange Resins Market statistics, emphasizing the importance of regional dynamics and specific market drivers, such as industrial growth and environmental regulation adherence, influencing market growth across varied geographies.

    Ion Exchange Resins Market Regional

    Source: Primary Research, Secondary Research, Market Research Future Database and Analyst Review

    Key Players and Competitive Insights

    The Ion Exchange Resins Market is characterized by a dynamic landscape where numerous players vie for market share through product innovation, strategic partnerships, and regional expansions. The competition in this market is driven by the increasing demand for high-quality water treatment solutions, chemical processing, and pharmaceuticals. Companies are focusing on enhancing their production capabilities and developing specialized resins to meet diverse applications, particularly in industrial sectors.

    The rising environmental regulations and the need for sustainable alternatives further stimulate competition, compelling manufacturers to invest in research and development activities to create more effective and efficient ion exchange solutions. Such competitive dynamics are establishing a multifaceted marketplace, contributing to a robust growth trajectory for the ion exchange resins sector.

    Solvay stands out in the Ion Exchange Resins Market with a strong emphasis on innovation and sustainability. The company's extensive product portfolio includes a variety of ion exchange resins tailored for applications in water treatment, industrial waste management, and the recovery of valuable metals.

    Solvay's reputation for high-quality products is backed by a commitment to research and development, positioning the brand as a leader in advanced resin technology.

    The firm also embraces environmentally friendly practices, incorporating sustainable manufacturing processes and reducing the carbon footprint of its products, which resonate well with the growing demand for eco-conscious solutions. Its strategic presence allows Solvay to cater to a diverse client base, ensuring the availability of specialized solutions across various regional markets.

    Tosoh has made significant strides in the Ion Exchange resin market, primarily focusing on the development and supply of high-performance ion exchange resins that serve various industries. The company is recognized for its state-of-the-art technology and quality assurance protocols, which contribute to the durability and effectiveness of its resin products.

    Tosoh's commitment to customer satisfaction is evident in its tailored solutions that aim to meet specific operational needs across sectors such as pharmaceuticals, food and beverage, and water treatment. By maintaining a strong focus on research and development, Tosoh continuously enhances its product offerings, ensuring they meet the ever-evolving market demands.

    Its reach and strategic partnerships further bolster its position in the market, allowing Tosoh to supply its advanced resins to a wide audience while staying at the forefront of innovation in ion exchange technologies.

    Key Companies in the Ion Exchange Resins Market market include

    Industry Developments

    • Q2 2024: BASF expands production capacity for ion exchange resins at Ludwigshafen site BASF announced the completion of a capacity expansion for its ion exchange resin production facility in Ludwigshafen, Germany, aiming to meet growing demand from water treatment and industrial customers.
    • Q2 2024: LANXESS launches new Lewatit ion exchange resin for pharmaceutical applications LANXESS introduced a new grade of its Lewatit ion exchange resin specifically designed for use in pharmaceutical purification processes, expanding its product portfolio for the life sciences sector.
    • Q1 2024: Purolite opens new manufacturing facility for ion exchange resins in Pennsylvania Purolite inaugurated a new state-of-the-art manufacturing plant in Pennsylvania, USA, to increase its production capacity of ion exchange resins for water treatment and bioprocessing markets.
    • Q2 2024: Mitsubishi Chemical Group announces partnership with Veolia for advanced water treatment solutions Mitsubishi Chemical Group entered into a strategic partnership with Veolia to jointly develop and supply ion exchange resin-based solutions for municipal and industrial water treatment projects.
    • Q1 2024: Thermax Limited secures major contract for ion exchange resin supply to Indian power plant Thermax Limited announced it has won a significant contract to supply ion exchange resins for water purification systems at a new thermal power plant in India.
    • Q2 2024: DuPont Water Solutions launches next-generation AmberLite ion exchange resins DuPont Water Solutions unveiled its latest AmberLite ion exchange resin series, featuring enhanced performance for industrial water treatment and food processing applications.
    • Q1 2024: LANXESS appoints new head of Liquid Purification Technologies business unit LANXESS announced the appointment of a new executive to lead its Liquid Purification Technologies unit, which oversees the company's ion exchange resin operations.
    • Q2 2024: Purolite secures multi-year supply agreement with major European pharmaceutical company Purolite signed a multi-year contract to supply ion exchange resins for purification processes to a leading European pharmaceutical manufacturer.
    • Q2 2024: BASF and Sinopec expand joint venture to include ion exchange resin production in China BASF and Sinopec announced the expansion of their joint venture in Nanjing, China, to add a new production line for ion exchange resins, targeting the growing Asian water treatment market.
    • Q1 2024: Mitsubishi Chemical Group receives regulatory approval for new ion exchange resin plant in Japan Mitsubishi Chemical Group obtained government approval to construct a new ion exchange resin manufacturing facility in Japan, aimed at supporting domestic and export markets.
    • Q2 2024: DuPont partners with U.S. Department of Energy for PFAS removal project using ion exchange resins DuPont announced a collaboration with the U.S. Department of Energy to deploy its ion exchange resin technology for the removal of PFAS contaminants from groundwater at federal sites.
    • Q1 2024: Thermax Limited opens new R&D center for ion exchange resin innovation in Pune, India Thermax Limited inaugurated a new research and development center in Pune, India, dedicated to advancing ion exchange resin technologies for water and process treatment applications.

    Future Outlook

    Ion Exchange Resins Market Future Outlook

    The Ion Exchange Resins Market is projected to grow at a 3.72% CAGR from 2025 to 2035, driven by increasing demand in water treatment, pharmaceuticals, and food processing industries.

    New opportunities lie in:

    • Develop specialty resins for emerging applications in renewable energy sectors.
    • Invest in sustainable resin production methods to meet environmental regulations.
    • Enhance resin performance through innovative formulations for industrial applications.

    By 2035, the Ion Exchange Resins Market is expected to exhibit robust growth, reflecting evolving industry needs and technological advancements.

    Market Segmentation

    Ion Exchange Resins Market Form Outlook

    • Granular
    • Bead
    • Synthetic
    • Natural

    Ion Exchange Resins Market Type Outlook

    • Cation Exchange Resins
    • Anion Exchange Resins
    • Mixed Bed Resins

    Ion Exchange Resins Market Regional Outlook

    • North America
    • Europe
    • South America
    • Asia Pacific
    • Middle East and Africa

    Ion Exchange Resins Market Application Outlook

    • Water Treatment
    • Chemical Processing
    • Pharmaceuticals
    • Food and Beverage
    • Nuclear Power

    Ion Exchange Resins Market End Use Industry Outlook

    • Power Generation
    • Water Treatment Plants
    • Pulp and Paper
    • Mining
    • Electronics

    Report Scope

    Report Attribute/Metric Details
    Market Size 2035 3554.02 (USD Billion)
    Compound Annual Growth Rate (CAGR) 4.26% (2025 - 2035)
    Report Coverage Revenue Forecast, Competitive Landscape, Growth Factors, and Trends
    Base Year 2024
    Market Forecast Period 2025 - 2035
    Historical Data 2019 - 2023
    Market Forecast Units USD Billion
    Key Companies Profiled Solvay, Tosoh, Fujifilm, Thermo Fisher Scientific, ResinTech, Purolite, Kurita Water Industries, Lanxess, DuPont, SABIC, Honeywell International, Dow, Ion Exchange, Mitsubishi Chemical, BASF
    Segments Covered Type, Application, End Use Industry, Form, Regional
    Key Market Opportunities Increasing water treatment demand, Growing pharmaceutical industry needs, Expansion in the oil and gas sector, Advancements in resin technology, Rising environmental regulations compliance
    Key Market Dynamics Increasing water treatment demand, Growing industrial applications, Technological advancements in resins, Rising environmental regulations, Expanding pharmaceutical sector usage
    Countries Covered North America, Europe, APAC, South America, MEA
    Market Size 2024 2245.60 (USD Billion)
    Market Size 2025 2341.31 (USD Billion)
     

    Market Highlights

    Author

    Chitranshi Jaiswal
    Research Analyst Level I

    She holds an experience of about 6+ years in market research and business consulting, working under the spectrum of information communication technology, telecommunications and semiconductor domains. aarti conceptualizes and implements a scalable business strategy and provides strategic leadership to the clients. her expertise lies in market estimation, competitive intelligence, pipeline analysis, customer assessment, etc.

    Leave a Comment

    Latest Comments

    John Doe
    john@example.com

    This is a great article! Really helped me understand the topic better.

    Posted on July 23, 2025, 10:15 AM
    Jane Smith
    jane@domain.com

    Thanks for sharing this. I’ve bookmarked it for later reference.

    Posted on July 22, 2025, 7:45 PM

    FAQs

    What is the expected CAGR for the Ion Exchange Resins Market from 2024 to 2035?

    Ion Exchange Resins Market is projected to register a CAGR of 4.26% from 2025-2035

    Which region is expected to have the largest market size in the Ion Exchange Resins Market by 2035?

    North America is projected to dominate the market with a value of 1.74 billion USD by 2035.

    How much is the Anion Exchange Resins market expected to be valued in 2035?

    The Anion Exchange Resins market is projected to be valued at 1.7 billion USD by 2035.

    Who are the key players in the Ion Exchange resin market?

    Major players in the market include Solvay, Tosoh, Fujifilm, and DuPont among others.

    What is the expected market size for the APAC region in the Ion Exchange Resins Market by 2035?

    The APAC region is projected to reach a market size of 1.47 billion USD by 2035.

    What is the expected market value for the South American region by 2035?

    South America is estimated to reach a market size of 0.07 billion USD by 2035.

    What are the growth drivers for the Ion Exchange Resins Market?

    Key growth drivers include increasing water treatment needs and rising industrial applications.

    1. \r\n6. ION EXCHANGE RESINS MARKET, BY TYPE (USD BILLION)
      1. \r\n6.1.
      2. Cation Exchange Resins
      3. \r\n6.2. Anion Exchange Resins
      4. \r\n6.3. Mixed Bed Resins
    2. \r\n7. ION EXCHANGE RESINS MARKET, BY APPLICATION (USD BILLION)
      1. \r\n7.1.
      2. Water Treatment
      3. \r\n7.2. Chemical Processing
      4. \r\n7.3. Pharmaceuticals
      5. \r\n7.4.
      6. Food and Beverage
      7. \r\n7.5. Nuclear Power
      8. \r\n8. ION EXCHANGE RESINS MARKET,
      9. BY END USE INDUSTRY (USD BILLION)
      10. \r\n8.1. Power Generation
      11. \r\n8.2. Water Treatment Plants
      12. \r\n8.3.
      13. Pulp and Paper
      14. \r\n8.4. Mining
      15. \r\n8.5. Electronics
    3. \r\n9. ION EXCHANGE RESINS MARKET, BY FORM (USD BILLION)
      1. \r\n9.1. Granular
      2. \r\n9.2.
      3. Bead
      4. \r\n9.3. Synthetic
      5. \r\n9.4. Natural
      6. \r\n10. ION EXCHANGE RESINS MARKET,
      7. BY REGIONAL (USD BILLION)
      8. \r\n10.1. North America
      9. \r\n10.1.1. US
      10. \r\n10.1.2.
      11. Canada
      12. \r\n10.2. Europe
      13. \r\n10.2.1. Germany
      14. \r\n10.2.2. UK
      15. \r\n10.2.3. France
      16. \r\n10.2.4. Russia
      17. \r\n10.2.5. Italy
      18. \r\n10.2.6. Spain
      19. \r\n10.2.7. Rest of Europe
      20. \r\n10.3. APAC
      21. \r\n10.3.1. China
      22. \r\n10.3.2. India
      23. \r\n10.3.3. Japan
      24. \r\n10.3.4. South Korea
      25. \r\n10.3.5. Malaysia
      26. \r\n10.3.6. Thailand
      27. \r\n10.3.7. Indonesia
      28. \r\n10.3.8. Rest of APAC
      29. \r\n10.4. South America
      30. \r\n10.4.1. Brazil
      31. \r\n10.4.2. Mexico
      32. \r\n10.4.3. Argentina
      33. \r\n10.4.4. Rest of South America
      34. \r\n10.5. MEA
      35. \r\n10.5.1. GCC Countries
      36. \r\n10.5.2. South Africa
      37. \r\n10.5.3. Rest of MEA
      38. \r\n
      39. \r\n
      40. \r\n
      41. \r\n11. COMPETITIVE LANDSCAPE
      42. \r\n11.1. Overview
      43. \r\n11.2.
      44. Competitive Analysis
      45. \r\n11.3. Market share Analysis
      46. \r\n11.4. Major Growth Strategy
      47. in the Ion Exchange Resins Market
      48. \r\n11.5. Competitive Benchmarking
      49. \r\n11.6. Leading Players in Terms
      50. of Number of Developments in the Ion Exchange Resins Market
      51. \r\n11.7. Key developments and
      52. growth strategies
      53. \r\n11.7.1. New Product Launch/Service Deployment
      54. \r\n11.7.2. Merger & Acquisitions
      55. \r\n11.7.3. Joint Ventures
      56. \r\n11.8. Major Players Financial Matrix
      57. \r\n11.8.1. Sales and Operating
      58. Income
      59. \r\n11.8.2. Major Players R&D Expenditure. 2023
      60. \r\n12. COMPANY PROFILES
      61. \r\n12.1. Solvay
      62. \r\n12.1.1. Financial Overview
      63. \r\n12.1.2. Products Offered
      64. \r\n12.1.3. Key Developments
      65. \r\n12.1.4. SWOT Analysis
      66. \r\n12.1.5. Key Strategies
      67. \r\n12.2. Tosoh
      68. \r\n12.2.1. Financial Overview
      69. \r\n12.2.2.
      70. Products Offered
      71. \r\n12.2.3. Key Developments
      72. \r\n12.2.4.
      73. SWOT Analysis
      74. \r\n12.2.5. Key Strategies
      75. \r\n12.3.
      76. Fujifilm
      77. \r\n12.3.1. Financial Overview
      78. \r\n12.3.2. Products Offered
      79. \r\n12.3.3. Key Developments
      80. \r\n12.3.4. SWOT Analysis
      81. \r\n12.3.5. Key Strategies
      82. \r\n12.4. Thermo Fisher Scientific
      83. \r\n12.4.1.
      84. Financial Overview
      85. \r\n12.4.2. Products Offered
      86. \r\n12.4.3.
      87. Key Developments
      88. \r\n12.4.4. SWOT Analysis
      89. \r\n12.4.5.
      90. Key Strategies
      91. \r\n12.5. ResinTech
      92. \r\n12.5.1. Financial Overview
      93. \r\n12.5.2. Products Offered
      94. \r\n12.5.3. Key Developments
      95. \r\n12.5.4. SWOT Analysis
      96. \r\n12.5.5. Key Strategies
      97. \r\n12.6. Purolite
      98. \r\n12.6.1. Financial Overview
      99. \r\n12.6.2.
      100. Products Offered
      101. \r\n12.6.3. Key Developments
      102. \r\n12.6.4.
      103. SWOT Analysis
      104. \r\n12.6.5. Key Strategies
      105. \r\n12.7.
      106. Kurita Water Industries
      107. \r\n12.7.1. Financial Overview
      108. \r\n12.7.2.
      109. Products Offered
      110. \r\n12.7.3. Key Developments
      111. \r\n12.7.4.
      112. SWOT Analysis
      113. \r\n12.7.5. Key Strategies
      114. \r\n12.8.
      115. Lanxess
      116. \r\n12.8.1. Financial Overview
      117. \r\n12.8.2. Products Offered
      118. \r\n12.8.3. Key Developments
      119. \r\n12.8.4. SWOT Analysis
      120. \r\n12.8.5. Key Strategies
      121. \r\n12.9. DuPont
      122. \r\n12.9.1. Financial Overview
      123. \r\n12.9.2. Products Offered
      124. \r\n12.9.3. Key Developments
      125. \r\n12.9.4. SWOT Analysis
      126. \r\n12.9.5. Key Strategies
      127. \r\n12.10. SABIC
      128. \r\n12.10.1. Financial Overview
      129. \r\n12.10.2.
      130. Products Offered
      131. \r\n12.10.3. Key Developments
      132. \r\n12.10.4.
      133. SWOT Analysis
      134. \r\n12.10.5. Key Strategies
      135. \r\n12.11.
      136. Honeywell International
      137. \r\n12.11.1. Financial Overview
      138. \r\n12.11.2.
      139. Products Offered
      140. \r\n12.11.3. Key Developments
      141. \r\n12.11.4.
      142. SWOT Analysis
      143. \r\n12.11.5. Key Strategies
      144. \r\n12.12.
      145. Dow
      146. \r\n12.12.1.
      147. Financial Overview
      148. \r\n12.12.2. Products Offered
      149. \r\n12.12.3.
      150. Key Developments
      151. \r\n12.12.4. SWOT Analysis
      152. \r\n12.12.5.
      153. Key Strategies
      154. \r\n12.13. Ion Exchange
      155. \r\n12.13.1. Financial Overview
      156. \r\n12.13.2. Products Offered
      157. \r\n12.13.3. Key Developments
      158. \r\n12.13.4. SWOT Analysis
      159. \r\n12.13.5. Key Strategies
      160. \r\n12.14. Mitsubishi Chemical
      161. \r\n12.14.1. Financial Overview
      162. \r\n12.14.2. Products Offered
      163. \r\n12.14.3. Key Developments
      164. \r\n12.14.4. SWOT Analysis
      165. \r\n12.14.5. Key Strategies
      166. \r\n12.15. BASF
      167. \r\n12.15.1. Financial Overview
      168. \r\n12.15.2.
      169. Products Offered
      170. \r\n12.15.3. Key Developments
      171. \r\n12.15.4.
      172. SWOT Analysis
      173. \r\n12.15.5. Key Strategies
      174. \r\n13. APPENDIX
      175. \r\n13.1. References
      176. \r\n13.2. Related Reports
      177. \r\nLIST OF TABLES
      178. \r\n
      179. \r\nTABLE 1. LIST OF ASSUMPTIONS
      180. \r\nTABLE 2. NORTH AMERICA ION
    4. EXCHANGE RESINS MARKET SIZE ESTIMATES & FORECAST, BY TYPE, 2019-2032 (USD BILLIONS)
      1. \r\nTABLE
    5. NORTH AMERICA ION EXCHANGE RESINS MARKET SIZE ESTIMATES & FORECAST, BY APPLICATION,
      1. \r\nTABLE 4. NORTH AMERICA ION EXCHANGE RESINS MARKET
      2. SIZE ESTIMATES & FORECAST, BY END USE INDUSTRY, 2019-2032 (USD BILLIONS)
      3. \r\nTABLE
    6. NORTH AMERICA ION EXCHANGE RESINS MARKET SIZE ESTIMATES & FORECAST, BY FORM,
      1. \r\nTABLE 6. NORTH AMERICA ION EXCHANGE RESINS MARKET
      2. SIZE ESTIMATES & FORECAST, BY REGIONAL, 2019-2032 (USD BILLIONS)
      3. \r\nTABLE 7. US ION EXCHANGE RESINS
    7. MARKET SIZE ESTIMATES & FORECAST, BY TYPE, 2019-2032 (USD BILLIONS)
      1. \r\nTABLE 8. US ION EXCHANGE RESINS
    8. MARKET SIZE ESTIMATES & FORECAST, BY APPLICATION, 2019-2032 (USD BILLIONS)
      1. \r\nTABLE
    9. US ION EXCHANGE RESINS MARKET SIZE ESTIMATES & FORECAST, BY END USE INDUSTRY,
      1. \r\nTABLE 10. US ION EXCHANGE RESINS MARKET SIZE ESTIMATES
      2. & FORECAST, BY FORM, 2019-2032 (USD BILLIONS)
      3. \r\nTABLE 11. US ION EXCHANGE RESINS
    10. MARKET SIZE ESTIMATES & FORECAST, BY REGIONAL, 2019-2032 (USD BILLIONS)
      1. \r\nTABLE
    11. CANADA ION EXCHANGE RESINS MARKET SIZE ESTIMATES & FORECAST, BY TYPE, 2019-2032
      1. (USD BILLIONS)
      2. \r\nTABLE 13. CANADA ION EXCHANGE RESINS MARKET SIZE ESTIMATES & FORECAST,
      3. BY APPLICATION, 2019-2032 (USD BILLIONS)
      4. \r\nTABLE 14. CANADA ION EXCHANGE RESINS MARKET SIZE
      5. ESTIMATES & FORECAST, BY END USE INDUSTRY, 2019-2032 (USD BILLIONS)
      6. \r\nTABLE 15. CANADA ION EXCHANGE
    12. RESINS MARKET SIZE ESTIMATES & FORECAST, BY FORM, 2019-2032 (USD BILLIONS)
      1. \r\nTABLE
    13. CANADA ION EXCHANGE RESINS MARKET SIZE ESTIMATES & FORECAST, BY REGIONAL,
      1. \r\nTABLE 17. EUROPE ION EXCHANGE RESINS MARKET SIZE
      2. ESTIMATES & FORECAST, BY TYPE, 2019-2032 (USD BILLIONS)
      3. \r\nTABLE 18. EUROPE ION EXCHANGE
    14. RESINS MARKET SIZE ESTIMATES & FORECAST, BY APPLICATION, 2019-2032 (USD BILLIONS)
      1. \r\nTABLE
    15. EUROPE ION EXCHANGE RESINS MARKET SIZE ESTIMATES & FORECAST, BY END USE
      1. INDUSTRY, 2019-2032 (USD BILLIONS)
      2. \r\nTABLE 20. EUROPE ION EXCHANGE RESINS MARKET SIZE
      3. ESTIMATES & FORECAST, BY FORM, 2019-2032 (USD BILLIONS)
      4. \r\nTABLE 21. EUROPE ION EXCHANGE
    16. RESINS MARKET SIZE ESTIMATES & FORECAST, BY REGIONAL, 2019-2032 (USD BILLIONS)
      1. \r\nTABLE
    17. GERMANY ION EXCHANGE RESINS MARKET SIZE ESTIMATES & FORECAST, BY TYPE, 2019-2032
      1. (USD BILLIONS)
      2. \r\nTABLE 23. GERMANY ION EXCHANGE RESINS MARKET SIZE ESTIMATES &
      3. FORECAST, BY APPLICATION, 2019-2032 (USD BILLIONS)
      4. \r\nTABLE 24. GERMANY ION EXCHANGE
    18. RESINS MARKET SIZE ESTIMATES & FORECAST, BY END USE INDUSTRY, 2019-2032 (USD
      1. BILLIONS)
      2. \r\nTABLE 25. GERMANY ION EXCHANGE RESINS MARKET SIZE ESTIMATES &
      3. FORECAST, BY FORM, 2019-2032 (USD BILLIONS)
      4. \r\nTABLE 26. GERMANY ION EXCHANGE
    19. RESINS MARKET SIZE ESTIMATES & FORECAST, BY REGIONAL, 2019-2032 (USD BILLIONS)
      1. \r\nTABLE
    20. UK ION EXCHANGE RESINS MARKET SIZE ESTIMATES & FORECAST, BY TYPE, 2019-2032
      1. (USD BILLIONS)
      2. \r\nTABLE 28. UK ION EXCHANGE RESINS MARKET SIZE ESTIMATES & FORECAST,
      3. BY APPLICATION, 2019-2032 (USD BILLIONS)
      4. \r\nTABLE 29. UK ION EXCHANGE RESINS MARKET SIZE ESTIMATES
      5. & FORECAST, BY END USE INDUSTRY, 2019-2032 (USD BILLIONS)
      6. \r\nTABLE 30. UK ION EXCHANGE RESINS
    21. MARKET SIZE ESTIMATES & FORECAST, BY FORM, 2019-2032 (USD BILLIONS)
      1. \r\nTABLE 31. UK ION EXCHANGE RESINS
    22. MARKET SIZE ESTIMATES & FORECAST, BY REGIONAL, 2019-2032 (USD BILLIONS)
      1. \r\nTABLE
    23. FRANCE ION EXCHANGE RESINS MARKET SIZE ESTIMATES & FORECAST, BY TYPE, 2019-2032
      1. (USD BILLIONS)
      2. \r\nTABLE 33. FRANCE ION EXCHANGE RESINS MARKET SIZE ESTIMATES & FORECAST,
      3. BY APPLICATION, 2019-2032 (USD BILLIONS)
      4. \r\nTABLE 34. FRANCE ION EXCHANGE RESINS MARKET SIZE
      5. ESTIMATES & FORECAST, BY END USE INDUSTRY, 2019-2032 (USD BILLIONS)
      6. \r\nTABLE 35. FRANCE ION EXCHANGE
    24. RESINS MARKET SIZE ESTIMATES & FORECAST, BY FORM, 2019-2032 (USD BILLIONS)
      1. \r\nTABLE
    25. FRANCE ION EXCHANGE RESINS MARKET SIZE ESTIMATES & FORECAST, BY REGIONAL,
      1. \r\nTABLE 37. RUSSIA ION EXCHANGE RESINS MARKET SIZE
      2. ESTIMATES & FORECAST, BY TYPE, 2019-2032 (USD BILLIONS)
      3. \r\nTABLE 38. RUSSIA ION EXCHANGE
    26. RESINS MARKET SIZE ESTIMATES & FORECAST, BY APPLICATION, 2019-2032 (USD BILLIONS)
      1. \r\nTABLE
    27. RUSSIA ION EXCHANGE RESINS MARKET SIZE ESTIMATES & FORECAST, BY END USE
      1. INDUSTRY, 2019-2032 (USD BILLIONS)
      2. \r\nTABLE 40. RUSSIA ION EXCHANGE RESINS MARKET SIZE
      3. ESTIMATES & FORECAST, BY FORM, 2019-2032 (USD BILLIONS)
      4. \r\nTABLE 41. RUSSIA ION EXCHANGE
    28. RESINS MARKET SIZE ESTIMATES & FORECAST, BY REGIONAL, 2019-2032 (USD BILLIONS)
      1. \r\nTABLE
    29. ITALY ION EXCHANGE RESINS MARKET SIZE ESTIMATES & FORECAST, BY TYPE, 2019-2032
      1. (USD BILLIONS)
      2. \r\nTABLE 43. ITALY ION EXCHANGE RESINS MARKET SIZE ESTIMATES & FORECAST,
      3. BY APPLICATION, 2019-2032 (USD BILLIONS)
      4. \r\nTABLE 44. ITALY ION EXCHANGE RESINS MARKET SIZE
      5. ESTIMATES & FORECAST, BY END USE INDUSTRY, 2019-2032 (USD BILLIONS)
      6. \r\nTABLE 45. ITALY ION EXCHANGE
    30. RESINS MARKET SIZE ESTIMATES & FORECAST, BY FORM, 2019-2032 (USD BILLIONS)
      1. \r\nTABLE
    31. ITALY ION EXCHANGE RESINS MARKET SIZE ESTIMATES & FORECAST, BY REGIONAL,
      1. \r\nTABLE 47. SPAIN ION EXCHANGE RESINS MARKET SIZE
      2. ESTIMATES & FORECAST, BY TYPE, 2019-2032 (USD BILLIONS)
      3. \r\nTABLE 48. SPAIN ION EXCHANGE
    32. RESINS MARKET SIZE ESTIMATES & FORECAST, BY APPLICATION, 2019-2032 (USD BILLIONS)
      1. \r\nTABLE
    33. SPAIN ION EXCHANGE RESINS MARKET SIZE ESTIMATES & FORECAST, BY END USE INDUSTRY,
      1. \r\nTABLE 50. SPAIN ION EXCHANGE RESINS MARKET SIZE
      2. ESTIMATES & FORECAST, BY FORM, 2019-2032 (USD BILLIONS)
      3. \r\nTABLE 51. SPAIN ION EXCHANGE
    34. RESINS MARKET SIZE ESTIMATES & FORECAST, BY REGIONAL, 2019-2032 (USD BILLIONS)
      1. \r\nTABLE
    35. REST OF EUROPE ION EXCHANGE RESINS MARKET SIZE ESTIMATES & FORECAST, BY
      1. TYPE, 2019-2032 (USD BILLIONS)
      2. \r\nTABLE 53. REST OF EUROPE ION EXCHANGE RESINS MARKET
      3. SIZE ESTIMATES & FORECAST, BY APPLICATION, 2019-2032 (USD BILLIONS)
      4. \r\nTABLE 54. REST OF EUROPE ION
    36. EXCHANGE RESINS MARKET SIZE ESTIMATES & FORECAST, BY END USE INDUSTRY, 2019-2032
      1. (USD BILLIONS)
      2. \r\nTABLE 55. REST OF EUROPE ION EXCHANGE RESINS MARKET SIZE ESTIMATES
      3. & FORECAST, BY FORM, 2019-2032 (USD BILLIONS)
      4. \r\nTABLE 56. REST OF EUROPE ION
    37. EXCHANGE RESINS MARKET SIZE ESTIMATES & FORECAST, BY REGIONAL, 2019-2032 (USD
      1. BILLIONS)
      2. \r\nTABLE 57. APAC ION EXCHANGE RESINS MARKET SIZE ESTIMATES & FORECAST,
      3. BY TYPE, 2019-2032 (USD BILLIONS)
      4. \r\nTABLE 58. APAC ION EXCHANGE RESINS MARKET SIZE ESTIMATES
      5. & FORECAST, BY APPLICATION, 2019-2032 (USD BILLIONS)
      6. \r\nTABLE 59. APAC ION EXCHANGE
    38. RESINS MARKET SIZE ESTIMATES & FORECAST, BY END USE INDUSTRY, 2019-2032 (USD
      1. BILLIONS)
      2. \r\nTABLE 60. APAC ION EXCHANGE RESINS MARKET SIZE ESTIMATES & FORECAST,
      3. BY FORM, 2019-2032 (USD BILLIONS)
      4. \r\nTABLE 61. APAC ION EXCHANGE RESINS MARKET SIZE ESTIMATES
      5. & FORECAST, BY REGIONAL, 2019-2032 (USD BILLIONS)
      6. \r\nTABLE 62. CHINA ION EXCHANGE
    39. RESINS MARKET SIZE ESTIMATES & FORECAST, BY TYPE, 2019-2032 (USD BILLIONS)
      1. \r\nTABLE
    40. CHINA ION EXCHANGE RESINS MARKET SIZE ESTIMATES & FORECAST, BY APPLICATION,
      1. \r\nTABLE 64. CHINA ION EXCHANGE RESINS MARKET SIZE
      2. ESTIMATES & FORECAST, BY END USE INDUSTRY, 2019-2032 (USD BILLIONS)
      3. \r\nTABLE 65. CHINA ION EXCHANGE
    41. RESINS MARKET SIZE ESTIMATES & FORECAST, BY FORM, 2019-2032 (USD BILLIONS)
      1. \r\nTABLE
    42. CHINA ION EXCHANGE RESINS MARKET SIZE ESTIMATES & FORECAST, BY REGIONAL,
      1. \r\nTABLE 67. INDIA ION EXCHANGE RESINS MARKET SIZE
      2. ESTIMATES & FORECAST, BY TYPE, 2019-2032 (USD BILLIONS)
      3. \r\nTABLE 68. INDIA ION EXCHANGE
    43. RESINS MARKET SIZE ESTIMATES & FORECAST, BY APPLICATION, 2019-2032 (USD BILLIONS)
      1. \r\nTABLE
    44. INDIA ION EXCHANGE RESINS MARKET SIZE ESTIMATES & FORECAST, BY END USE INDUSTRY,
      1. \r\nTABLE 70. INDIA ION EXCHANGE RESINS MARKET SIZE
      2. ESTIMATES & FORECAST, BY FORM, 2019-2032 (USD BILLIONS)
      3. \r\nTABLE 71. INDIA ION EXCHANGE
    45. RESINS MARKET SIZE ESTIMATES & FORECAST, BY REGIONAL, 2019-2032 (USD BILLIONS)
      1. \r\nTABLE
    46. JAPAN ION EXCHANGE RESINS MARKET SIZE ESTIMATES & FORECAST, BY TYPE, 2019-2032
      1. (USD BILLIONS)
      2. \r\nTABLE 73. JAPAN ION EXCHANGE RESINS MARKET SIZE ESTIMATES & FORECAST,
      3. BY APPLICATION, 2019-2032 (USD BILLIONS)
      4. \r\nTABLE 74. JAPAN ION EXCHANGE RESINS MARKET SIZE
      5. ESTIMATES & FORECAST, BY END USE INDUSTRY, 2019-2032 (USD BILLIONS)
      6. \r\nTABLE 75. JAPAN ION EXCHANGE
    47. RESINS MARKET SIZE ESTIMATES & FORECAST, BY FORM, 2019-2032 (USD BILLIONS)
      1. \r\nTABLE
    48. JAPAN ION EXCHANGE RESINS MARKET SIZE ESTIMATES & FORECAST, BY REGIONAL,
      1. \r\nTABLE 77. SOUTH KOREA ION EXCHANGE RESINS MARKET
      2. SIZE ESTIMATES & FORECAST, BY TYPE, 2019-2032 (USD BILLIONS)
      3. \r\nTABLE 78. SOUTH KOREA ION EXCHANGE
    49. RESINS MARKET SIZE ESTIMATES & FORECAST, BY APPLICATION, 2019-2032 (USD BILLIONS)
      1. \r\nTABLE
    50. SOUTH KOREA ION EXCHANGE RESINS MARKET SIZE ESTIMATES & FORECAST, BY END
      1. USE INDUSTRY, 2019-2032 (USD BILLIONS)
      2. \r\nTABLE 80. SOUTH KOREA ION EXCHANGE RESINS MARKET
      3. SIZE ESTIMATES & FORECAST, BY FORM, 2019-2032 (USD BILLIONS)
      4. \r\nTABLE 81. SOUTH KOREA ION EXCHANGE
    51. RESINS MARKET SIZE ESTIMATES & FORECAST, BY REGIONAL, 2019-2032 (USD BILLIONS)
      1. \r\nTABLE
    52. MALAYSIA ION EXCHANGE RESINS MARKET SIZE ESTIMATES & FORECAST, BY TYPE,
      1. \r\nTABLE 83. MALAYSIA ION EXCHANGE RESINS MARKET SIZE
      2. ESTIMATES & FORECAST, BY APPLICATION, 2019-2032 (USD BILLIONS)
      3. \r\nTABLE 84. MALAYSIA ION EXCHANGE
    53. RESINS MARKET SIZE ESTIMATES & FORECAST, BY END USE INDUSTRY, 2019-2032 (USD
      1. BILLIONS)
      2. \r\nTABLE 85. MALAYSIA ION EXCHANGE RESINS MARKET SIZE ESTIMATES &
      3. FORECAST, BY FORM, 2019-2032 (USD BILLIONS)
      4. \r\nTABLE 86. MALAYSIA ION EXCHANGE
    54. RESINS MARKET SIZE ESTIMATES & FORECAST, BY REGIONAL, 2019-2032 (USD BILLIONS)
      1. \r\nTABLE
    55. THAILAND ION EXCHANGE RESINS MARKET SIZE ESTIMATES & FORECAST, BY TYPE,
      1. \r\nTABLE 88. THAILAND ION EXCHANGE RESINS MARKET SIZE
      2. ESTIMATES & FORECAST, BY APPLICATION, 2019-2032 (USD BILLIONS)
      3. \r\nTABLE 89. THAILAND ION EXCHANGE
    56. RESINS MARKET SIZE ESTIMATES & FORECAST, BY END USE INDUSTRY, 2019-2032 (USD
      1. BILLIONS)
      2. \r\nTABLE 90. THAILAND ION EXCHANGE RESINS MARKET SIZE ESTIMATES &
      3. FORECAST, BY FORM, 2019-2032 (USD BILLIONS)
      4. \r\nTABLE 91. THAILAND ION EXCHANGE
    57. RESINS MARKET SIZE ESTIMATES & FORECAST, BY REGIONAL, 2019-2032 (USD BILLIONS)
      1. \r\nTABLE
    58. INDONESIA ION EXCHANGE RESINS MARKET SIZE ESTIMATES & FORECAST, BY TYPE,
      1. \r\nTABLE 93. INDONESIA ION EXCHANGE RESINS MARKET SIZE
      2. ESTIMATES & FORECAST, BY APPLICATION, 2019-2032 (USD BILLIONS)
      3. \r\nTABLE 94. INDONESIA ION EXCHANGE
    59. RESINS MARKET SIZE ESTIMATES & FORECAST, BY END USE INDUSTRY, 2019-2032 (USD
      1. BILLIONS)
      2. \r\nTABLE 95. INDONESIA ION EXCHANGE RESINS MARKET SIZE ESTIMATES &
      3. FORECAST, BY FORM, 2019-2032 (USD BILLIONS)
      4. \r\nTABLE 96. INDONESIA ION EXCHANGE
    60. RESINS MARKET SIZE ESTIMATES & FORECAST, BY REGIONAL, 2019-2032 (USD BILLIONS)
      1. \r\nTABLE
    61. REST OF APAC ION EXCHANGE RESINS MARKET SIZE ESTIMATES & FORECAST, BY TYPE,
      1. \r\nTABLE 98. REST OF APAC ION EXCHANGE RESINS MARKET
      2. SIZE ESTIMATES & FORECAST, BY APPLICATION, 2019-2032 (USD BILLIONS)
      3. \r\nTABLE 99. REST OF APAC ION
    62. EXCHANGE RESINS MARKET SIZE ESTIMATES & FORECAST, BY END USE INDUSTRY, 2019-2032
      1. (USD BILLIONS)
      2. \r\nTABLE 100. REST OF APAC ION EXCHANGE RESINS MARKET SIZE ESTIMATES
      3. & FORECAST, BY FORM, 2019-2032 (USD BILLIONS)
      4. \r\nTABLE 101. REST OF APAC ION
    63. EXCHANGE RESINS MARKET SIZE ESTIMATES & FORECAST, BY REGIONAL, 2019-2032 (USD
      1. BILLIONS)
      2. \r\nTABLE 102. SOUTH AMERICA ION EXCHANGE RESINS MARKET SIZE ESTIMATES
      3. & FORECAST, BY TYPE, 2019-2032 (USD BILLIONS)
      4. \r\nTABLE 103. SOUTH AMERICA ION
    64. EXCHANGE RESINS MARKET SIZE ESTIMATES & FORECAST, BY APPLICATION, 2019-2032
      1. (USD BILLIONS)
      2. \r\nTABLE 104. SOUTH AMERICA ION EXCHANGE RESINS MARKET SIZE ESTIMATES
      3. & FORECAST, BY END USE INDUSTRY, 2019-2032 (USD BILLIONS)
      4. \r\nTABLE 105. SOUTH AMERICA ION
    65. EXCHANGE RESINS MARKET SIZE ESTIMATES & FORECAST, BY FORM, 2019-2032 (USD BILLIONS)
      1. \r\nTABLE
    66. SOUTH AMERICA ION EXCHANGE RESINS MARKET SIZE ESTIMATES & FORECAST, BY
      1. REGIONAL, 2019-2032 (USD BILLIONS)
      2. \r\nTABLE 107. BRAZIL ION EXCHANGE RESINS MARKET SIZE
      3. ESTIMATES & FORECAST, BY TYPE, 2019-2032 (USD BILLIONS)
      4. \r\nTABLE 108. BRAZIL ION EXCHANGE
    67. RESINS MARKET SIZE ESTIMATES & FORECAST, BY APPLICATION, 2019-2032 (USD BILLIONS)
      1. \r\nTABLE
    68. BRAZIL ION EXCHANGE RESINS MARKET SIZE ESTIMATES & FORECAST, BY END USE
      1. INDUSTRY, 2019-2032 (USD BILLIONS)
      2. \r\nTABLE 110. BRAZIL ION EXCHANGE RESINS MARKET SIZE
      3. ESTIMATES & FORECAST, BY FORM, 2019-2032 (USD BILLIONS)
      4. \r\nTABLE 111. BRAZIL ION EXCHANGE
    69. RESINS MARKET SIZE ESTIMATES & FORECAST, BY REGIONAL, 2019-2032 (USD BILLIONS)
      1. \r\nTABLE
    70. MEXICO ION EXCHANGE RESINS MARKET SIZE ESTIMATES & FORECAST, BY TYPE, 2019-2032
      1. (USD BILLIONS)
      2. \r\nTABLE 113. MEXICO ION EXCHANGE RESINS MARKET SIZE ESTIMATES &
      3. FORECAST, BY APPLICATION, 2019-2032 (USD BILLIONS)
      4. \r\nTABLE 114. MEXICO ION EXCHANGE
    71. RESINS MARKET SIZE ESTIMATES & FORECAST, BY END USE INDUSTRY, 2019-2032 (USD
      1. BILLIONS)
      2. \r\nTABLE 115. MEXICO ION EXCHANGE RESINS MARKET SIZE ESTIMATES &
      3. FORECAST, BY FORM, 2019-2032 (USD BILLIONS)
      4. \r\nTABLE 116. MEXICO ION EXCHANGE
    72. RESINS MARKET SIZE ESTIMATES & FORECAST, BY REGIONAL, 2019-2032 (USD BILLIONS)
      1. \r\nTABLE
    73. ARGENTINA ION EXCHANGE RESINS MARKET SIZE ESTIMATES & FORECAST, BY TYPE,
      1. \r\nTABLE 118. ARGENTINA ION EXCHANGE RESINS MARKET
      2. SIZE ESTIMATES & FORECAST, BY APPLICATION, 2019-2032 (USD BILLIONS)
      3. \r\nTABLE 119. ARGENTINA ION EXCHANGE
    74. RESINS MARKET SIZE ESTIMATES & FORECAST, BY END USE INDUSTRY, 2019-2032 (USD
      1. BILLIONS)
      2. \r\nTABLE 120. ARGENTINA ION EXCHANGE RESINS MARKET SIZE ESTIMATES &
      3. FORECAST, BY FORM, 2019-2032 (USD BILLIONS)
      4. \r\nTABLE 121. ARGENTINA ION EXCHANGE
    75. RESINS MARKET SIZE ESTIMATES & FORECAST, BY REGIONAL, 2019-2032 (USD BILLIONS)
      1. \r\nTABLE
    76. REST OF SOUTH AMERICA ION EXCHANGE RESINS MARKET SIZE ESTIMATES & FORECAST,
      1. BY TYPE, 2019-2032 (USD BILLIONS)
      2. \r\nTABLE 123. REST OF SOUTH AMERICA ION EXCHANGE RESINS
    77. MARKET SIZE ESTIMATES & FORECAST, BY APPLICATION, 2019-2032 (USD BILLIONS)
      1. \r\nTABLE
    78. REST OF SOUTH AMERICA ION EXCHANGE RESINS MARKET SIZE ESTIMATES & FORECAST,
      1. BY END USE INDUSTRY, 2019-2032 (USD BILLIONS)
      2. \r\nTABLE 125. REST OF SOUTH AMERICA
    79. ION EXCHANGE RESINS MARKET SIZE ESTIMATES & FORECAST, BY FORM, 2019-2032 (USD
      1. BILLIONS)
      2. \r\nTABLE 126. REST OF SOUTH AMERICA ION EXCHANGE RESINS MARKET SIZE ESTIMATES
      3. & FORECAST, BY REGIONAL, 2019-2032 (USD BILLIONS)
      4. \r\nTABLE 127. MEA ION EXCHANGE
    80. RESINS MARKET SIZE ESTIMATES & FORECAST, BY TYPE, 2019-2032 (USD BILLIONS)
      1. \r\nTABLE
    81. MEA ION EXCHANGE RESINS MARKET SIZE ESTIMATES & FORECAST, BY APPLICATION,
      1. \r\nTABLE 129. MEA ION EXCHANGE RESINS MARKET SIZE ESTIMATES
      2. & FORECAST, BY END USE INDUSTRY, 2019-2032 (USD BILLIONS)
      3. \r\nTABLE 130. MEA ION EXCHANGE
    82. RESINS MARKET SIZE ESTIMATES & FORECAST, BY FORM, 2019-2032 (USD BILLIONS)
      1. \r\nTABLE
    83. MEA ION EXCHANGE RESINS MARKET SIZE ESTIMATES & FORECAST, BY REGIONAL,
      1. \r\nTABLE 132. GCC COUNTRIES ION EXCHANGE RESINS MARKET
      2. SIZE ESTIMATES & FORECAST, BY TYPE, 2019-2032 (USD BILLIONS)
      3. \r\nTABLE 133. GCC COUNTRIES ION
    84. EXCHANGE RESINS MARKET SIZE ESTIMATES & FORECAST, BY APPLICATION, 2019-2032
      1. (USD BILLIONS)
      2. \r\nTABLE 134. GCC COUNTRIES ION EXCHANGE RESINS MARKET SIZE ESTIMATES
      3. & FORECAST, BY END USE INDUSTRY, 2019-2032 (USD BILLIONS)
      4. \r\nTABLE 135. GCC COUNTRIES ION
    85. EXCHANGE RESINS MARKET SIZE ESTIMATES & FORECAST, BY FORM, 2019-2032 (USD BILLIONS)
      1. \r\nTABLE
    86. GCC COUNTRIES ION EXCHANGE RESINS MARKET SIZE ESTIMATES & FORECAST, BY
      1. REGIONAL, 2019-2032 (USD BILLIONS)
      2. \r\nTABLE 137. SOUTH AFRICA ION EXCHANGE RESINS MARKET
      3. SIZE ESTIMATES & FORECAST, BY TYPE, 2019-2032 (USD BILLIONS)
      4. \r\nTABLE 138. SOUTH AFRICA ION
    87. EXCHANGE RESINS MARKET SIZE ESTIMATES & FORECAST, BY APPLICATION, 2019-2032
      1. (USD BILLIONS)
      2. \r\nTABLE 139. SOUTH AFRICA ION EXCHANGE RESINS MARKET SIZE ESTIMATES
      3. & FORECAST, BY END USE INDUSTRY, 2019-2032 (USD BILLIONS)
      4. \r\nTABLE 140. SOUTH AFRICA ION
    88. EXCHANGE RESINS MARKET SIZE ESTIMATES & FORECAST, BY FORM, 2019-2032 (USD BILLIONS)
      1. \r\nTABLE
    89. SOUTH AFRICA ION EXCHANGE RESINS MARKET SIZE ESTIMATES & FORECAST, BY REGIONAL,
      1. \r\nTABLE 142. REST OF MEA ION EXCHANGE RESINS MARKET
      2. SIZE ESTIMATES & FORECAST, BY TYPE, 2019-2032 (USD BILLIONS)
      3. \r\nTABLE 143. REST OF MEA ION
    90. EXCHANGE RESINS MARKET SIZE ESTIMATES & FORECAST, BY APPLICATION, 2019-2032
      1. (USD BILLIONS)
      2. \r\nTABLE 144. REST OF MEA ION EXCHANGE RESINS MARKET SIZE ESTIMATES &
      3. FORECAST, BY END USE INDUSTRY, 2019-2032 (USD BILLIONS)
      4. \r\nTABLE 145. REST OF MEA ION
    91. EXCHANGE RESINS MARKET SIZE ESTIMATES & FORECAST, BY FORM, 2019-2032 (USD BILLIONS)
      1. \r\nTABLE
    92. REST OF MEA ION EXCHANGE RESINS MARKET SIZE ESTIMATES & FORECAST, BY REGIONAL,
      1. \r\nTABLE 147. PRODUCT LAUNCH/PRODUCT DEVELOPMENT/APPROVAL
      2. \r\nTABLE
    93. ACQUISITION/PARTNERSHIP
      1. \r\n
      2. \r\n
      3. \r\n
      4. \r\n
      5. \r\n
      6. \r\n
      7. \r\n
      8. \r\n
      9. \r\n
      10. \r\n
      11. \r\n
      12. \r\n
      13. \r\n
      14. \r\n
      15. \r\n
      16. \r\n
      17. \r\n
      18. \r\n
      19. \r\n
      20. \r\n
      21. \r\n
      22. \r\n
      23. \r\n
      24. \r\n
      25. \r\n
      26. \r\n
      27. \r\n
      28. \r\n
      29. \r\n
      30. \r\nLIST OF FIGURES
      31. \r\n
      32. \r\nFIGURE 1. MARKET SYNOPSIS
      33. \r\nFIGURE 2. NORTH AMERICA ION
    94. EXCHANGE RESINS MARKET ANALYSIS
      1. \r\nFIGURE 3. US ION EXCHANGE RESINS MARKET ANALYSIS
      2. BY TYPE
      3. \r\nFIGURE
    95. US ION EXCHANGE RESINS MARKET ANALYSIS BY APPLICATION
      1. \r\nFIGURE 5. US ION EXCHANGE RESINS
      2. MARKET ANALYSIS BY END USE INDUSTRY
      3. \r\nFIGURE 6. US ION EXCHANGE RESINS MARKET ANALYSIS
      4. BY FORM
      5. \r\nFIGURE
    96. US ION EXCHANGE RESINS MARKET ANALYSIS BY REGIONAL
      1. \r\nFIGURE 8. CANADA ION EXCHANGE
      2. RESINS MARKET ANALYSIS BY TYPE
      3. \r\nFIGURE 9. CANADA ION EXCHANGE RESINS MARKET ANALYSIS
      4. BY APPLICATION
      5. \r\nFIGURE 10. CANADA ION EXCHANGE RESINS MARKET ANALYSIS BY END USE INDUSTRY
      6. \r\nFIGURE 11. CANADA ION EXCHANGE
      7. RESINS MARKET ANALYSIS BY FORM
      8. \r\nFIGURE 12. CANADA ION EXCHANGE RESINS MARKET ANALYSIS
      9. BY REGIONAL
      10. \r\nFIGURE 13. EUROPE ION EXCHANGE RESINS MARKET ANALYSIS
      11. \r\nFIGURE 14. GERMANY ION EXCHANGE
      12. RESINS MARKET ANALYSIS BY TYPE
      13. \r\nFIGURE 15. GERMANY ION EXCHANGE RESINS MARKET ANALYSIS
      14. BY APPLICATION
      15. \r\nFIGURE 16. GERMANY ION EXCHANGE RESINS MARKET ANALYSIS BY END USE
      16. INDUSTRY
      17. \r\nFIGURE
    97. GERMANY ION EXCHANGE RESINS MARKET ANALYSIS BY FORM
      1. \r\nFIGURE 18. GERMANY ION EXCHANGE
      2. RESINS MARKET ANALYSIS BY REGIONAL
      3. \r\nFIGURE 19. UK ION EXCHANGE RESINS MARKET ANALYSIS
      4. BY TYPE
      5. \r\nFIGURE
    98. UK ION EXCHANGE RESINS MARKET ANALYSIS BY APPLICATION
      1. \r\nFIGURE 21. UK ION EXCHANGE
      2. RESINS MARKET ANALYSIS BY END USE INDUSTRY
      3. \r\nFIGURE 22. UK ION EXCHANGE RESINS MARKET ANALYSIS
      4. BY FORM
      5. \r\nFIGURE
    99. UK ION EXCHANGE RESINS MARKET ANALYSIS BY REGIONAL
      1. \r\nFIGURE 24. FRANCE ION EXCHANGE
      2. RESINS MARKET ANALYSIS BY TYPE
      3. \r\nFIGURE 25. FRANCE ION EXCHANGE RESINS MARKET ANALYSIS
      4. BY APPLICATION
      5. \r\nFIGURE 26. FRANCE ION EXCHANGE RESINS MARKET ANALYSIS BY END USE INDUSTRY
      6. \r\nFIGURE 27. FRANCE ION EXCHANGE
      7. RESINS MARKET ANALYSIS BY FORM
      8. \r\nFIGURE 28. FRANCE ION EXCHANGE RESINS MARKET ANALYSIS
      9. BY REGIONAL
      10. \r\nFIGURE 29. RUSSIA ION EXCHANGE RESINS MARKET ANALYSIS BY TYPE
      11. \r\nFIGURE 30. RUSSIA ION EXCHANGE
      12. RESINS MARKET ANALYSIS BY APPLICATION
      13. \r\nFIGURE 31. RUSSIA ION EXCHANGE RESINS MARKET ANALYSIS
      14. BY END USE INDUSTRY
      15. \r\nFIGURE 32. RUSSIA ION EXCHANGE RESINS MARKET ANALYSIS BY FORM
      16. \r\nFIGURE 33. RUSSIA ION EXCHANGE
      17. RESINS MARKET ANALYSIS BY REGIONAL
      18. \r\nFIGURE 34. ITALY ION EXCHANGE RESINS MARKET ANALYSIS
      19. BY TYPE
      20. \r\nFIGURE
    100. ITALY ION EXCHANGE RESINS MARKET ANALYSIS BY APPLICATION
      1. \r\nFIGURE 36. ITALY ION EXCHANGE
      2. RESINS MARKET ANALYSIS BY END USE INDUSTRY
      3. \r\nFIGURE 37. ITALY ION EXCHANGE RESINS MARKET ANALYSIS
      4. BY FORM
      5. \r\nFIGURE
    101. ITALY ION EXCHANGE RESINS MARKET ANALYSIS BY REGIONAL
      1. \r\nFIGURE 39. SPAIN ION EXCHANGE
      2. RESINS MARKET ANALYSIS BY TYPE
      3. \r\nFIGURE 40. SPAIN ION EXCHANGE RESINS MARKET ANALYSIS
      4. BY APPLICATION
      5. \r\nFIGURE 41. SPAIN ION EXCHANGE RESINS MARKET ANALYSIS BY END USE INDUSTRY
      6. \r\nFIGURE 42. SPAIN ION EXCHANGE
      7. RESINS MARKET ANALYSIS BY FORM
      8. \r\nFIGURE 43. SPAIN ION EXCHANGE RESINS MARKET ANALYSIS
      9. BY REGIONAL
      10. \r\nFIGURE 44. REST OF EUROPE ION EXCHANGE RESINS MARKET ANALYSIS BY TYPE
      11. \r\nFIGURE 45. REST OF EUROPE ION
      12. EXCHANGE RESINS MARKET ANALYSIS BY APPLICATION
      13. \r\nFIGURE 46. REST OF EUROPE ION EXCHANGE RESINS MARKET
      14. ANALYSIS BY END USE INDUSTRY
      15. \r\nFIGURE 47. REST OF EUROPE ION EXCHANGE RESINS MARKET ANALYSIS
      16. BY FORM
      17. \r\nFIGURE
    102. REST OF EUROPE ION EXCHANGE RESINS MARKET ANALYSIS BY REGIONAL
      1. \r\nFIGURE 49. APAC ION EXCHANGE
    103. RESINS MARKET ANALYSIS
      1. \r\nFIGURE 50. CHINA ION EXCHANGE RESINS MARKET ANALYSIS BY
      2. TYPE
      3. \r\nFIGURE
    104. CHINA ION EXCHANGE RESINS MARKET ANALYSIS BY APPLICATION
      1. \r\nFIGURE 52. CHINA ION EXCHANGE
      2. RESINS MARKET ANALYSIS BY END USE INDUSTRY
      3. \r\nFIGURE 53. CHINA ION EXCHANGE RESINS MARKET ANALYSIS
      4. BY FORM
      5. \r\nFIGURE
    105. CHINA ION EXCHANGE RESINS MARKET ANALYSIS BY REGIONAL
      1. \r\nFIGURE 55. INDIA ION EXCHANGE
      2. RESINS MARKET ANALYSIS BY TYPE
      3. \r\nFIGURE 56. INDIA ION EXCHANGE RESINS MARKET ANALYSIS
      4. BY APPLICATION
      5. \r\nFIGURE 57. INDIA ION EXCHANGE RESINS MARKET ANALYSIS BY END USE INDUSTRY
      6. \r\nFIGURE 58. INDIA ION EXCHANGE
      7. RESINS MARKET ANALYSIS BY FORM
      8. \r\nFIGURE 59. INDIA ION EXCHANGE RESINS MARKET ANALYSIS
      9. BY REGIONAL
      10. \r\nFIGURE 60. JAPAN ION EXCHANGE RESINS MARKET ANALYSIS BY TYPE
      11. \r\nFIGURE 61. JAPAN ION EXCHANGE
      12. RESINS MARKET ANALYSIS BY APPLICATION
      13. \r\nFIGURE 62. JAPAN ION EXCHANGE RESINS MARKET ANALYSIS
      14. BY END USE INDUSTRY
      15. \r\nFIGURE 63. JAPAN ION EXCHANGE RESINS MARKET ANALYSIS BY FORM
      16. \r\nFIGURE 64. JAPAN ION EXCHANGE
      17. RESINS MARKET ANALYSIS BY REGIONAL
      18. \r\nFIGURE 65. SOUTH KOREA ION EXCHANGE RESINS MARKET
      19. ANALYSIS BY TYPE
      20. \r\nFIGURE 66. SOUTH KOREA ION EXCHANGE RESINS MARKET ANALYSIS BY APPLICATION
      21. \r\nFIGURE 67. SOUTH KOREA ION
      22. EXCHANGE RESINS MARKET ANALYSIS BY END USE INDUSTRY
      23. \r\nFIGURE 68. SOUTH KOREA ION
      24. EXCHANGE RESINS MARKET ANALYSIS BY FORM
      25. \r\nFIGURE 69. SOUTH KOREA ION EXCHANGE RESINS MARKET
      26. ANALYSIS BY REGIONAL
      27. \r\nFIGURE 70. MALAYSIA ION EXCHANGE RESINS MARKET ANALYSIS BY TYPE
      28. \r\nFIGURE 71. MALAYSIA ION EXCHANGE
      29. RESINS MARKET ANALYSIS BY APPLICATION
      30. \r\nFIGURE 72. MALAYSIA ION EXCHANGE RESINS MARKET ANALYSIS
      31. BY END USE INDUSTRY
      32. \r\nFIGURE 73. MALAYSIA ION EXCHANGE RESINS MARKET ANALYSIS BY FORM
      33. \r\nFIGURE 74. MALAYSIA ION EXCHANGE
      34. RESINS MARKET ANALYSIS BY REGIONAL
      35. \r\nFIGURE 75. THAILAND ION EXCHANGE RESINS MARKET ANALYSIS
      36. BY TYPE
      37. \r\nFIGURE
    106. THAILAND ION EXCHANGE RESINS MARKET ANALYSIS BY APPLICATION
      1. \r\nFIGURE 77. THAILAND ION EXCHANGE
      2. RESINS MARKET ANALYSIS BY END USE INDUSTRY
      3. \r\nFIGURE 78. THAILAND ION EXCHANGE RESINS MARKET ANALYSIS
      4. BY FORM
      5. \r\nFIGURE
    107. THAILAND ION EXCHANGE RESINS MARKET ANALYSIS BY REGIONAL
      1. \r\nFIGURE 80. INDONESIA ION EXCHANGE
      2. RESINS MARKET ANALYSIS BY TYPE
      3. \r\nFIGURE 81. INDONESIA ION EXCHANGE RESINS MARKET
      4. ANALYSIS BY APPLICATION
      5. \r\nFIGURE 82. INDONESIA ION EXCHANGE RESINS MARKET ANALYSIS
      6. BY END USE INDUSTRY
      7. \r\nFIGURE 83. INDONESIA ION EXCHANGE RESINS MARKET ANALYSIS BY FORM
      8. \r\nFIGURE 84. INDONESIA ION EXCHANGE
      9. RESINS MARKET ANALYSIS BY REGIONAL
      10. \r\nFIGURE 85. REST OF APAC ION EXCHANGE RESINS MARKET
      11. ANALYSIS BY TYPE
      12. \r\nFIGURE 86. REST OF APAC ION EXCHANGE RESINS MARKET ANALYSIS BY APPLICATION
      13. \r\nFIGURE 87. REST OF APAC ION
      14. EXCHANGE RESINS MARKET ANALYSIS BY END USE INDUSTRY
      15. \r\nFIGURE 88. REST OF APAC ION
      16. EXCHANGE RESINS MARKET ANALYSIS BY FORM
      17. \r\nFIGURE 89. REST OF APAC ION EXCHANGE RESINS MARKET
      18. ANALYSIS BY REGIONAL
      19. \r\nFIGURE 90. SOUTH AMERICA ION EXCHANGE RESINS MARKET ANALYSIS
      20. \r\nFIGURE 91. BRAZIL ION EXCHANGE
      21. RESINS MARKET ANALYSIS BY TYPE
      22. \r\nFIGURE 92. BRAZIL ION EXCHANGE RESINS MARKET ANALYSIS
      23. BY APPLICATION
      24. \r\nFIGURE 93. BRAZIL ION EXCHANGE RESINS MARKET ANALYSIS BY END USE INDUSTRY
      25. \r\nFIGURE 94. BRAZIL ION EXCHANGE
      26. RESINS MARKET ANALYSIS BY FORM
      27. \r\nFIGURE 95. BRAZIL ION EXCHANGE RESINS MARKET ANALYSIS
      28. BY REGIONAL
      29. \r\nFIGURE 96. MEXICO ION EXCHANGE RESINS MARKET ANALYSIS BY TYPE
      30. \r\nFIGURE 97. MEXICO ION EXCHANGE
      31. RESINS MARKET ANALYSIS BY APPLICATION
      32. \r\nFIGURE 98. MEXICO ION EXCHANGE RESINS MARKET ANALYSIS
      33. BY END USE INDUSTRY
      34. \r\nFIGURE 99. MEXICO ION EXCHANGE RESINS MARKET ANALYSIS BY FORM
      35. \r\nFIGURE 100. MEXICO ION EXCHANGE
      36. RESINS MARKET ANALYSIS BY REGIONAL
      37. \r\nFIGURE 101. ARGENTINA ION EXCHANGE RESINS MARKET
      38. ANALYSIS BY TYPE
      39. \r\nFIGURE 102. ARGENTINA ION EXCHANGE RESINS MARKET ANALYSIS BY APPLICATION
      40. \r\nFIGURE 103. ARGENTINA ION EXCHANGE
      41. RESINS MARKET ANALYSIS BY END USE INDUSTRY
      42. \r\nFIGURE 104. ARGENTINA ION EXCHANGE RESINS MARKET
      43. ANALYSIS BY FORM
      44. \r\nFIGURE 105. ARGENTINA ION EXCHANGE RESINS MARKET ANALYSIS BY REGIONAL
      45. \r\nFIGURE 106. REST OF SOUTH AMERICA
      46. ION EXCHANGE RESINS MARKET ANALYSIS BY TYPE
      47. \r\nFIGURE 107. REST OF SOUTH AMERICA ION EXCHANGE RESINS
      48. MARKET ANALYSIS BY APPLICATION
      49. \r\nFIGURE 108. REST OF SOUTH AMERICA ION EXCHANGE RESINS
      50. MARKET ANALYSIS BY END USE INDUSTRY
      51. \r\nFIGURE 109. REST OF SOUTH AMERICA ION EXCHANGE RESINS
      52. MARKET ANALYSIS BY FORM
      53. \r\nFIGURE 110. REST OF SOUTH AMERICA ION EXCHANGE RESINS MARKET
      54. ANALYSIS BY REGIONAL
      55. \r\nFIGURE 111. MEA ION EXCHANGE RESINS MARKET ANALYSIS
      56. \r\nFIGURE 112. GCC COUNTRIES ION
      57. EXCHANGE RESINS MARKET ANALYSIS BY TYPE
      58. \r\nFIGURE 113. GCC COUNTRIES ION EXCHANGE RESINS MARKET
      59. ANALYSIS BY APPLICATION
      60. \r\nFIGURE 114. GCC COUNTRIES ION EXCHANGE RESINS MARKET ANALYSIS
      61. BY END USE INDUSTRY
      62. \r\nFIGURE 115. GCC COUNTRIES ION EXCHANGE RESINS MARKET ANALYSIS BY FORM
      63. \r\nFIGURE 116. GCC COUNTRIES ION
      64. EXCHANGE RESINS MARKET ANALYSIS BY REGIONAL
      65. \r\nFIGURE 117. SOUTH AFRICA ION EXCHANGE RESINS MARKET
      66. ANALYSIS BY TYPE
      67. \r\nFIGURE 118. SOUTH AFRICA ION EXCHANGE RESINS MARKET ANALYSIS BY APPLICATION
      68. \r\nFIGURE 119. SOUTH AFRICA ION
      69. EXCHANGE RESINS MARKET ANALYSIS BY END USE INDUSTRY
      70. \r\nFIGURE 120. SOUTH AFRICA ION
      71. EXCHANGE RESINS MARKET ANALYSIS BY FORM
      72. \r\nFIGURE 121. SOUTH AFRICA ION EXCHANGE RESINS MARKET
      73. ANALYSIS BY REGIONAL
      74. \r\nFIGURE 122. REST OF MEA ION EXCHANGE RESINS MARKET ANALYSIS BY TYPE
      75. \r\nFIGURE 123. REST OF MEA ION
      76. EXCHANGE RESINS MARKET ANALYSIS BY APPLICATION
      77. \r\nFIGURE 124. REST OF MEA ION EXCHANGE RESINS MARKET
      78. ANALYSIS BY END USE INDUSTRY
      79. \r\nFIGURE 125. REST OF MEA ION EXCHANGE RESINS MARKET ANALYSIS
      80. BY FORM
      81. \r\nFIGURE
    108. REST OF MEA ION EXCHANGE RESINS MARKET ANALYSIS BY REGIONAL
      1. \r\nFIGURE 127. KEY BUYING CRITERIA
    109. OF ION EXCHANGE RESINS MARKET
      1. \r\nFIGURE 128. RESEARCH PROCESS OF MRFR
      2. \r\nFIGURE 129. DRO ANALYSIS OF
    110. ION EXCHANGE RESINS MARKET
      1. \r\nFIGURE 130. DRIVERS IMPACT ANALYSIS: ION EXCHANGE RESINS
      2. MARKET
      3. \r\nFIGURE
    111. RESTRAINTS IMPACT ANALYSIS: ION EXCHANGE RESINS MARKET
      1. \r\nFIGURE 132. SUPPLY / VALUE
      2. CHAIN: ION EXCHANGE RESINS MARKET
    112. \r\nFIGURE 133. ION EXCHANGE RESINS MARKET, BY TYPE,
    113. \r\nFIGURE 134. ION EXCHANGE RESINS MARKET, BY TYPE, 2019 TO 2032 (USD
      1. Billions)
      2. \r\nFIGURE
    114. ION EXCHANGE RESINS MARKET, BY APPLICATION, 2024 (% SHARE)
      1. \r\nFIGURE 136. ION EXCHANGE RESINS
    115. MARKET, BY APPLICATION, 2019 TO 2032 (USD Billions)
      1. \r\nFIGURE 137. ION EXCHANGE RESINS
    116. MARKET, BY END USE INDUSTRY, 2024 (% SHARE)
    117. \r\nFIGURE 138. ION EXCHANGE RESINS MARKET, BY END USE
      1. INDUSTRY, 2019 TO 2032 (USD Billions)
    118. \r\nFIGURE 139. ION EXCHANGE RESINS MARKET, BY FORM,
    119. \r\nFIGURE 140. ION EXCHANGE RESINS MARKET, BY FORM, 2019 TO 2032 (USD
      1. Billions)
      2. \r\nFIGURE
    120. ION EXCHANGE RESINS MARKET, BY REGIONAL, 2024 (% SHARE)
      1. \r\nFIGURE 142. ION EXCHANGE RESINS
    121. MARKET, BY REGIONAL, 2019 TO 2032 (USD Billions)
      1. \r\nFIGURE 143. BENCHMARKING OF MAJOR COMPETITORS
      2. \r\n

    Ion Exchange Resins Market Segmentation


    • Ion Exchange Resins Market By Type (USD Billion, 2019-2032)

      • Cation Exchange Resins
      • Anion Exchange Resins
      • Mixed Bed Resins

    • Ion Exchange Resins Market By Application (USD Billion, 2019-2032)

      • Water Treatment
      • Chemical Processing
      • Pharmaceuticals
      • Food and Beverage
      • Nuclear Power

    • Ion Exchange Resins Market By End Use Industry (USD Billion, 2019-2032)

      • Power Generation
      • Water Treatment Plants
      • Pulp and Paper
      • Mining
      • Electronics

    • Ion Exchange Resins Market By Form (USD Billion, 2019-2032)

      • Granular
      • Bead
      • Synthetic
      • Natural

    • Ion Exchange Resins Market By Regional (USD Billion, 2019-2032)

      • North America
      • Europe
      • South America
      • Asia Pacific
      • Middle East and Africa

    Ion Exchange Resins Market Regional Outlook (USD Billion, 2019-2032)


    • North America Outlook (USD Billion, 2019-2032)

      • North America Ion Exchange Resins Market by Type

        • Cation Exchange Resins
        • Anion Exchange Resins
        • Mixed Bed Resins
      • North America Ion Exchange Resins Market by Application Type

        • Water Treatment
        • Chemical Processing
        • Pharmaceuticals
        • Food and Beverage
        • Nuclear Power
      • North America Ion Exchange Resins Market by End Use Industry Type

        • Power Generation
        • Water Treatment Plants
        • Pulp and Paper
        • Mining
        • Electronics
      • North America Ion Exchange Resins Market by Form Type

        • Granular
        • Bead
        • Synthetic
        • Natural
      • North America Ion Exchange Resins Market by Regional Type

        • US
        • Canada
      • US Outlook (USD Billion, 2019-2032)
      • US Ion Exchange Resins Market by Type

        • Cation Exchange Resins
        • Anion Exchange Resins
        • Mixed Bed Resins
      • US Ion Exchange Resins Market by Application Type

        • Water Treatment
        • Chemical Processing
        • Pharmaceuticals
        • Food and Beverage
        • Nuclear Power
      • US Ion Exchange Resins Market by End Use Industry Type

        • Power Generation
        • Water Treatment Plants
        • Pulp and Paper
        • Mining
        • Electronics
      • US Ion Exchange Resins Market by Form Type

        • Granular
        • Bead
        • Synthetic
        • Natural
      • CANADA Outlook (USD Billion, 2019-2032)
      • CANADA Ion Exchange Resins Market by Type

        • Cation Exchange Resins
        • Anion Exchange Resins
        • Mixed Bed Resins
      • CANADA Ion Exchange Resins Market by Application Type

        • Water Treatment
        • Chemical Processing
        • Pharmaceuticals
        • Food and Beverage
        • Nuclear Power
      • CANADA Ion Exchange Resins Market by End Use Industry Type

        • Power Generation
        • Water Treatment Plants
        • Pulp and Paper
        • Mining
        • Electronics
      • CANADA Ion Exchange Resins Market by Form Type

        • Granular
        • Bead
        • Synthetic
        • Natural
    • Europe Outlook (USD Billion, 2019-2032)

      • Europe Ion Exchange Resins Market by Type

        • Cation Exchange Resins
        • Anion Exchange Resins
        • Mixed Bed Resins
      • Europe Ion Exchange Resins Market by Application Type

        • Water Treatment
        • Chemical Processing
        • Pharmaceuticals
        • Food and Beverage
        • Nuclear Power
      • Europe Ion Exchange Resins Market by End Use Industry Type

        • Power Generation
        • Water Treatment Plants
        • Pulp and Paper
        • Mining
        • Electronics
      • Europe Ion Exchange Resins Market by Form Type

        • Granular
        • Bead
        • Synthetic
        • Natural
      • Europe Ion Exchange Resins Market by Regional Type

        • Germany
        • UK
        • France
        • Russia
        • Italy
        • Spain
        • Rest of Europe
      • GERMANY Outlook (USD Billion, 2019-2032)
      • GERMANY Ion Exchange Resins Market by Type

        • Cation Exchange Resins
        • Anion Exchange Resins
        • Mixed Bed Resins
      • GERMANY Ion Exchange Resins Market by Application Type

        • Water Treatment
        • Chemical Processing
        • Pharmaceuticals
        • Food and Beverage
        • Nuclear Power
      • GERMANY Ion Exchange Resins Market by End Use Industry Type

        • Power Generation
        • Water Treatment Plants
        • Pulp and Paper
        • Mining
        • Electronics
      • GERMANY Ion Exchange Resins Market by Form Type

        • Granular
        • Bead
        • Synthetic
        • Natural
      • UK Outlook (USD Billion, 2019-2032)
      • UK Ion Exchange Resins Market by Type

        • Cation Exchange Resins
        • Anion Exchange Resins
        • Mixed Bed Resins
      • UK Ion Exchange Resins Market by Application Type

        • Water Treatment
        • Chemical Processing
        • Pharmaceuticals
        • Food and Beverage
        • Nuclear Power
      • UK Ion Exchange Resins Market by End Use Industry Type

        • Power Generation
        • Water Treatment Plants
        • Pulp and Paper
        • Mining
        • Electronics
      • UK Ion Exchange Resins Market by Form Type

        • Granular
        • Bead
        • Synthetic
        • Natural
      • FRANCE Outlook (USD Billion, 2019-2032)
      • FRANCE Ion Exchange Resins Market by Type

        • Cation Exchange Resins
        • Anion Exchange Resins
        • Mixed Bed Resins
      • FRANCE Ion Exchange Resins Market by Application Type

        • Water Treatment
        • Chemical Processing
        • Pharmaceuticals
        • Food and Beverage
        • Nuclear Power
      • FRANCE Ion Exchange Resins Market by End Use Industry Type

        • Power Generation
        • Water Treatment Plants
        • Pulp and Paper
        • Mining
        • Electronics
      • FRANCE Ion Exchange Resins Market by Form Type

        • Granular
        • Bead
        • Synthetic
        • Natural
      • RUSSIA Outlook (USD Billion, 2019-2032)
      • RUSSIA Ion Exchange Resins Market by Type

        • Cation Exchange Resins
        • Anion Exchange Resins
        • Mixed Bed Resins
      • RUSSIA Ion Exchange Resins Market by Application Type

        • Water Treatment
        • Chemical Processing
        • Pharmaceuticals
        • Food and Beverage
        • Nuclear Power
      • RUSSIA Ion Exchange Resins Market by End Use Industry Type

        • Power Generation
        • Water Treatment Plants
        • Pulp and Paper
        • Mining
        • Electronics
      • RUSSIA Ion Exchange Resins Market by Form Type

        • Granular
        • Bead
        • Synthetic
        • Natural
      • ITALY Outlook (USD Billion, 2019-2032)
      • ITALY Ion Exchange Resins Market by Type

        • Cation Exchange Resins
        • Anion Exchange Resins
        • Mixed Bed Resins
      • ITALY Ion Exchange Resins Market by Application Type

        • Water Treatment
        • Chemical Processing
        • Pharmaceuticals
        • Food and Beverage
        • Nuclear Power
      • ITALY Ion Exchange Resins Market by End Use Industry Type

        • Power Generation
        • Water Treatment Plants
        • Pulp and Paper
        • Mining
        • Electronics
      • ITALY Ion Exchange Resins Market by Form Type

        • Granular
        • Bead
        • Synthetic
        • Natural
      • SPAIN Outlook (USD Billion, 2019-2032)
      • SPAIN Ion Exchange Resins Market by Type

        • Cation Exchange Resins
        • Anion Exchange Resins
        • Mixed Bed Resins
      • SPAIN Ion Exchange Resins Market by Application Type

        • Water Treatment
        • Chemical Processing
        • Pharmaceuticals
        • Food and Beverage
        • Nuclear Power
      • SPAIN Ion Exchange Resins Market by End Use Industry Type

        • Power Generation
        • Water Treatment Plants
        • Pulp and Paper
        • Mining
        • Electronics
      • SPAIN Ion Exchange Resins Market by Form Type

        • Granular
        • Bead
        • Synthetic
        • Natural
      • REST OF EUROPE Outlook (USD Billion, 2019-2032)
      • REST OF EUROPE Ion Exchange Resins Market by Type

        • Cation Exchange Resins
        • Anion Exchange Resins
        • Mixed Bed Resins
      • REST OF EUROPE Ion Exchange Resins Market by Application Type

        • Water Treatment
        • Chemical Processing
        • Pharmaceuticals
        • Food and Beverage
        • Nuclear Power
      • REST OF EUROPE Ion Exchange Resins Market by End Use Industry Type

        • Power Generation
        • Water Treatment Plants
        • Pulp and Paper
        • Mining
        • Electronics
      • REST OF EUROPE Ion Exchange Resins Market by Form Type

        • Granular
        • Bead
        • Synthetic
        • Natural
    • APAC Outlook (USD Billion, 2019-2032)

      • APAC Ion Exchange Resins Market by Type

        • Cation Exchange Resins
        • Anion Exchange Resins
        • Mixed Bed Resins
      • APAC Ion Exchange Resins Market by Application Type

        • Water Treatment
        • Chemical Processing
        • Pharmaceuticals
        • Food and Beverage
        • Nuclear Power
      • APAC Ion Exchange Resins Market by End Use Industry Type

        • Power Generation
        • Water Treatment Plants
        • Pulp and Paper
        • Mining
        • Electronics
      • APAC Ion Exchange Resins Market by Form Type

        • Granular
        • Bead
        • Synthetic
        • Natural
      • APAC Ion Exchange Resins Market by Regional Type

        • China
        • India
        • Japan
        • South Korea
        • Malaysia
        • Thailand
        • Indonesia
        • Rest of APAC
      • CHINA Outlook (USD Billion, 2019-2032)
      • CHINA Ion Exchange Resins Market by Type

        • Cation Exchange Resins
        • Anion Exchange Resins
        • Mixed Bed Resins
      • CHINA Ion Exchange Resins Market by Application Type

        • Water Treatment
        • Chemical Processing
        • Pharmaceuticals
        • Food and Beverage
        • Nuclear Power
      • CHINA Ion Exchange Resins Market by End Use Industry Type

        • Power Generation
        • Water Treatment Plants
        • Pulp and Paper
        • Mining
        • Electronics
      • CHINA Ion Exchange Resins Market by Form Type

        • Granular
        • Bead
        • Synthetic
        • Natural
      • INDIA Outlook (USD Billion, 2019-2032)
      • INDIA Ion Exchange Resins Market by Type

        • Cation Exchange Resins
        • Anion Exchange Resins
        • Mixed Bed Resins
      • INDIA Ion Exchange Resins Market by Application Type

        • Water Treatment
        • Chemical Processing
        • Pharmaceuticals
        • Food and Beverage
        • Nuclear Power
      • INDIA Ion Exchange Resins Market by End Use Industry Type

        • Power Generation
        • Water Treatment Plants
        • Pulp and Paper
        • Mining
        • Electronics
      • INDIA Ion Exchange Resins Market by Form Type

        • Granular
        • Bead
        • Synthetic
        • Natural
      • JAPAN Outlook (USD Billion, 2019-2032)
      • JAPAN Ion Exchange Resins Market by Type

        • Cation Exchange Resins
        • Anion Exchange Resins
        • Mixed Bed Resins
      • JAPAN Ion Exchange Resins Market by Application Type

        • Water Treatment
        • Chemical Processing
        • Pharmaceuticals
        • Food and Beverage
        • Nuclear Power
      • JAPAN Ion Exchange Resins Market by End Use Industry Type

        • Power Generation
        • Water Treatment Plants
        • Pulp and Paper
        • Mining
        • Electronics
      • JAPAN Ion Exchange Resins Market by Form Type

        • Granular
        • Bead
        • Synthetic
        • Natural
      • SOUTH KOREA Outlook (USD Billion, 2019-2032)
      • SOUTH KOREA Ion Exchange Resins Market by Type

        • Cation Exchange Resins
        • Anion Exchange Resins
        • Mixed Bed Resins
      • SOUTH KOREA Ion Exchange Resins Market by Application Type

        • Water Treatment
        • Chemical Processing
        • Pharmaceuticals
        • Food and Beverage
        • Nuclear Power
      • SOUTH KOREA Ion Exchange Resins Market by End Use Industry Type

        • Power Generation
        • Water Treatment Plants
        • Pulp and Paper
        • Mining
        • Electronics
      • SOUTH KOREA Ion Exchange Resins Market by Form Type

        • Granular
        • Bead
        • Synthetic
        • Natural
      • MALAYSIA Outlook (USD Billion, 2019-2032)
      • MALAYSIA Ion Exchange Resins Market by Type

        • Cation Exchange Resins
        • Anion Exchange Resins
        • Mixed Bed Resins
      • MALAYSIA Ion Exchange Resins Market by Application Type

        • Water Treatment
        • Chemical Processing
        • Pharmaceuticals
        • Food and Beverage
        • Nuclear Power
      • MALAYSIA Ion Exchange Resins Market by End Use Industry Type

        • Power Generation
        • Water Treatment Plants
        • Pulp and Paper
        • Mining
        • Electronics
      • MALAYSIA Ion Exchange Resins Market by Form Type

        • Granular
        • Bead
        • Synthetic
        • Natural
      • THAILAND Outlook (USD Billion, 2019-2032)
      • THAILAND Ion Exchange Resins Market by Type

        • Cation Exchange Resins
        • Anion Exchange Resins
        • Mixed Bed Resins
      • THAILAND Ion Exchange Resins Market by Application Type

        • Water Treatment
        • Chemical Processing
        • Pharmaceuticals
        • Food and Beverage
        • Nuclear Power
      • THAILAND Ion Exchange Resins Market by End Use Industry Type

        • Power Generation
        • Water Treatment Plants
        • Pulp and Paper
        • Mining
        • Electronics
      • THAILAND Ion Exchange Resins Market by Form Type

        • Granular
        • Bead
        • Synthetic
        • Natural
      • INDONESIA Outlook (USD Billion, 2019-2032)
      • INDONESIA Ion Exchange Resins Market by Type

        • Cation Exchange Resins
        • Anion Exchange Resins
        • Mixed Bed Resins
      • INDONESIA Ion Exchange Resins Market by Application Type

        • Water Treatment
        • Chemical Processing
        • Pharmaceuticals
        • Food and Beverage
        • Nuclear Power
      • INDONESIA Ion Exchange Resins Market by End Use Industry Type

        • Power Generation
        • Water Treatment Plants
        • Pulp and Paper
        • Mining
        • Electronics
      • INDONESIA Ion Exchange Resins Market by Form Type

        • Granular
        • Bead
        • Synthetic
        • Natural
      • REST OF APAC Outlook (USD Billion, 2019-2032)
      • REST OF APAC Ion Exchange Resins Market by Type

        • Cation Exchange Resins
        • Anion Exchange Resins
        • Mixed Bed Resins
      • REST OF APAC Ion Exchange Resins Market by Application Type

        • Water Treatment
        • Chemical Processing
        • Pharmaceuticals
        • Food and Beverage
        • Nuclear Power
      • REST OF APAC Ion Exchange Resins Market by End Use Industry Type

        • Power Generation
        • Water Treatment Plants
        • Pulp and Paper
        • Mining
        • Electronics
      • REST OF APAC Ion Exchange Resins Market by Form Type

        • Granular
        • Bead
        • Synthetic
        • Natural
    • South America Outlook (USD Billion, 2019-2032)

      • South America Ion Exchange Resins Market by Type

        • Cation Exchange Resins
        • Anion Exchange Resins
        • Mixed Bed Resins
      • South America Ion Exchange Resins Market by Application Type

        • Water Treatment
        • Chemical Processing
        • Pharmaceuticals
        • Food and Beverage
        • Nuclear Power
      • South America Ion Exchange Resins Market by End Use Industry Type

        • Power Generation
        • Water Treatment Plants
        • Pulp and Paper
        • Mining
        • Electronics
      • South America Ion Exchange Resins Market by Form Type

        • Granular
        • Bead
        • Synthetic
        • Natural
      • South America Ion Exchange Resins Market by Regional Type

        • Brazil
        • Mexico
        • Argentina
        • Rest of South America
      • BRAZIL Outlook (USD Billion, 2019-2032)
      • BRAZIL Ion Exchange Resins Market by Type

        • Cation Exchange Resins
        • Anion Exchange Resins
        • Mixed Bed Resins
      • BRAZIL Ion Exchange Resins Market by Application Type

        • Water Treatment
        • Chemical Processing
        • Pharmaceuticals
        • Food and Beverage
        • Nuclear Power
      • BRAZIL Ion Exchange Resins Market by End Use Industry Type

        • Power Generation
        • Water Treatment Plants
        • Pulp and Paper
        • Mining
        • Electronics
      • BRAZIL Ion Exchange Resins Market by Form Type

        • Granular
        • Bead
        • Synthetic
        • Natural
      • MEXICO Outlook (USD Billion, 2019-2032)
      • MEXICO Ion Exchange Resins Market by Type

        • Cation Exchange Resins
        • Anion Exchange Resins
        • Mixed Bed Resins
      • MEXICO Ion Exchange Resins Market by Application Type

        • Water Treatment
        • Chemical Processing
        • Pharmaceuticals
        • Food and Beverage
        • Nuclear Power
      • MEXICO Ion Exchange Resins Market by End Use Industry Type

        • Power Generation
        • Water Treatment Plants
        • Pulp and Paper
        • Mining
        • Electronics
      • MEXICO Ion Exchange Resins Market by Form Type

        • Granular
        • Bead
        • Synthetic
        • Natural
      • ARGENTINA Outlook (USD Billion, 2019-2032)
      • ARGENTINA Ion Exchange Resins Market by Type

        • Cation Exchange Resins
        • Anion Exchange Resins
        • Mixed Bed Resins
      • ARGENTINA Ion Exchange Resins Market by Application Type

        • Water Treatment
        • Chemical Processing
        • Pharmaceuticals
        • Food and Beverage
        • Nuclear Power
      • ARGENTINA Ion Exchange Resins Market by End Use Industry Type

        • Power Generation
        • Water Treatment Plants
        • Pulp and Paper
        • Mining
        • Electronics
      • ARGENTINA Ion Exchange Resins Market by Form Type

        • Granular
        • Bead
        • Synthetic
        • Natural
      • REST OF SOUTH AMERICA Outlook (USD Billion, 2019-2032)
      • REST OF SOUTH AMERICA Ion Exchange Resins Market by Type

        • Cation Exchange Resins
        • Anion Exchange Resins
        • Mixed Bed Resins
      • REST OF SOUTH AMERICA Ion Exchange Resins Market by Application Type

        • Water Treatment
        • Chemical Processing
        • Pharmaceuticals
        • Food and Beverage
        • Nuclear Power
      • REST OF SOUTH AMERICA Ion Exchange Resins Market by End Use Industry Type

        • Power Generation
        • Water Treatment Plants
        • Pulp and Paper
        • Mining
        • Electronics
      • REST OF SOUTH AMERICA Ion Exchange Resins Market by Form Type

        • Granular
        • Bead
        • Synthetic
        • Natural
    • MEA Outlook (USD Billion, 2019-2032)

      • MEA Ion Exchange Resins Market by Type

        • Cation Exchange Resins
        • Anion Exchange Resins
        • Mixed Bed Resins
      • MEA Ion Exchange Resins Market by Application Type

        • Water Treatment
        • Chemical Processing
        • Pharmaceuticals
        • Food and Beverage
        • Nuclear Power
      • MEA Ion Exchange Resins Market by End Use Industry Type

        • Power Generation
        • Water Treatment Plants
        • Pulp and Paper
        • Mining
        • Electronics
      • MEA Ion Exchange Resins Market by Form Type

        • Granular
        • Bead
        • Synthetic
        • Natural
      • MEA Ion Exchange Resins Market by Regional Type

        • GCC Countries
        • South Africa
        • Rest of MEA
      • GCC COUNTRIES Outlook (USD Billion, 2019-2032)
      • GCC COUNTRIES Ion Exchange Resins Market by Type

        • Cation Exchange Resins
        • Anion Exchange Resins
        • Mixed Bed Resins
      • GCC COUNTRIES Ion Exchange Resins Market by Application Type

        • Water Treatment
        • Chemical Processing
        • Pharmaceuticals
        • Food and Beverage
        • Nuclear Power
      • GCC COUNTRIES Ion Exchange Resins Market by End Use Industry Type

        • Power Generation
        • Water Treatment Plants
        • Pulp and Paper
        • Mining
        • Electronics
      • GCC COUNTRIES Ion Exchange Resins Market by Form Type

        • Granular
        • Bead
        • Synthetic
        • Natural
      • SOUTH AFRICA Outlook (USD Billion, 2019-2032)
      • SOUTH AFRICA Ion Exchange Resins Market by Type

        • Cation Exchange Resins
        • Anion Exchange Resins
        • Mixed Bed Resins
      • SOUTH AFRICA Ion Exchange Resins Market by Application Type

        • Water Treatment
        • Chemical Processing
        • Pharmaceuticals
        • Food and Beverage
        • Nuclear Power
      • SOUTH AFRICA Ion Exchange Resins Market by End Use Industry Type

        • Power Generation
        • Water Treatment Plants
        • Pulp and Paper
        • Mining
        • Electronics
      • SOUTH AFRICA Ion Exchange Resins Market by Form Type

        • Granular
        • Bead
        • Synthetic
        • Natural
      • REST OF MEA Outlook (USD Billion, 2019-2032)
      • REST OF MEA Ion Exchange Resins Market by Type

        • Cation Exchange Resins
        • Anion Exchange Resins
        • Mixed Bed Resins
      • REST OF MEA Ion Exchange Resins Market by Application Type

        • Water Treatment
        • Chemical Processing
        • Pharmaceuticals
        • Food and Beverage
        • Nuclear Power
      • REST OF MEA Ion Exchange Resins Market by End Use Industry Type

        • Power Generation
        • Water Treatment Plants
        • Pulp and Paper
        • Mining
        • Electronics
      • REST OF MEA Ion Exchange Resins Market by Form Type

        • Granular
        • Bead
        • Synthetic
        • Natural


    Infographic

    Free Sample Request

    Kindly complete the form below to receive a free sample of this Report

    Get Free Sample

    Customer Strories

    “I am very pleased with how market segments have been defined in a relevant way for my purposes (such as "Portable Freezers & refrigerators" and "last-mile"). In general the report is well structured. Thanks very much for your efforts.”

    Victoria Milne

    Founder
    Case Study
    Chemicals and Materials