×
Hero Background
English
Chinese
French
Japanese
Korean
German
Spanish

Ion Exchange Resins Market Share

ID: MRFR/CnM/4575-CR
128 Pages
Chitranshi Jaiswal
March 2024

Ion Exchange Resins Market Research Report By Type (Cation Exchange Resins, Anion Exchange Resins, Mixed Bed Resins), By Application (Water Treatment, Chemical Processing, Pharmaceuticals, Food and Beverage, Nuclear Power), By End Use Industry (Power Generation, Water Treatment Plants, Pulp and Paper, Mining, Electronics), By Form (Granular, Bead, Synthetic, Natural) and By Regional (North America, Europe, South America, Asia Pacific, Middle East and Africa) - Forecast to 2035

Share:
Download PDF ×

We do not share your information with anyone. However, we may send you emails based on your report interest from time to time. You may contact us at any time to opt-out.

Ion Exchange Resins Market Infographic
Purchase Options

Market Share

Ion Exchange Resins Market Share Analysis

Market share positioning strategies play a crucial role in the Ion Exchange Resins Market, where companies strive to carve out their niche and establish a competitive advantage. One common approach is differentiation, where companies aim to distinguish their products from competitors through unique features or attributes. For instance, a company might focus on developing ion exchange resins with superior durability, efficiency, or environmental sustainability. By offering something distinct, they can attract customers who value these qualities and capture a larger share of the market.

Another strategy involves targeting specific market segments. Rather than trying to appeal to everyone, companies may concentrate on serving particular industries or applications where their products excel. For example, a company might specialize in providing ion exchange resins for water treatment plants, pharmaceutical manufacturing, or electronics production. By focusing their efforts and resources on these segments, they can tailor their products and marketing messages to better meet the needs of customers, ultimately gaining a stronger foothold in those markets.

The increasing demand across the food and beverage industry, chemical industry, water treatment industry, industrial water treatment plants, and significant others are considered as the major drivers of ion exchange market growth.

Furthermore, pricing strategies can influence market share positioning. Some companies may opt for a cost leadership approach, aiming to offer ion exchange resins at lower prices than competitors while maintaining acceptable quality levels. This can be effective in attracting price-sensitive customers and capturing market share, especially in industries where price is a significant factor in purchasing decisions. Conversely, other companies may adopt a premium pricing strategy, positioning their products as high-quality or premium offerings and targeting customers who are willing to pay a premium for superior performance or service.

In addition to product differentiation and targeting specific market segments, effective distribution channels are essential for gaining market share in the Ion Exchange Resins Market. Companies need to ensure that their products are readily available to customers through efficient distribution networks. This may involve partnering with distributors or wholesalers who have extensive reach and established relationships with end-users in various industries. By leveraging these channels effectively, companies can increase their market penetration and capture a larger share of the market.

Moreover, innovation plays a key role in market share positioning within the Ion Exchange Resins Market. Companies that continually invest in research and development to improve their products or develop new solutions can stay ahead of competitors and maintain or expand their market share. Whether it's developing more efficient resins, enhancing manufacturing processes, or exploring new applications, innovation can be a powerful driver of growth and differentiation in the market.

Furthermore, strategic partnerships and collaborations can also be instrumental in market share positioning. By teaming up with complementary companies or research institutions, companies can access new markets, technologies, or expertise that can enhance their competitive position. For example, a company specializing in ion exchange resins might collaborate with a water treatment equipment manufacturer to offer integrated solutions to customers, providing added value and differentiation in the market.

Lastly, effective marketing and branding strategies are essential for establishing and reinforcing market share positioning. Companies need to communicate their unique value proposition effectively to target customers and differentiate themselves from competitors. This may involve creating compelling branding and messaging that resonates with customers' needs and aspirations, as well as leveraging various marketing channels such as advertising, social media, and trade shows to reach and engage their target audience.

Author
Chitranshi Jaiswal
Research Analyst Level I

In her 3 years of experience in the market research field, she has handled critical cross-domain projects. She has an in-depth knowledge of market estimation & analysis, problem-solving, primary as well as secondary research, and team management.She holds an engineering degree and is an MBA professional from a well-known university, capable of evaluating the market and competitive conditions. An exceptional strategist with excellent communication skills and a passion for delivering cutting-edge & practical insights for the market. Proficient in multi-tasking, and can successfully deal with competing demands, while maintaining complete confidentiality. Generated business through active client and project development, networking, and high-quality responses. Her knowledge and skills have helped in making solid business decisions, securing funding from investors, and avoiding business failures.

Leave a Comment

FAQs

What is the projected market valuation for the Ion Exchange Resins Market by 2035?

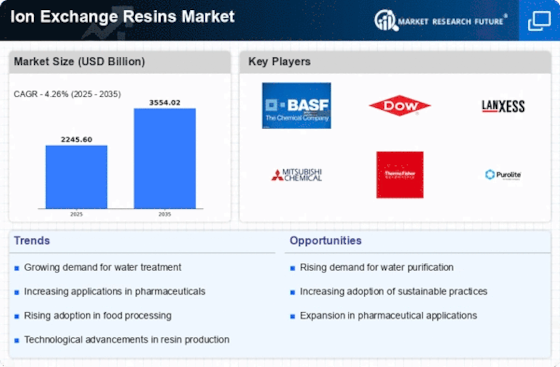
The Ion Exchange Resins Market is projected to reach a valuation of 3554.02 USD Billion by 2035.

What was the overall market valuation of the Ion Exchange Resins Market in 2024?

In 2024, the overall market valuation of the Ion Exchange Resins Market was 2245.6 USD Billion.

What is the expected CAGR for the Ion Exchange Resins Market during the forecast period 2025 - 2035?

The expected CAGR for the Ion Exchange Resins Market during the forecast period 2025 - 2035 is 4.26%.

Which companies are considered key players in the Ion Exchange Resins Market?

Key players in the Ion Exchange Resins Market include BASF SE, Dow Inc., Lanxess AG, and Mitsubishi Chemical Corporation.

What are the main types of ion exchange resins and their market valuations?

Cation Exchange Resins are valued at 1600.0 USD Billion, Anion Exchange Resins at 1200.0 USD Billion, and Mixed Bed Resins at 754.02 USD Billion.

How does the Water Treatment application segment perform in the Ion Exchange Resins Market?

The Water Treatment application segment is projected to grow from 800.0 USD Billion to 1300.0 USD Billion.

What is the market valuation for Synthetic ion exchange resins?

Synthetic ion exchange resins are valued between 700.0 USD Billion and 1100.0 USD Billion.

Market Summary

As per MRFR analysis, the Ion Exchange Resins Market Size was estimated at 2245.6 USD Billion in 2024. The Ion Exchange Resins industry is projected to grow from 2341.31 USD Billion in 2025 to 3554.02 USD Billion by 2035, exhibiting a compound annual growth rate (CAGR) of 4.26 during the forecast period 2025 - 2035.

Key Market Trends & Highlights

The Ion Exchange Resins Market is experiencing robust growth driven by sustainability and technological advancements.

  • North America remains the largest market for ion exchange resins, primarily due to its established water treatment infrastructure.
  • The Asia-Pacific region is emerging as the fastest-growing market, fueled by increasing industrialization and urbanization.
  • Cation exchange resins dominate the market, while anion exchange resins are witnessing rapid growth in demand.
  • Rising demand in water treatment and stringent environmental regulations are key drivers propelling market expansion.

Market Size & Forecast

2024 Market Size 2245.6 (USD Billion)
2035 Market Size 3554.02 (USD Billion)
CAGR (2025 - 2035) 4.26%
Largest Regional Market Share in 2024 North America

Major Players

<p>BASF SE (DE), Dow Inc. (US), Lanxess AG (DE), Mitsubishi Chemical Corporation (JP), Thermo Fisher Scientific Inc. (US), Purolite Corporation (US), ResinTech Inc. (US), SABIC (SA), Ion Exchange (India) Ltd. (IN)</p>

Market Trends

The Ion Exchange Resins Market is currently experiencing a dynamic evolution, driven by various factors that influence its growth trajectory. The increasing demand for water treatment solutions, particularly in industrial and municipal sectors, appears to be a primary catalyst. As environmental regulations become more stringent, industries are compelled to adopt advanced technologies for water purification, which often involves the use of ion exchange resins. Furthermore, the rising awareness regarding the importance of clean water and sustainable practices is likely to propel the market forward. This trend is complemented by innovations in resin formulations, enhancing their efficiency and application range. In addition to water treatment, the Ion Exchange Resins Market is witnessing a surge in applications across pharmaceuticals and food processing industries. These sectors require high-purity water and specific ion removal processes, which ion exchange resins can effectively provide. The versatility of these materials, coupled with ongoing research and development efforts, suggests a promising future for the market. As manufacturers continue to explore new applications and improve resin performance, the Ion Exchange Resins Market is poised for sustained growth, adapting to the evolving needs of various industries.

Sustainability Initiatives

The Ion Exchange Resins Market is increasingly influenced by sustainability initiatives. Companies are focusing on developing eco-friendly resins that minimize environmental impact. This shift aligns with global efforts to reduce waste and promote recycling, thereby enhancing the appeal of ion exchange technologies.

Technological Advancements

Technological advancements in resin production and application are shaping the Ion Exchange Resins Market. Innovations such as enhanced selectivity and improved regeneration processes are being introduced, which may lead to greater efficiency and cost-effectiveness in various applications.

Regulatory Compliance

Regulatory compliance is becoming a critical driver in the Ion Exchange Resins Market. Stricter environmental regulations are prompting industries to adopt advanced water treatment solutions, including ion exchange resins, to meet quality standards and ensure safe discharge practices.

Ion Exchange Resins Market Market Drivers

Rising Demand in Water Treatment

The Ion Exchange Resins Market is experiencing a notable surge in demand, primarily driven by the increasing need for effective water treatment solutions. As water scarcity and pollution concerns escalate, industries are seeking advanced technologies to purify water. Ion exchange resins play a crucial role in removing contaminants, heavy metals, and ions from water, making it suitable for consumption and industrial use. According to recent data, the water treatment segment is projected to account for a significant share of the market, with a compound annual growth rate of approximately 6% over the next few years. This trend indicates a robust growth trajectory for the Ion Exchange Resins Market, as municipalities and industries invest in sustainable water management practices.

Increasing Environmental Regulations

The Ion Exchange Resins Market is significantly influenced by the increasing environmental regulations aimed at reducing pollution and promoting sustainable practices. Governments and regulatory bodies are implementing stringent guidelines for wastewater treatment and discharge, compelling industries to adopt effective water treatment solutions. Ion exchange resins are recognized for their efficiency in removing harmful contaminants from wastewater, thus ensuring compliance with environmental standards. This regulatory pressure is expected to drive the demand for ion exchange resins, particularly in sectors such as manufacturing, energy, and municipal water treatment. The market is likely to experience a growth rate of approximately 6% as industries invest in technologies that align with environmental regulations, thereby enhancing the Ion Exchange Resins Market.

Expansion in Food and Beverage Sector

The Ion Exchange Resins Market is benefiting from the expansion of the food and beverage sector, where the demand for high-quality water and ingredient purification is critical. As consumer preferences shift towards healthier and safer food products, manufacturers are increasingly adopting ion exchange resins to ensure the removal of unwanted ions and contaminants from water and ingredients. This trend is particularly evident in the production of soft drinks, juices, and dairy products, where water quality directly impacts product safety and taste. The food and beverage industry is projected to grow at a rate of approximately 4% annually, further driving the demand for ion exchange resins. This growth underscores the vital role of the Ion Exchange Resins Market in supporting food safety and quality.

Growth in Pharmaceutical Applications

The Ion Exchange Resins Market is witnessing substantial growth in pharmaceutical applications, where the need for high-purity water and precise ion control is paramount. Pharmaceutical manufacturers require stringent quality standards for water used in drug formulation and production processes. Ion exchange resins are essential in achieving the desired purity levels by effectively removing impurities and ensuring compliance with regulatory standards. The pharmaceutical sector is expected to contribute significantly to the market, with an estimated growth rate of around 5% annually. This growth is indicative of the increasing reliance on ion exchange technology to meet the evolving demands of the pharmaceutical industry, thereby bolstering the Ion Exchange Resins Market.

Technological Innovations in Resin Production

The Ion Exchange Resins Market is poised for growth due to ongoing technological innovations in resin production. Advances in polymer chemistry and manufacturing processes are leading to the development of more efficient and durable ion exchange resins. These innovations enhance the performance of resins in various applications, including water treatment, pharmaceuticals, and food processing. The introduction of new resin formulations that offer improved selectivity and regeneration capabilities is likely to attract more industries to adopt ion exchange technology. As a result, the market is expected to witness a compound annual growth rate of around 5% over the next few years, driven by the increasing adoption of advanced resin technologies within the Ion Exchange Resins Market.

Market Segment Insights

By Type: Cation Exchange Resins (Largest) vs. Anion Exchange Resins (Fastest-Growing)

<p>The Ion Exchange Resins Market is characterized by distinct segments: Cation Exchange Resins, Anion Exchange Resins, and Mixed Bed Resins. Cation Exchange Resins hold the largest share in the market due to their extensive applications in water treatment, pharmaceuticals, and food processing. Their ability to efficiently remove cations such as heavy metals and hardness components makes them indispensable in various industries. Conversely, Anion Exchange Resins are rapidly gaining traction, driven by the increasing need for water purification and deionization processes in multiple sectors, particularly in emerging economies.</p>

<p>Cation Exchange Resins (Dominant) vs. Anion Exchange Resins (Emerging)</p>

<p>Cation Exchange Resins dominate the Ion Exchange Resins Market, widely recognized for their effectiveness in removing positively charged ions from solutions. Their robust performance in high-demand industries such as water treatment and pharmaceuticals ensures they remain preferred choices for many applications. In contrast, Anion Exchange Resins are emerging prominently due to the surge in demand for deionized water in various sectors, including electronics and power generation. These resins specialize in capturing negatively charged ions, thus complementing the functionalities of Cation Exchange Resins and contributing to a growing market segment driven by innovation and increasing environmental regulations.</p>

By Application: Water Treatment (Largest) vs. Pharmaceuticals (Fastest-Growing)

<p>The Ion Exchange Resins Market shows a pronounced distribution in its application segments. Water Treatment remains the largest segment, commanding significant attention due to the rising demand for efficient purification processes across municipalities and industries. Following this, Chemical Processing, Pharmaceuticals, Food and Beverage, and Nuclear Power also contribute a notable share, with each application showcasing the flexibility and vital role of ion exchange resins in diverse fields.</p>

<p>Water Treatment (Dominant) vs. Pharmaceuticals (Emerging)</p>

<p>Water Treatment is the dominant application segment for ion exchange resins, employed extensively for demineralization, softening, and purification. Its enduring demand is fueled by increasing regulations on water quality and a heightened awareness of environmental sustainability. Conversely, the Pharmaceuticals segment is emerging rapidly, driven by the need for high-purity water and the stringent requirements for pharmaceutical production processes. The growing focus on healthcare advancements and innovations further solidifies the position of ion exchange resins as essential in the efficient separation and purification of active ingredients.</p>

By End Use Industry: Water Treatment Plants (Largest) vs. Power Generation (Fastest-Growing)

<p>In the Ion Exchange Resins Market, Water Treatment Plants hold the largest share due to the growing importance of water purification techniques across residential, commercial, and industrial sectors. Ion exchange resins are essential in removing contaminants, thereby ensuring clean and safe water supply. Other sectors like Power Generation, Pulp and Paper, Mining, and Electronics contribute to the market but lag behind in terms of total share, each fulfilling specialized roles in their respective needs for ion exchange processes.</p>

<p>Water Treatment Plants (Dominant) vs. Power Generation (Emerging)</p>

<p>Water Treatment Plants are the dominant segment in the Ion Exchange Resins Market, primarily due to their critical role in addressing global water scarcity and quality issues. Technological advancements and regulatory pressures have driven investments in water infrastructure, demanding effective resin solutions. In contrast, Power Generation represents an emerging segment, capitalizing on renewable energy trends that require efficient systems for water treatment. The sector is beginning to prioritize ion exchange technology to optimize processes and limit environmental impact. This creates an opportunity for growth and innovation, as the industry seeks sustainable practices.</p>

By Form: Granular (Largest) vs. Bead (Fastest-Growing)

<p>In the Ion Exchange Resins Market, the form segment is primarily dominated by granular resins, which hold the largest market share due to their extensive applications in water treatment and industrial processes. This segment's larger presence stems from the established use of granular forms in various industries, providing stability and efficacy in ion exchange processes. Bead resins, on the other hand, have been gaining traction, particularly in high-purity water applications, driving significant interest among manufacturers and users alike.</p>

<p>Granular (Dominant) vs. Bead (Emerging)</p>

<p>Granular ion exchange resins are characterized by their larger particle sizes, which facilitate a faster flow rate and are ideal for applications requiring high resilience to osmotic shock. These resins dominate the market due to their proven performance in hard water treatment and other industrial applications. Conversely, bead resins, which are smaller and more uniform, are emerging rapidly, particularly in sectors demanding higher purity levels, such as pharmaceuticals and electronics. Their ability to provide superior removal capacities translates to higher efficiency and economic advantages, positioning them well in the competitive landscape.</p>

Get more detailed insights about Ion Exchange Resins Market Research Report – Forecast to 2035

Regional Insights

North America : Innovation and Demand Surge

The North American ion exchange resins market is driven by increasing demand from water treatment and pharmaceutical industries. The region holds the largest market share at approximately 40%, supported by stringent regulations on water quality and environmental standards. The growing focus on sustainable practices and advanced technologies further fuels market growth. Leading countries in this region include the United States and Canada, with the U.S. being the dominant player. Key companies such as Dow Inc. and BASF SE are heavily investing in R&D to innovate and enhance product offerings. The competitive landscape is characterized by a mix of established players and emerging companies, ensuring a dynamic market environment.

Europe : Regulatory Framework Drives Growth

Europe's ion exchange resins market is characterized by a robust regulatory framework that promotes environmental sustainability and water quality. The region accounts for approximately 30% of the global market share, with Germany and the UK being the largest contributors. The European Union's stringent regulations on water treatment and waste management are key drivers of market growth. Germany leads in production and innovation, with major players like Lanxess AG and BASF SE investing in advanced technologies. The competitive landscape is marked by collaboration between companies and research institutions, enhancing product development. The focus on eco-friendly solutions is shaping the future of the market, ensuring compliance with evolving regulations.

Asia-Pacific : Emerging Markets and Growth

The Asia-Pacific region is witnessing rapid growth in the ion exchange resins market, driven by industrialization and urbanization. This region holds approximately 25% of the global market share, with China and India being the largest markets. The increasing demand for clean water and stringent regulations on wastewater treatment are significant growth catalysts. China is the leading country, with substantial investments in water treatment infrastructure. Key players like Mitsubishi Chemical Corporation and Ion Exchange (India) Ltd. are expanding their operations to meet rising demand. The competitive landscape is evolving, with local manufacturers gaining traction alongside established global players, ensuring a diverse market environment.

Middle East and Africa : Resource-Rich Opportunities

The Middle East and Africa region is emerging as a significant player in the ion exchange resins market, driven by resource-rich opportunities and increasing industrial activities. This region holds about 5% of the global market share, with countries like South Africa and Saudi Arabia leading the way. The growing focus on water scarcity and treatment solutions is propelling market growth. South Africa is at the forefront, with investments in water purification technologies. Key players such as SABIC and local manufacturers are expanding their presence to cater to the growing demand. The competitive landscape is characterized by a mix of international and regional players, fostering innovation and collaboration in the market.

Key Players and Competitive Insights

The Ion Exchange Resins Market is currently characterized by a dynamic competitive landscape, driven by increasing demand across various sectors such as water treatment, pharmaceuticals, and food processing. Key players like BASF SE (Germany), Dow Inc. (US), and Lanxess AG (Germany) are strategically positioned to leverage their extensive product portfolios and technological advancements. BASF SE (Germany) focuses on innovation and sustainability, aiming to enhance its product offerings while reducing environmental impact. Dow Inc. (US) emphasizes digital transformation and operational efficiency, which allows for improved customer engagement and streamlined processes. Lanxess AG (Germany) is actively pursuing regional expansion, particularly in emerging markets, to capitalize on growing demand for high-performance resins. Collectively, these strategies contribute to a competitive environment that is increasingly focused on sustainability and technological advancement.

In terms of business tactics, companies are localizing manufacturing to reduce lead times and optimize supply chains, which is particularly crucial in a market that is moderately fragmented. The competitive structure is influenced by the collective actions of these key players, who are not only enhancing their operational capabilities but also responding to the evolving needs of their customers. This localized approach allows for greater responsiveness to market demands and fosters a more resilient supply chain.

In August 2025, Dow Inc. (US) announced a significant investment in a new manufacturing facility in Texas, aimed at increasing production capacity for ion exchange resins. This strategic move is expected to enhance Dow's ability to meet the growing demand in North America, particularly in the water treatment sector. The investment underscores Dow's commitment to operational efficiency and its proactive approach to market opportunities.

In September 2025, BASF SE (Germany) launched a new line of bio-based ion exchange resins, which are designed to meet the increasing demand for sustainable solutions in various industries. This product innovation not only aligns with global sustainability trends but also positions BASF as a leader in environmentally friendly resin solutions. The introduction of these bio-based products is likely to attract environmentally conscious customers and enhance BASF's competitive edge.

In October 2025, Lanxess AG (Germany) entered into a strategic partnership with a leading water treatment company to co-develop advanced ion exchange technologies. This collaboration aims to enhance the efficiency of water purification processes, reflecting Lanxess's commitment to innovation and sustainability. Such partnerships are indicative of a broader trend where companies are increasingly collaborating to leverage complementary strengths and drive technological advancements.

As of October 2025, the Ion Exchange Resins Market is witnessing significant trends such as digitalization, sustainability, and the integration of artificial intelligence in production processes. Strategic alliances are becoming more prevalent, as companies recognize the value of collaboration in enhancing their competitive positioning. Looking ahead, it appears that competitive differentiation will increasingly hinge on innovation, technological advancements, and supply chain reliability, rather than solely on price. This shift suggests a transformative phase in the market, where companies that prioritize these elements are likely to thrive.

Key Companies in the Ion Exchange Resins Market market include

Industry Developments

  • Q2 2024: BASF expands production capacity for ion exchange resins at Ludwigshafen site BASF announced the completion of a capacity expansion for its ion exchange resin production facility in Ludwigshafen, Germany, aiming to meet growing demand from water treatment and industrial customers.
  • Q2 2024: LANXESS launches new Lewatit ion exchange resin for pharmaceutical applications LANXESS introduced a new grade of its Lewatit ion exchange resin specifically designed for use in pharmaceutical purification processes, expanding its product portfolio for the life sciences sector.
  • Q1 2024: Purolite opens new manufacturing facility for ion exchange resins in Pennsylvania Purolite inaugurated a new state-of-the-art manufacturing plant in Pennsylvania, USA, to increase its production capacity of ion exchange resins for water treatment and bioprocessing markets.
  • Q2 2024: Mitsubishi Chemical Group announces partnership with Veolia for advanced water treatment solutions Mitsubishi Chemical Group entered into a strategic partnership with Veolia to jointly develop and supply ion exchange resin-based solutions for municipal and industrial water treatment projects.
  • Q1 2024: Thermax Limited secures major contract for ion exchange resin supply to Indian power plant Thermax Limited announced it has won a significant contract to supply ion exchange resins for water purification systems at a new thermal power plant in India.
  • Q2 2024: DuPont Water Solutions launches next-generation AmberLite ion exchange resins DuPont Water Solutions unveiled its latest AmberLite ion exchange resin series, featuring enhanced performance for industrial water treatment and food processing applications.
  • Q1 2024: LANXESS appoints new head of Liquid Purification Technologies business unit LANXESS announced the appointment of a new executive to lead its Liquid Purification Technologies unit, which oversees the company's ion exchange resin operations.
  • Q2 2024: Purolite secures multi-year supply agreement with major European pharmaceutical company Purolite signed a multi-year contract to supply ion exchange resins for purification processes to a leading European pharmaceutical manufacturer.
  • Q2 2024: BASF and Sinopec expand joint venture to include ion exchange resin production in China BASF and Sinopec announced the expansion of their joint venture in Nanjing, China, to add a new production line for ion exchange resins, targeting the growing Asian water treatment market.
  • Q1 2024: Mitsubishi Chemical Group receives regulatory approval for new ion exchange resin plant in Japan Mitsubishi Chemical Group obtained government approval to construct a new ion exchange resin manufacturing facility in Japan, aimed at supporting domestic and export markets.
  • Q2 2024: DuPont partners with U.S. Department of Energy for PFAS removal project using ion exchange resins DuPont announced a collaboration with the U.S. Department of Energy to deploy its ion exchange resin technology for the removal of PFAS contaminants from groundwater at federal sites.
  • Q1 2024: Thermax Limited opens new R&D center for ion exchange resin innovation in Pune, India Thermax Limited inaugurated a new research and development center in Pune, India, dedicated to advancing ion exchange resin technologies for water and process treatment applications.

Future Outlook

Ion Exchange Resins Market Future Outlook

<p>The Ion Exchange Resins Market is projected to grow at a 4.26% CAGR from 2024 to 2035, driven by increasing demand in water treatment, pharmaceuticals, and food processing.</p>

New opportunities lie in:

  • <p>Development of specialized resins for emerging pharmaceutical applications.</p>
  • <p>Expansion into renewable energy sectors for battery recycling solutions.</p>
  • <p>Investment in automated resin regeneration technologies for efficiency.</p>

<p>By 2035, the market is expected to solidify its position as a key player in various industrial applications.</p>

Market Segmentation

Ion Exchange Resins Market Form Outlook

  • Granular
  • Bead
  • Synthetic
  • Natural

Ion Exchange Resins Market Type Outlook

  • Cation Exchange Resins
  • Anion Exchange Resins
  • Mixed Bed Resins

Ion Exchange Resins Market Application Outlook

  • Water Treatment
  • Chemical Processing
  • Pharmaceuticals
  • Food and Beverage
  • Nuclear Power

Ion Exchange Resins Market End Use Industry Outlook

  • Power Generation
  • Water Treatment Plants
  • Pulp and Paper
  • Mining
  • Electronics

Report Scope

MARKET SIZE 20242245.6(USD Billion)
MARKET SIZE 20252341.31(USD Billion)
MARKET SIZE 20353554.02(USD Billion)
COMPOUND ANNUAL GROWTH RATE (CAGR)4.26% (2024 - 2035)
REPORT COVERAGERevenue Forecast, Competitive Landscape, Growth Factors, and Trends
BASE YEAR2024
Market Forecast Period2025 - 2035
Historical Data2019 - 2024
Market Forecast UnitsUSD Billion
Key Companies ProfiledMarket analysis in progress
Segments CoveredMarket segmentation analysis in progress
Key Market OpportunitiesGrowing demand for water treatment solutions drives innovation in the Ion Exchange Resins Market.
Key Market DynamicsRising demand for water treatment solutions drives innovation and competition in the Ion Exchange Resins Market.
Countries CoveredNorth America, Europe, APAC, South America, MEA

FAQs

What is the projected market valuation for the Ion Exchange Resins Market by 2035?

The Ion Exchange Resins Market is projected to reach a valuation of 3554.02 USD Billion by 2035.

What was the overall market valuation of the Ion Exchange Resins Market in 2024?

In 2024, the overall market valuation of the Ion Exchange Resins Market was 2245.6 USD Billion.

What is the expected CAGR for the Ion Exchange Resins Market during the forecast period 2025 - 2035?

The expected CAGR for the Ion Exchange Resins Market during the forecast period 2025 - 2035 is 4.26%.

Which companies are considered key players in the Ion Exchange Resins Market?

Key players in the Ion Exchange Resins Market include BASF SE, Dow Inc., Lanxess AG, and Mitsubishi Chemical Corporation.

What are the main types of ion exchange resins and their market valuations?

Cation Exchange Resins are valued at 1600.0 USD Billion, Anion Exchange Resins at 1200.0 USD Billion, and Mixed Bed Resins at 754.02 USD Billion.

How does the Water Treatment application segment perform in the Ion Exchange Resins Market?

The Water Treatment application segment is projected to grow from 800.0 USD Billion to 1300.0 USD Billion.

What is the market valuation for Synthetic ion exchange resins?

Synthetic ion exchange resins are valued between 700.0 USD Billion and 1100.0 USD Billion.

  1. SECTION I: EXECUTIVE SUMMARY AND KEY HIGHLIGHTS
    1. EXECUTIVE SUMMARY
      1. Market Overview
      2. Key Findings
      3. Market Segmentation
      4. Competitive Landscape
      5. Challenges and Opportunities
      6. Future Outlook
  2. SECTION II: SCOPING, METHODOLOGY AND MARKET STRUCTURE
    1. MARKET INTRODUCTION
      1. Definition
      2. Scope of the study
    2. RESEARCH METHODOLOGY
      1. Overview
      2. Data Mining
      3. Secondary Research
      4. Primary Research
      5. Forecasting Model
      6. Market Size Estimation
      7. Data Triangulation
      8. Validation
  3. SECTION III: QUALITATIVE ANALYSIS
    1. MARKET DYNAMICS
      1. Overview
      2. Drivers
      3. Restraints
      4. Opportunities
    2. MARKET FACTOR ANALYSIS
      1. Value chain Analysis
      2. Porter's Five Forces Analysis
      3. COVID-19 Impact Analysis
  4. SECTION IV: QUANTITATIVE ANALYSIS
    1. Chemicals and Materials, BY Type (USD Billion)
      1. Cation Exchange Resins
      2. Anion Exchange Resins
      3. Mixed Bed Resins
    2. Chemicals and Materials, BY Application (USD Billion)
      1. Water Treatment
      2. Chemical Processing
      3. Pharmaceuticals
      4. Food and Beverage
      5. Nuclear Power
    3. Chemicals and Materials, BY End Use Industry (USD Billion)
      1. Power Generation
      2. Water Treatment Plants
      3. Pulp and Paper
      4. Mining
      5. Electronics
    4. Chemicals and Materials, BY Form (USD Billion)
      1. Granular
      2. Bead
      3. Synthetic
      4. Natural
    5. Chemicals and Materials, BY Region (USD Billion)
      1. North America
      2. Europe
      3. APAC
      4. South America
      5. MEA
  5. SECTION V: COMPETITIVE ANALYSIS
    1. Competitive Landscape
      1. Overview
      2. Competitive Analysis
      3. Market share Analysis
      4. Major Growth Strategy in the Chemicals and Materials
      5. Competitive Benchmarking
      6. Leading Players in Terms of Number of Developments in the Chemicals and Materials
      7. Key developments and growth strategies
      8. Major Players Financial Matrix
    2. Company Profiles
      1. BASF SE (DE)
      2. Dow Inc. (US)
      3. Lanxess AG (DE)
      4. Mitsubishi Chemical Corporation (JP)
      5. Thermo Fisher Scientific Inc. (US)
      6. Purolite Corporation (US)
      7. ResinTech Inc. (US)
      8. SABIC (SA)
      9. Ion Exchange (India) Ltd. (IN)
    3. Appendix
      1. References
      2. Related Reports
  6. LIST OF FIGURES
    1. MARKET SYNOPSIS
    2. NORTH AMERICA MARKET ANALYSIS
    3. US MARKET ANALYSIS BY TYPE
    4. US MARKET ANALYSIS BY APPLICATION
    5. US MARKET ANALYSIS BY END USE INDUSTRY
    6. US MARKET ANALYSIS BY FORM
    7. CANADA MARKET ANALYSIS BY TYPE
    8. CANADA MARKET ANALYSIS BY APPLICATION
    9. CANADA MARKET ANALYSIS BY END USE INDUSTRY
    10. CANADA MARKET ANALYSIS BY FORM
    11. EUROPE MARKET ANALYSIS
    12. GERMANY MARKET ANALYSIS BY TYPE
    13. GERMANY MARKET ANALYSIS BY APPLICATION
    14. GERMANY MARKET ANALYSIS BY END USE INDUSTRY
    15. GERMANY MARKET ANALYSIS BY FORM
    16. UK MARKET ANALYSIS BY TYPE
    17. UK MARKET ANALYSIS BY APPLICATION
    18. UK MARKET ANALYSIS BY END USE INDUSTRY
    19. UK MARKET ANALYSIS BY FORM
    20. FRANCE MARKET ANALYSIS BY TYPE
    21. FRANCE MARKET ANALYSIS BY APPLICATION
    22. FRANCE MARKET ANALYSIS BY END USE INDUSTRY
    23. FRANCE MARKET ANALYSIS BY FORM
    24. RUSSIA MARKET ANALYSIS BY TYPE
    25. RUSSIA MARKET ANALYSIS BY APPLICATION
    26. RUSSIA MARKET ANALYSIS BY END USE INDUSTRY
    27. RUSSIA MARKET ANALYSIS BY FORM
    28. ITALY MARKET ANALYSIS BY TYPE
    29. ITALY MARKET ANALYSIS BY APPLICATION
    30. ITALY MARKET ANALYSIS BY END USE INDUSTRY
    31. ITALY MARKET ANALYSIS BY FORM
    32. SPAIN MARKET ANALYSIS BY TYPE
    33. SPAIN MARKET ANALYSIS BY APPLICATION
    34. SPAIN MARKET ANALYSIS BY END USE INDUSTRY
    35. SPAIN MARKET ANALYSIS BY FORM
    36. REST OF EUROPE MARKET ANALYSIS BY TYPE
    37. REST OF EUROPE MARKET ANALYSIS BY APPLICATION
    38. REST OF EUROPE MARKET ANALYSIS BY END USE INDUSTRY
    39. REST OF EUROPE MARKET ANALYSIS BY FORM
    40. APAC MARKET ANALYSIS
    41. CHINA MARKET ANALYSIS BY TYPE
    42. CHINA MARKET ANALYSIS BY APPLICATION
    43. CHINA MARKET ANALYSIS BY END USE INDUSTRY
    44. CHINA MARKET ANALYSIS BY FORM
    45. INDIA MARKET ANALYSIS BY TYPE
    46. INDIA MARKET ANALYSIS BY APPLICATION
    47. INDIA MARKET ANALYSIS BY END USE INDUSTRY
    48. INDIA MARKET ANALYSIS BY FORM
    49. JAPAN MARKET ANALYSIS BY TYPE
    50. JAPAN MARKET ANALYSIS BY APPLICATION
    51. JAPAN MARKET ANALYSIS BY END USE INDUSTRY
    52. JAPAN MARKET ANALYSIS BY FORM
    53. SOUTH KOREA MARKET ANALYSIS BY TYPE
    54. SOUTH KOREA MARKET ANALYSIS BY APPLICATION
    55. SOUTH KOREA MARKET ANALYSIS BY END USE INDUSTRY
    56. SOUTH KOREA MARKET ANALYSIS BY FORM
    57. MALAYSIA MARKET ANALYSIS BY TYPE
    58. MALAYSIA MARKET ANALYSIS BY APPLICATION
    59. MALAYSIA MARKET ANALYSIS BY END USE INDUSTRY
    60. MALAYSIA MARKET ANALYSIS BY FORM
    61. THAILAND MARKET ANALYSIS BY TYPE
    62. THAILAND MARKET ANALYSIS BY APPLICATION
    63. THAILAND MARKET ANALYSIS BY END USE INDUSTRY
    64. THAILAND MARKET ANALYSIS BY FORM
    65. INDONESIA MARKET ANALYSIS BY TYPE
    66. INDONESIA MARKET ANALYSIS BY APPLICATION
    67. INDONESIA MARKET ANALYSIS BY END USE INDUSTRY
    68. INDONESIA MARKET ANALYSIS BY FORM
    69. REST OF APAC MARKET ANALYSIS BY TYPE
    70. REST OF APAC MARKET ANALYSIS BY APPLICATION
    71. REST OF APAC MARKET ANALYSIS BY END USE INDUSTRY
    72. REST OF APAC MARKET ANALYSIS BY FORM
    73. SOUTH AMERICA MARKET ANALYSIS
    74. BRAZIL MARKET ANALYSIS BY TYPE
    75. BRAZIL MARKET ANALYSIS BY APPLICATION
    76. BRAZIL MARKET ANALYSIS BY END USE INDUSTRY
    77. BRAZIL MARKET ANALYSIS BY FORM
    78. MEXICO MARKET ANALYSIS BY TYPE
    79. MEXICO MARKET ANALYSIS BY APPLICATION
    80. MEXICO MARKET ANALYSIS BY END USE INDUSTRY
    81. MEXICO MARKET ANALYSIS BY FORM
    82. ARGENTINA MARKET ANALYSIS BY TYPE
    83. ARGENTINA MARKET ANALYSIS BY APPLICATION
    84. ARGENTINA MARKET ANALYSIS BY END USE INDUSTRY
    85. ARGENTINA MARKET ANALYSIS BY FORM
    86. REST OF SOUTH AMERICA MARKET ANALYSIS BY TYPE
    87. REST OF SOUTH AMERICA MARKET ANALYSIS BY APPLICATION
    88. REST OF SOUTH AMERICA MARKET ANALYSIS BY END USE INDUSTRY
    89. REST OF SOUTH AMERICA MARKET ANALYSIS BY FORM
    90. MEA MARKET ANALYSIS
    91. GCC COUNTRIES MARKET ANALYSIS BY TYPE
    92. GCC COUNTRIES MARKET ANALYSIS BY APPLICATION
    93. GCC COUNTRIES MARKET ANALYSIS BY END USE INDUSTRY
    94. GCC COUNTRIES MARKET ANALYSIS BY FORM
    95. SOUTH AFRICA MARKET ANALYSIS BY TYPE
    96. SOUTH AFRICA MARKET ANALYSIS BY APPLICATION
    97. SOUTH AFRICA MARKET ANALYSIS BY END USE INDUSTRY
    98. SOUTH AFRICA MARKET ANALYSIS BY FORM
    99. REST OF MEA MARKET ANALYSIS BY TYPE
    100. REST OF MEA MARKET ANALYSIS BY APPLICATION
    101. REST OF MEA MARKET ANALYSIS BY END USE INDUSTRY
    102. REST OF MEA MARKET ANALYSIS BY FORM
    103. KEY BUYING CRITERIA OF CHEMICALS AND MATERIALS
    104. RESEARCH PROCESS OF MRFR
    105. DRO ANALYSIS OF CHEMICALS AND MATERIALS
    106. DRIVERS IMPACT ANALYSIS: CHEMICALS AND MATERIALS
    107. RESTRAINTS IMPACT ANALYSIS: CHEMICALS AND MATERIALS
    108. SUPPLY / VALUE CHAIN: CHEMICALS AND MATERIALS
    109. CHEMICALS AND MATERIALS, BY TYPE, 2024 (% SHARE)
    110. CHEMICALS AND MATERIALS, BY TYPE, 2024 TO 2035 (USD Billion)
    111. CHEMICALS AND MATERIALS, BY APPLICATION, 2024 (% SHARE)
    112. CHEMICALS AND MATERIALS, BY APPLICATION, 2024 TO 2035 (USD Billion)
    113. CHEMICALS AND MATERIALS, BY END USE INDUSTRY, 2024 (% SHARE)
    114. CHEMICALS AND MATERIALS, BY END USE INDUSTRY, 2024 TO 2035 (USD Billion)
    115. CHEMICALS AND MATERIALS, BY FORM, 2024 (% SHARE)
    116. CHEMICALS AND MATERIALS, BY FORM, 2024 TO 2035 (USD Billion)
    117. BENCHMARKING OF MAJOR COMPETITORS
  7. LIST OF TABLES
    1. LIST OF ASSUMPTIONS
    2. North America MARKET SIZE ESTIMATES; FORECAST
      1. BY TYPE, 2025-2035 (USD Billion)
      2. BY APPLICATION, 2025-2035 (USD Billion)
      3. BY END USE INDUSTRY, 2025-2035 (USD Billion)
      4. BY FORM, 2025-2035 (USD Billion)
    3. US MARKET SIZE ESTIMATES; FORECAST
      1. BY TYPE, 2025-2035 (USD Billion)
      2. BY APPLICATION, 2025-2035 (USD Billion)
      3. BY END USE INDUSTRY, 2025-2035 (USD Billion)
      4. BY FORM, 2025-2035 (USD Billion)
    4. Canada MARKET SIZE ESTIMATES; FORECAST
      1. BY TYPE, 2025-2035 (USD Billion)
      2. BY APPLICATION, 2025-2035 (USD Billion)
      3. BY END USE INDUSTRY, 2025-2035 (USD Billion)
      4. BY FORM, 2025-2035 (USD Billion)
    5. Europe MARKET SIZE ESTIMATES; FORECAST
      1. BY TYPE, 2025-2035 (USD Billion)
      2. BY APPLICATION, 2025-2035 (USD Billion)
      3. BY END USE INDUSTRY, 2025-2035 (USD Billion)
      4. BY FORM, 2025-2035 (USD Billion)
    6. Germany MARKET SIZE ESTIMATES; FORECAST
      1. BY TYPE, 2025-2035 (USD Billion)
      2. BY APPLICATION, 2025-2035 (USD Billion)
      3. BY END USE INDUSTRY, 2025-2035 (USD Billion)
      4. BY FORM, 2025-2035 (USD Billion)
    7. UK MARKET SIZE ESTIMATES; FORECAST
      1. BY TYPE, 2025-2035 (USD Billion)
      2. BY APPLICATION, 2025-2035 (USD Billion)
      3. BY END USE INDUSTRY, 2025-2035 (USD Billion)
      4. BY FORM, 2025-2035 (USD Billion)
    8. France MARKET SIZE ESTIMATES; FORECAST
      1. BY TYPE, 2025-2035 (USD Billion)
      2. BY APPLICATION, 2025-2035 (USD Billion)
      3. BY END USE INDUSTRY, 2025-2035 (USD Billion)
      4. BY FORM, 2025-2035 (USD Billion)
    9. Russia MARKET SIZE ESTIMATES; FORECAST
      1. BY TYPE, 2025-2035 (USD Billion)
      2. BY APPLICATION, 2025-2035 (USD Billion)
      3. BY END USE INDUSTRY, 2025-2035 (USD Billion)
      4. BY FORM, 2025-2035 (USD Billion)
    10. Italy MARKET SIZE ESTIMATES; FORECAST
      1. BY TYPE, 2025-2035 (USD Billion)
      2. BY APPLICATION, 2025-2035 (USD Billion)
      3. BY END USE INDUSTRY, 2025-2035 (USD Billion)
      4. BY FORM, 2025-2035 (USD Billion)
    11. Spain MARKET SIZE ESTIMATES; FORECAST
      1. BY TYPE, 2025-2035 (USD Billion)
      2. BY APPLICATION, 2025-2035 (USD Billion)
      3. BY END USE INDUSTRY, 2025-2035 (USD Billion)
      4. BY FORM, 2025-2035 (USD Billion)
    12. Rest of Europe MARKET SIZE ESTIMATES; FORECAST
      1. BY TYPE, 2025-2035 (USD Billion)
      2. BY APPLICATION, 2025-2035 (USD Billion)
      3. BY END USE INDUSTRY, 2025-2035 (USD Billion)
      4. BY FORM, 2025-2035 (USD Billion)
    13. APAC MARKET SIZE ESTIMATES; FORECAST
      1. BY TYPE, 2025-2035 (USD Billion)
      2. BY APPLICATION, 2025-2035 (USD Billion)
      3. BY END USE INDUSTRY, 2025-2035 (USD Billion)
      4. BY FORM, 2025-2035 (USD Billion)
    14. China MARKET SIZE ESTIMATES; FORECAST
      1. BY TYPE, 2025-2035 (USD Billion)
      2. BY APPLICATION, 2025-2035 (USD Billion)
      3. BY END USE INDUSTRY, 2025-2035 (USD Billion)
      4. BY FORM, 2025-2035 (USD Billion)
    15. India MARKET SIZE ESTIMATES; FORECAST
      1. BY TYPE, 2025-2035 (USD Billion)
      2. BY APPLICATION, 2025-2035 (USD Billion)
      3. BY END USE INDUSTRY, 2025-2035 (USD Billion)
      4. BY FORM, 2025-2035 (USD Billion)
    16. Japan MARKET SIZE ESTIMATES; FORECAST
      1. BY TYPE, 2025-2035 (USD Billion)
      2. BY APPLICATION, 2025-2035 (USD Billion)
      3. BY END USE INDUSTRY, 2025-2035 (USD Billion)
      4. BY FORM, 2025-2035 (USD Billion)
    17. South Korea MARKET SIZE ESTIMATES; FORECAST
      1. BY TYPE, 2025-2035 (USD Billion)
      2. BY APPLICATION, 2025-2035 (USD Billion)
      3. BY END USE INDUSTRY, 2025-2035 (USD Billion)
      4. BY FORM, 2025-2035 (USD Billion)
    18. Malaysia MARKET SIZE ESTIMATES; FORECAST
      1. BY TYPE, 2025-2035 (USD Billion)
      2. BY APPLICATION, 2025-2035 (USD Billion)
      3. BY END USE INDUSTRY, 2025-2035 (USD Billion)
      4. BY FORM, 2025-2035 (USD Billion)
    19. Thailand MARKET SIZE ESTIMATES; FORECAST
      1. BY TYPE, 2025-2035 (USD Billion)
      2. BY APPLICATION, 2025-2035 (USD Billion)
      3. BY END USE INDUSTRY, 2025-2035 (USD Billion)
      4. BY FORM, 2025-2035 (USD Billion)
    20. Indonesia MARKET SIZE ESTIMATES; FORECAST
      1. BY TYPE, 2025-2035 (USD Billion)
      2. BY APPLICATION, 2025-2035 (USD Billion)
      3. BY END USE INDUSTRY, 2025-2035 (USD Billion)
      4. BY FORM, 2025-2035 (USD Billion)
    21. Rest of APAC MARKET SIZE ESTIMATES; FORECAST
      1. BY TYPE, 2025-2035 (USD Billion)
      2. BY APPLICATION, 2025-2035 (USD Billion)
      3. BY END USE INDUSTRY, 2025-2035 (USD Billion)
      4. BY FORM, 2025-2035 (USD Billion)
    22. South America MARKET SIZE ESTIMATES; FORECAST
      1. BY TYPE, 2025-2035 (USD Billion)
      2. BY APPLICATION, 2025-2035 (USD Billion)
      3. BY END USE INDUSTRY, 2025-2035 (USD Billion)
      4. BY FORM, 2025-2035 (USD Billion)
    23. Brazil MARKET SIZE ESTIMATES; FORECAST
      1. BY TYPE, 2025-2035 (USD Billion)
      2. BY APPLICATION, 2025-2035 (USD Billion)
      3. BY END USE INDUSTRY, 2025-2035 (USD Billion)
      4. BY FORM, 2025-2035 (USD Billion)
    24. Mexico MARKET SIZE ESTIMATES; FORECAST
      1. BY TYPE, 2025-2035 (USD Billion)
      2. BY APPLICATION, 2025-2035 (USD Billion)
      3. BY END USE INDUSTRY, 2025-2035 (USD Billion)
      4. BY FORM, 2025-2035 (USD Billion)
    25. Argentina MARKET SIZE ESTIMATES; FORECAST
      1. BY TYPE, 2025-2035 (USD Billion)
      2. BY APPLICATION, 2025-2035 (USD Billion)
      3. BY END USE INDUSTRY, 2025-2035 (USD Billion)
      4. BY FORM, 2025-2035 (USD Billion)
    26. Rest of South America MARKET SIZE ESTIMATES; FORECAST
      1. BY TYPE, 2025-2035 (USD Billion)
      2. BY APPLICATION, 2025-2035 (USD Billion)
      3. BY END USE INDUSTRY, 2025-2035 (USD Billion)
      4. BY FORM, 2025-2035 (USD Billion)
    27. MEA MARKET SIZE ESTIMATES; FORECAST
      1. BY TYPE, 2025-2035 (USD Billion)
      2. BY APPLICATION, 2025-2035 (USD Billion)
      3. BY END USE INDUSTRY, 2025-2035 (USD Billion)
      4. BY FORM, 2025-2035 (USD Billion)
    28. GCC Countries MARKET SIZE ESTIMATES; FORECAST
      1. BY TYPE, 2025-2035 (USD Billion)
      2. BY APPLICATION, 2025-2035 (USD Billion)
      3. BY END USE INDUSTRY, 2025-2035 (USD Billion)
      4. BY FORM, 2025-2035 (USD Billion)
    29. South Africa MARKET SIZE ESTIMATES; FORECAST
      1. BY TYPE, 2025-2035 (USD Billion)
      2. BY APPLICATION, 2025-2035 (USD Billion)
      3. BY END USE INDUSTRY, 2025-2035 (USD Billion)
      4. BY FORM, 2025-2035 (USD Billion)
    30. Rest of MEA MARKET SIZE ESTIMATES; FORECAST
      1. BY TYPE, 2025-2035 (USD Billion)
      2. BY APPLICATION, 2025-2035 (USD Billion)
      3. BY END USE INDUSTRY, 2025-2035 (USD Billion)
      4. BY FORM, 2025-2035 (USD Billion)
    31. PRODUCT LAUNCH/PRODUCT DEVELOPMENT/APPROVAL
    32. ACQUISITION/PARTNERSHIP

Ion Exchange Resins Market Segmentation


  • Ion Exchange Resins Market By Type (USD Billion, 2019-2032)

    • Cation Exchange Resins
    • Anion Exchange Resins
    • Mixed Bed Resins

  • Ion Exchange Resins Market By Application (USD Billion, 2019-2032)

    • Water Treatment
    • Chemical Processing
    • Pharmaceuticals
    • Food and Beverage
    • Nuclear Power

  • Ion Exchange Resins Market By End Use Industry (USD Billion, 2019-2032)

    • Power Generation
    • Water Treatment Plants
    • Pulp and Paper
    • Mining
    • Electronics

  • Ion Exchange Resins Market By Form (USD Billion, 2019-2032)

    • Granular
    • Bead
    • Synthetic
    • Natural

  • Ion Exchange Resins Market By Regional (USD Billion, 2019-2032)

    • North America
    • Europe
    • South America
    • Asia Pacific
    • Middle East and Africa

Ion Exchange Resins Market Regional Outlook (USD Billion, 2019-2032)


  • North America Outlook (USD Billion, 2019-2032)

    • North America Ion Exchange Resins Market by Type

      • Cation Exchange Resins
      • Anion Exchange Resins
      • Mixed Bed Resins
    • North America Ion Exchange Resins Market by Application Type

      • Water Treatment
      • Chemical Processing
      • Pharmaceuticals
      • Food and Beverage
      • Nuclear Power
    • North America Ion Exchange Resins Market by End Use Industry Type

      • Power Generation
      • Water Treatment Plants
      • Pulp and Paper
      • Mining
      • Electronics
    • North America Ion Exchange Resins Market by Form Type

      • Granular
      • Bead
      • Synthetic
      • Natural
    • North America Ion Exchange Resins Market by Regional Type

      • US
      • Canada
    • US Outlook (USD Billion, 2019-2032)
    • US Ion Exchange Resins Market by Type

      • Cation Exchange Resins
      • Anion Exchange Resins
      • Mixed Bed Resins
    • US Ion Exchange Resins Market by Application Type

      • Water Treatment
      • Chemical Processing
      • Pharmaceuticals
      • Food and Beverage
      • Nuclear Power
    • US Ion Exchange Resins Market by End Use Industry Type

      • Power Generation
      • Water Treatment Plants
      • Pulp and Paper
      • Mining
      • Electronics
    • US Ion Exchange Resins Market by Form Type

      • Granular
      • Bead
      • Synthetic
      • Natural
    • CANADA Outlook (USD Billion, 2019-2032)
    • CANADA Ion Exchange Resins Market by Type

      • Cation Exchange Resins
      • Anion Exchange Resins
      • Mixed Bed Resins
    • CANADA Ion Exchange Resins Market by Application Type

      • Water Treatment
      • Chemical Processing
      • Pharmaceuticals
      • Food and Beverage
      • Nuclear Power
    • CANADA Ion Exchange Resins Market by End Use Industry Type

      • Power Generation
      • Water Treatment Plants
      • Pulp and Paper
      • Mining
      • Electronics
    • CANADA Ion Exchange Resins Market by Form Type

      • Granular
      • Bead
      • Synthetic
      • Natural
  • Europe Outlook (USD Billion, 2019-2032)

    • Europe Ion Exchange Resins Market by Type

      • Cation Exchange Resins
      • Anion Exchange Resins
      • Mixed Bed Resins
    • Europe Ion Exchange Resins Market by Application Type

      • Water Treatment
      • Chemical Processing
      • Pharmaceuticals
      • Food and Beverage
      • Nuclear Power
    • Europe Ion Exchange Resins Market by End Use Industry Type

      • Power Generation
      • Water Treatment Plants
      • Pulp and Paper
      • Mining
      • Electronics
    • Europe Ion Exchange Resins Market by Form Type

      • Granular
      • Bead
      • Synthetic
      • Natural
    • Europe Ion Exchange Resins Market by Regional Type

      • Germany
      • UK
      • France
      • Russia
      • Italy
      • Spain
      • Rest of Europe
    • GERMANY Outlook (USD Billion, 2019-2032)
    • GERMANY Ion Exchange Resins Market by Type

      • Cation Exchange Resins
      • Anion Exchange Resins
      • Mixed Bed Resins
    • GERMANY Ion Exchange Resins Market by Application Type

      • Water Treatment
      • Chemical Processing
      • Pharmaceuticals
      • Food and Beverage
      • Nuclear Power
    • GERMANY Ion Exchange Resins Market by End Use Industry Type

      • Power Generation
      • Water Treatment Plants
      • Pulp and Paper
      • Mining
      • Electronics
    • GERMANY Ion Exchange Resins Market by Form Type

      • Granular
      • Bead
      • Synthetic
      • Natural
    • UK Outlook (USD Billion, 2019-2032)
    • UK Ion Exchange Resins Market by Type

      • Cation Exchange Resins
      • Anion Exchange Resins
      • Mixed Bed Resins
    • UK Ion Exchange Resins Market by Application Type

      • Water Treatment
      • Chemical Processing
      • Pharmaceuticals
      • Food and Beverage
      • Nuclear Power
    • UK Ion Exchange Resins Market by End Use Industry Type

      • Power Generation
      • Water Treatment Plants
      • Pulp and Paper
      • Mining
      • Electronics
    • UK Ion Exchange Resins Market by Form Type

      • Granular
      • Bead
      • Synthetic
      • Natural
    • FRANCE Outlook (USD Billion, 2019-2032)
    • FRANCE Ion Exchange Resins Market by Type

      • Cation Exchange Resins
      • Anion Exchange Resins
      • Mixed Bed Resins
    • FRANCE Ion Exchange Resins Market by Application Type

      • Water Treatment
      • Chemical Processing
      • Pharmaceuticals
      • Food and Beverage
      • Nuclear Power
    • FRANCE Ion Exchange Resins Market by End Use Industry Type

      • Power Generation
      • Water Treatment Plants
      • Pulp and Paper
      • Mining
      • Electronics
    • FRANCE Ion Exchange Resins Market by Form Type

      • Granular
      • Bead
      • Synthetic
      • Natural
    • RUSSIA Outlook (USD Billion, 2019-2032)
    • RUSSIA Ion Exchange Resins Market by Type

      • Cation Exchange Resins
      • Anion Exchange Resins
      • Mixed Bed Resins
    • RUSSIA Ion Exchange Resins Market by Application Type

      • Water Treatment
      • Chemical Processing
      • Pharmaceuticals
      • Food and Beverage
      • Nuclear Power
    • RUSSIA Ion Exchange Resins Market by End Use Industry Type

      • Power Generation
      • Water Treatment Plants
      • Pulp and Paper
      • Mining
      • Electronics
    • RUSSIA Ion Exchange Resins Market by Form Type

      • Granular
      • Bead
      • Synthetic
      • Natural
    • ITALY Outlook (USD Billion, 2019-2032)
    • ITALY Ion Exchange Resins Market by Type

      • Cation Exchange Resins
      • Anion Exchange Resins
      • Mixed Bed Resins
    • ITALY Ion Exchange Resins Market by Application Type

      • Water Treatment
      • Chemical Processing
      • Pharmaceuticals
      • Food and Beverage
      • Nuclear Power
    • ITALY Ion Exchange Resins Market by End Use Industry Type

      • Power Generation
      • Water Treatment Plants
      • Pulp and Paper
      • Mining
      • Electronics
    • ITALY Ion Exchange Resins Market by Form Type

      • Granular
      • Bead
      • Synthetic
      • Natural
    • SPAIN Outlook (USD Billion, 2019-2032)
    • SPAIN Ion Exchange Resins Market by Type

      • Cation Exchange Resins
      • Anion Exchange Resins
      • Mixed Bed Resins
    • SPAIN Ion Exchange Resins Market by Application Type

      • Water Treatment
      • Chemical Processing
      • Pharmaceuticals
      • Food and Beverage
      • Nuclear Power
    • SPAIN Ion Exchange Resins Market by End Use Industry Type

      • Power Generation
      • Water Treatment Plants
      • Pulp and Paper
      • Mining
      • Electronics
    • SPAIN Ion Exchange Resins Market by Form Type

      • Granular
      • Bead
      • Synthetic
      • Natural
    • REST OF EUROPE Outlook (USD Billion, 2019-2032)
    • REST OF EUROPE Ion Exchange Resins Market by Type

      • Cation Exchange Resins
      • Anion Exchange Resins
      • Mixed Bed Resins
    • REST OF EUROPE Ion Exchange Resins Market by Application Type

      • Water Treatment
      • Chemical Processing
      • Pharmaceuticals
      • Food and Beverage
      • Nuclear Power
    • REST OF EUROPE Ion Exchange Resins Market by End Use Industry Type

      • Power Generation
      • Water Treatment Plants
      • Pulp and Paper
      • Mining
      • Electronics
    • REST OF EUROPE Ion Exchange Resins Market by Form Type

      • Granular
      • Bead
      • Synthetic
      • Natural
  • APAC Outlook (USD Billion, 2019-2032)

    • APAC Ion Exchange Resins Market by Type

      • Cation Exchange Resins
      • Anion Exchange Resins
      • Mixed Bed Resins
    • APAC Ion Exchange Resins Market by Application Type

      • Water Treatment
      • Chemical Processing
      • Pharmaceuticals
      • Food and Beverage
      • Nuclear Power
    • APAC Ion Exchange Resins Market by End Use Industry Type

      • Power Generation
      • Water Treatment Plants
      • Pulp and Paper
      • Mining
      • Electronics
    • APAC Ion Exchange Resins Market by Form Type

      • Granular
      • Bead
      • Synthetic
      • Natural
    • APAC Ion Exchange Resins Market by Regional Type

      • China
      • India
      • Japan
      • South Korea
      • Malaysia
      • Thailand
      • Indonesia
      • Rest of APAC
    • CHINA Outlook (USD Billion, 2019-2032)
    • CHINA Ion Exchange Resins Market by Type

      • Cation Exchange Resins
      • Anion Exchange Resins
      • Mixed Bed Resins
    • CHINA Ion Exchange Resins Market by Application Type

      • Water Treatment
      • Chemical Processing
      • Pharmaceuticals
      • Food and Beverage
      • Nuclear Power
    • CHINA Ion Exchange Resins Market by End Use Industry Type

      • Power Generation
      • Water Treatment Plants
      • Pulp and Paper
      • Mining
      • Electronics
    • CHINA Ion Exchange Resins Market by Form Type

      • Granular
      • Bead
      • Synthetic
      • Natural
    • INDIA Outlook (USD Billion, 2019-2032)
    • INDIA Ion Exchange Resins Market by Type

      • Cation Exchange Resins
      • Anion Exchange Resins
      • Mixed Bed Resins
    • INDIA Ion Exchange Resins Market by Application Type

      • Water Treatment
      • Chemical Processing
      • Pharmaceuticals
      • Food and Beverage
      • Nuclear Power
    • INDIA Ion Exchange Resins Market by End Use Industry Type

      • Power Generation
      • Water Treatment Plants
      • Pulp and Paper
      • Mining
      • Electronics
    • INDIA Ion Exchange Resins Market by Form Type

      • Granular
      • Bead
      • Synthetic
      • Natural
    • JAPAN Outlook (USD Billion, 2019-2032)
    • JAPAN Ion Exchange Resins Market by Type

      • Cation Exchange Resins
      • Anion Exchange Resins
      • Mixed Bed Resins
    • JAPAN Ion Exchange Resins Market by Application Type

      • Water Treatment
      • Chemical Processing
      • Pharmaceuticals
      • Food and Beverage
      • Nuclear Power
    • JAPAN Ion Exchange Resins Market by End Use Industry Type

      • Power Generation
      • Water Treatment Plants
      • Pulp and Paper
      • Mining
      • Electronics
    • JAPAN Ion Exchange Resins Market by Form Type

      • Granular
      • Bead
      • Synthetic
      • Natural
    • SOUTH KOREA Outlook (USD Billion, 2019-2032)
    • SOUTH KOREA Ion Exchange Resins Market by Type

      • Cation Exchange Resins
      • Anion Exchange Resins
      • Mixed Bed Resins
    • SOUTH KOREA Ion Exchange Resins Market by Application Type

      • Water Treatment
      • Chemical Processing
      • Pharmaceuticals
      • Food and Beverage
      • Nuclear Power
    • SOUTH KOREA Ion Exchange Resins Market by End Use Industry Type

      • Power Generation
      • Water Treatment Plants
      • Pulp and Paper
      • Mining
      • Electronics
    • SOUTH KOREA Ion Exchange Resins Market by Form Type

      • Granular
      • Bead
      • Synthetic
      • Natural
    • MALAYSIA Outlook (USD Billion, 2019-2032)
    • MALAYSIA Ion Exchange Resins Market by Type

      • Cation Exchange Resins
      • Anion Exchange Resins
      • Mixed Bed Resins
    • MALAYSIA Ion Exchange Resins Market by Application Type

      • Water Treatment
      • Chemical Processing
      • Pharmaceuticals
      • Food and Beverage
      • Nuclear Power
    • MALAYSIA Ion Exchange Resins Market by End Use Industry Type

      • Power Generation
      • Water Treatment Plants
      • Pulp and Paper
      • Mining
      • Electronics
    • MALAYSIA Ion Exchange Resins Market by Form Type

      • Granular
      • Bead
      • Synthetic
      • Natural
    • THAILAND Outlook (USD Billion, 2019-2032)
    • THAILAND Ion Exchange Resins Market by Type

      • Cation Exchange Resins
      • Anion Exchange Resins
      • Mixed Bed Resins
    • THAILAND Ion Exchange Resins Market by Application Type

      • Water Treatment
      • Chemical Processing
      • Pharmaceuticals
      • Food and Beverage
      • Nuclear Power
    • THAILAND Ion Exchange Resins Market by End Use Industry Type

      • Power Generation
      • Water Treatment Plants
      • Pulp and Paper
      • Mining
      • Electronics
    • THAILAND Ion Exchange Resins Market by Form Type

      • Granular
      • Bead
      • Synthetic
      • Natural
    • INDONESIA Outlook (USD Billion, 2019-2032)
    • INDONESIA Ion Exchange Resins Market by Type

      • Cation Exchange Resins
      • Anion Exchange Resins
      • Mixed Bed Resins
    • INDONESIA Ion Exchange Resins Market by Application Type

      • Water Treatment
      • Chemical Processing
      • Pharmaceuticals
      • Food and Beverage
      • Nuclear Power
    • INDONESIA Ion Exchange Resins Market by End Use Industry Type

      • Power Generation
      • Water Treatment Plants
      • Pulp and Paper
      • Mining
      • Electronics
    • INDONESIA Ion Exchange Resins Market by Form Type

      • Granular
      • Bead
      • Synthetic
      • Natural
    • REST OF APAC Outlook (USD Billion, 2019-2032)
    • REST OF APAC Ion Exchange Resins Market by Type

      • Cation Exchange Resins
      • Anion Exchange Resins
      • Mixed Bed Resins
    • REST OF APAC Ion Exchange Resins Market by Application Type

      • Water Treatment
      • Chemical Processing
      • Pharmaceuticals
      • Food and Beverage
      • Nuclear Power
    • REST OF APAC Ion Exchange Resins Market by End Use Industry Type

      • Power Generation
      • Water Treatment Plants
      • Pulp and Paper
      • Mining
      • Electronics
    • REST OF APAC Ion Exchange Resins Market by Form Type

      • Granular
      • Bead
      • Synthetic
      • Natural
  • South America Outlook (USD Billion, 2019-2032)

    • South America Ion Exchange Resins Market by Type

      • Cation Exchange Resins
      • Anion Exchange Resins
      • Mixed Bed Resins
    • South America Ion Exchange Resins Market by Application Type

      • Water Treatment
      • Chemical Processing
      • Pharmaceuticals
      • Food and Beverage
      • Nuclear Power
    • South America Ion Exchange Resins Market by End Use Industry Type

      • Power Generation
      • Water Treatment Plants
      • Pulp and Paper
      • Mining
      • Electronics
    • South America Ion Exchange Resins Market by Form Type

      • Granular
      • Bead
      • Synthetic
      • Natural
    • South America Ion Exchange Resins Market by Regional Type

      • Brazil
      • Mexico
      • Argentina
      • Rest of South America
    • BRAZIL Outlook (USD Billion, 2019-2032)
    • BRAZIL Ion Exchange Resins Market by Type

      • Cation Exchange Resins
      • Anion Exchange Resins
      • Mixed Bed Resins
    • BRAZIL Ion Exchange Resins Market by Application Type

      • Water Treatment
      • Chemical Processing
      • Pharmaceuticals
      • Food and Beverage
      • Nuclear Power
    • BRAZIL Ion Exchange Resins Market by End Use Industry Type

      • Power Generation
      • Water Treatment Plants
      • Pulp and Paper
      • Mining
      • Electronics
    • BRAZIL Ion Exchange Resins Market by Form Type

      • Granular
      • Bead
      • Synthetic
      • Natural
    • MEXICO Outlook (USD Billion, 2019-2032)
    • MEXICO Ion Exchange Resins Market by Type

      • Cation Exchange Resins
      • Anion Exchange Resins
      • Mixed Bed Resins
    • MEXICO Ion Exchange Resins Market by Application Type

      • Water Treatment
      • Chemical Processing
      • Pharmaceuticals
      • Food and Beverage
      • Nuclear Power
    • MEXICO Ion Exchange Resins Market by End Use Industry Type

      • Power Generation
      • Water Treatment Plants
      • Pulp and Paper
      • Mining
      • Electronics
    • MEXICO Ion Exchange Resins Market by Form Type

      • Granular
      • Bead
      • Synthetic
      • Natural
    • ARGENTINA Outlook (USD Billion, 2019-2032)
    • ARGENTINA Ion Exchange Resins Market by Type

      • Cation Exchange Resins
      • Anion Exchange Resins
      • Mixed Bed Resins
    • ARGENTINA Ion Exchange Resins Market by Application Type

      • Water Treatment
      • Chemical Processing
      • Pharmaceuticals
      • Food and Beverage
      • Nuclear Power
    • ARGENTINA Ion Exchange Resins Market by End Use Industry Type

      • Power Generation
      • Water Treatment Plants
      • Pulp and Paper
      • Mining
      • Electronics
    • ARGENTINA Ion Exchange Resins Market by Form Type

      • Granular
      • Bead
      • Synthetic
      • Natural
    • REST OF SOUTH AMERICA Outlook (USD Billion, 2019-2032)
    • REST OF SOUTH AMERICA Ion Exchange Resins Market by Type

      • Cation Exchange Resins
      • Anion Exchange Resins
      • Mixed Bed Resins
    • REST OF SOUTH AMERICA Ion Exchange Resins Market by Application Type

      • Water Treatment
      • Chemical Processing
      • Pharmaceuticals
      • Food and Beverage
      • Nuclear Power
    • REST OF SOUTH AMERICA Ion Exchange Resins Market by End Use Industry Type

      • Power Generation
      • Water Treatment Plants
      • Pulp and Paper
      • Mining
      • Electronics
    • REST OF SOUTH AMERICA Ion Exchange Resins Market by Form Type

      • Granular
      • Bead
      • Synthetic
      • Natural
  • MEA Outlook (USD Billion, 2019-2032)

    • MEA Ion Exchange Resins Market by Type

      • Cation Exchange Resins
      • Anion Exchange Resins
      • Mixed Bed Resins
    • MEA Ion Exchange Resins Market by Application Type

      • Water Treatment
      • Chemical Processing
      • Pharmaceuticals
      • Food and Beverage
      • Nuclear Power
    • MEA Ion Exchange Resins Market by End Use Industry Type

      • Power Generation
      • Water Treatment Plants
      • Pulp and Paper
      • Mining
      • Electronics
    • MEA Ion Exchange Resins Market by Form Type

      • Granular
      • Bead
      • Synthetic
      • Natural
    • MEA Ion Exchange Resins Market by Regional Type

      • GCC Countries
      • South Africa
      • Rest of MEA
    • GCC COUNTRIES Outlook (USD Billion, 2019-2032)
    • GCC COUNTRIES Ion Exchange Resins Market by Type

      • Cation Exchange Resins
      • Anion Exchange Resins
      • Mixed Bed Resins
    • GCC COUNTRIES Ion Exchange Resins Market by Application Type

      • Water Treatment
      • Chemical Processing
      • Pharmaceuticals
      • Food and Beverage
      • Nuclear Power
    • GCC COUNTRIES Ion Exchange Resins Market by End Use Industry Type

      • Power Generation
      • Water Treatment Plants
      • Pulp and Paper
      • Mining
      • Electronics
    • GCC COUNTRIES Ion Exchange Resins Market by Form Type

      • Granular
      • Bead
      • Synthetic
      • Natural
    • SOUTH AFRICA Outlook (USD Billion, 2019-2032)
    • SOUTH AFRICA Ion Exchange Resins Market by Type

      • Cation Exchange Resins
      • Anion Exchange Resins
      • Mixed Bed Resins
    • SOUTH AFRICA Ion Exchange Resins Market by Application Type

      • Water Treatment
      • Chemical Processing
      • Pharmaceuticals
      • Food and Beverage
      • Nuclear Power
    • SOUTH AFRICA Ion Exchange Resins Market by End Use Industry Type

      • Power Generation
      • Water Treatment Plants
      • Pulp and Paper
      • Mining
      • Electronics
    • SOUTH AFRICA Ion Exchange Resins Market by Form Type

      • Granular
      • Bead
      • Synthetic
      • Natural
    • REST OF MEA Outlook (USD Billion, 2019-2032)
    • REST OF MEA Ion Exchange Resins Market by Type

      • Cation Exchange Resins
      • Anion Exchange Resins
      • Mixed Bed Resins
    • REST OF MEA Ion Exchange Resins Market by Application Type

      • Water Treatment
      • Chemical Processing
      • Pharmaceuticals
      • Food and Beverage
      • Nuclear Power
    • REST OF MEA Ion Exchange Resins Market by End Use Industry Type

      • Power Generation
      • Water Treatment Plants
      • Pulp and Paper
      • Mining
      • Electronics
    • REST OF MEA Ion Exchange Resins Market by Form Type

      • Granular
      • Bead
      • Synthetic
      • Natural


Infographic

Free Sample Request

Kindly complete the form below to receive a free sample of this Report

Get Free Sample

Customer Strories

“I am very pleased with how market segments have been defined in a relevant way for my purposes (such as "Portable Freezers & refrigerators" and "last-mile"). In general the report is well structured. Thanks very much for your efforts.”

Victoria Milne

Founder

Compare Licence

×
Features License Type
Single User Multiuser License Enterprise User
Price $4,950 $5,950 $7,250
Maximum User Access Limit 1 User Upto 10 Users Unrestricted Access Throughout the Organization
Free Customization
Direct Access to Analyst
Deliverable Format
Platform Access
Discount on Next Purchase 10% 15% 15%
Printable Versions