IoT Professional Services Market (2026 - 2035)

ID: MRFR/ICT/6377-HCR
110 Pages
Apoorva Priyadarshi
Last Updated: July 17, 2026
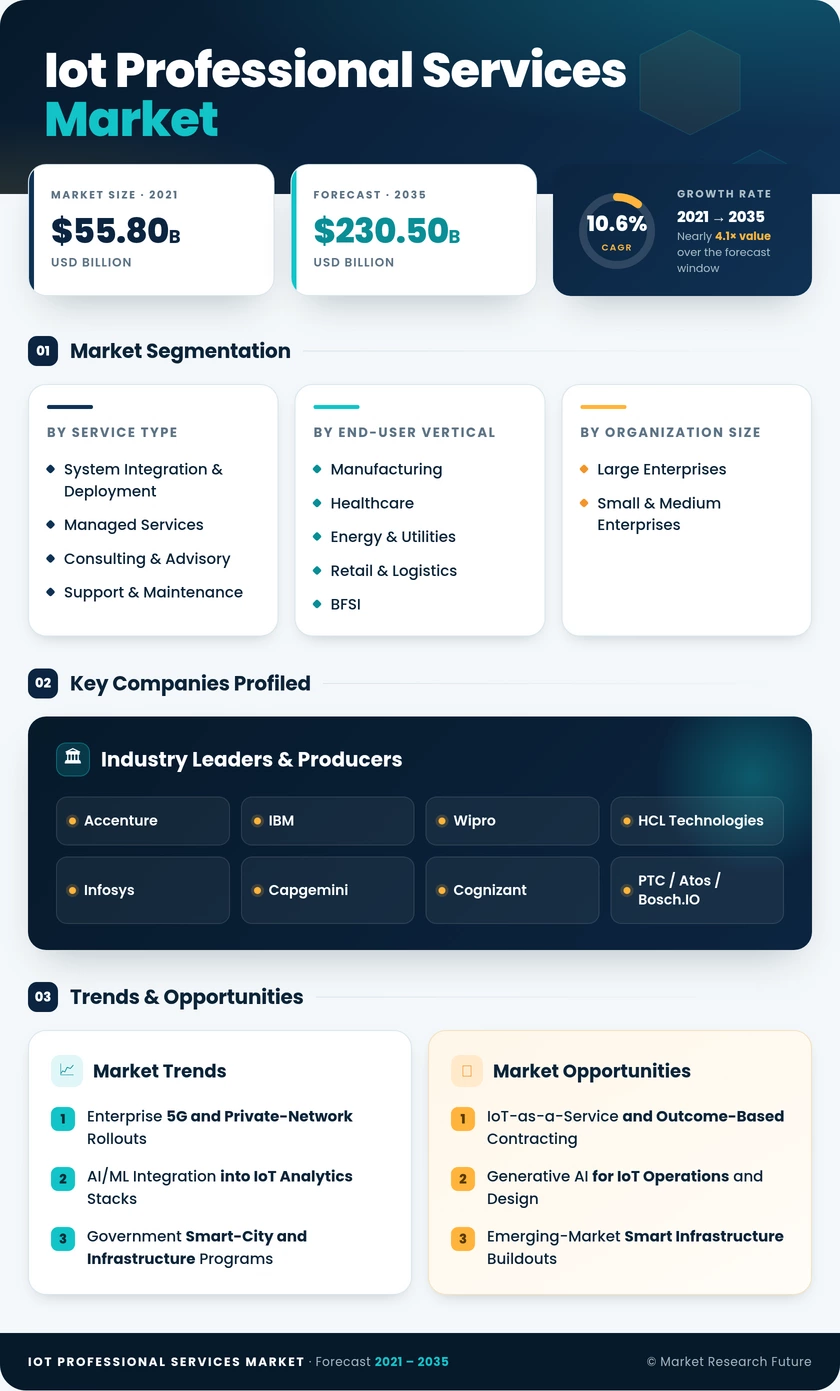
IoT Professional Services Market Size, Share and Trends Analysis Report By Service (IoT Consulting Services, IoT System Design and Implementation Services, Support and Maintenance Services, Education and Training Services), Organization Size (Large Enterprises, Small and Medium-sized Enterprises), Application Area (Smart Cities, Smart Buildings, Smart Manufacturing, Smart Retail, Smart Healthcare, Smart Transport - Logistics and Smart Energy) and Region (North America, Europe and the Rest of the World) - Forecast till 2035
IoT Professional Services Market
Market Size
Forecast Period2026-2035
CAGR (2026-2035)10.6%
2025 Market SizeUSD 84.2 Billion
2035 Market SizeUSD 230.5 Billion
Key Players
Accenture
IBM
Wipro
HCL Technologies
Infosys
Capgemini
Opportunities
  • IoT-as-a-Service and Outcome-Based Contracting
  • Generative AI for IoT Operations and Design
  • Emerging-Market Smart Infrastructure Buildouts
  1. 1 Market Overview |
    1. 1.1 Study Assumptions & Market Definition |
    2. 1.2 Scope of the Study |
    3. 1.3 Research Methodology
  2. 2 Market Summary & Key Takeaways
  3. 3 Market Dynamics |
    1. 3.1 Market Drivers Analysis | |
      1. 3.1.1 Enterprise 5G and Private-Network Rollouts | |
      2. 3.1.2 AI/ML Integration into IoT Analytics Stacks | |
      3. 3.1.3 Government Smart-City and Infrastructure Programs | |
      4. 3.1.4 Cybersecurity and Regulatory Compliance Mandates | |
      5. 3.1.5 Edge-Computing and Fog-Architecture Adoption | |
      6. 3.1.6 Healthcare and Remote-Monitoring Digitization | |
      7. 3.1.7 Digital-Twin and Industrial-Metaverse Deployments |
    2. 3.2 Market Restraints Analysis | |
      1. 3.2.1 Talent Shortage in Specialized IoT Skills | |
      2. 3.2.2 Interoperability Fragmentation Across Platforms | |
      3. 3.2.3 Budget Constraints Among SMEs | |
      4. 3.2.4 Data Sovereignty and Cross-Border Restrictions | |
      5. 3.2.5 Vendor Lock-In Concerns Delaying Procurement |
    3. 3.3 Market Opportunity Analysis | |
      1. 3.3.1 IoT-as-a-Service and Outcome-Based Contracting | |
      2. 3.3.2 Generative AI for IoT Operations and Design | |
      3. 3.3.3 Emerging-Market Smart Infrastructure Buildouts | |
      4. 3.3.4 Data Monetization Advisory and Analytics Platforms | |
      5. 3.3.5 Sovereign-Cloud and On-Premise IoT Architectures |
    4. 3.4 Industry Value Chain Analysis |
    5. 3.5 Porter's Five Forces Analysis
  4. 4 Global IoT Professional Services Market Size & Forecast (2021–2035) |
    1. 4.1 Historical Market Size (2021–2025) |
    2. 4.2 Current & Forecast Market Size (2026–2035) |
    3. 4.3 Market Size by Revenue (USD Billion) |
    4. 4.4 Year-over-Year Growth Analysis
  5. 5 Segmentation Analysis |
    1. 5.1 By Service Type | |
      1. 5.1.1 System Integration & Deployment | |
      2. 5.1.2 Managed Services | |
      3. 5.1.3 Consulting & Advisory | |
      4. 5.1.4 Support & Maintenance |
    2. 5.2 By End-User Vertical | |
      1. 5.2.1 Manufacturing | |
      2. 5.2.2 Healthcare | |
      3. 5.2.3 Energy & Utilities | |
      4. 5.2.4 Retail & Logistics | |
      5. 5.2.5 BFSI | |
      6. 5.2.6 Others (Government, Agriculture, Telecom) |
    3. 5.3 By Organization Size | |
      1. 5.3.1 Large Enterprises | |
      2. 5.3.2 Small & Medium Enterprises
  6. 6 Regional Analysis |
    1. 6.1 North America | |
      1. 6.1.1 United States | |
      2. 6.1.2 Canada | |
      3. 6.1.3 Mexico |
    2. 6.2 Europe | |
      1. 6.2.1 Germany | |
      2. 6.2.2 United Kingdom | |
      3. 6.2.3 France | |
      4. 6.2.4 Rest of Europe |
    3. 6.3 Asia-Pacific | |
      1. 6.3.1 China | |
      2. 6.3.2 India | |
      3. 6.3.3 Japan | |
      4. 6.3.4 South Korea | |
      5. 6.3.5 Rest of Asia-Pacific |
    4. 6.4 South America | |
      1. 6.4.1 Brazil | |
      2. 6.4.2 Argentina | |
      3. 6.4.3 Rest of South America |
    5. 6.5 Middle East & Africa | |
      1. 6.5.1 UAE | |
      2. 6.5.2 Saudi Arabia | |
      3. 6.5.3 South Africa | |
      4. 6.5.4 Rest of Middle East & Africa
  7. 7 Competitive Landscape |
    1. 7.1 Market Share Analysis (2025) |
    2. 7.2 Competitive Benchmarking Matrix |
    3. 7.3 Company Profiles | |
      1. 7.3.1 Accenture | |
      2. 7.3.2 IBM
      3. 7.3.3 | |
      4. 7.3.4 Wipro | |
      5. 7.3.5 HCL Technologies | |
      6. 7.3.6 Infosys | |
      7. 7.3.7 Capgemini | |
      8. 7.3.8 Cognizant | |
      9. 7.3.9 PTC | |
      10. 7.3.10 TCS
  8. 8 Future Outlook & Strategic Recommendations (2026–2035) |
    1. 8.1 AI-Augmented IoT Operations |
    2. 8.2 Platform Economics and Ecosystem Orchestration |
    3. 8.3 Sustainability and ESG-Driven IoT Mandates |
    4. 8.4 Quantum-Resistant IoT Security Services
  9. 9 Recent Developments & News
  10. 10 Frequently Asked Questions (FAQs)
  11. 11 Report Scope & Methodology |
    1. 11.1 Study Period & Base Year |
    2. 11.2 Data Sources & Citations |
    3. 11.3 Abbreviations
  12. 12 LIST OF TABLES |
  13. TABLE 1 Global IoT Professional Services Market Size & Forecast, by Revenue (USD Billion), 2021–2035 |
  14. TABLE 2 Global IoT Professional Services Market — Year-over-Year Growth Analysis, 2021–2035 |
  15. TABLE 3 Market Driver Impact Analysis, 2026–2035 |
  16. TABLE 4 Market Restraint Impact Analysis, 2026–2035 |
  17. TABLE 5 Global IoT Professional Services Market Size, by Service Type, 2021–2035 (USD Billion) |
  18. TABLE 6 Global IoT Professional Services Market Size, by End-User Vertical, 2021–2035 (USD Billion) |
  19. TABLE 7 Global IoT Professional Services Market Size, by Organization Size, 2021–2035 (USD Billion) |
  20. TABLE 8 Global IoT Professional Services Market Size, by Region, 2021–2035 (USD Billion) |
  21. TABLE 9 North America IoT Professional Services Market Size, by Country, 2021–2035 (USD Billion) |
  22. TABLE 10 Europe IoT Professional Services Market Size, by Country, 2021–2035 (USD Billion) |
  23. TABLE 11 Asia-Pacific IoT Professional Services Market Size, by Country, 2021–2035 (USD Billion) |
  24. TABLE 12 South America IoT Professional Services Market Size, by Country, 2021–2035 (USD Billion) |
  25. TABLE 13 Middle East & Africa IoT Professional Services Market Size, by Country, 2021–2035 (USD Billion) |
  26. TABLE 14 North America IoT Professional Services Market Size, by Service Type, 2021–2035 (USD Billion) |
  27. TABLE 15 North America IoT Professional Services Market Size, by End-User Vertical, 2021–2035 (USD Billion) |
  28. TABLE 16 North America IoT Professional Services Market Size, by Organization Size, 2021–2035 (USD Billion) |
  29. TABLE 17 Europe IoT Professional Services Market Size, by Service Type, 2021–2035 (USD Billion) |
  30. TABLE 18 Europe IoT Professional Services Market Size, by End-User Vertical, 2021–2035 (USD Billion) |
  31. TABLE 19 Europe IoT Professional Services Market Size, by Organization Size, 2021–2035 (USD Billion) |
  32. TABLE 20 Asia-Pacific IoT Professional Services Market Size, by Service Type, 2021–2035 (USD Billion) |
  33. TABLE 21 Asia-Pacific IoT Professional Services Market Size, by End-User Vertical, 2021–2035 (USD Billion) |
  34. TABLE 22 Asia-Pacific IoT Professional Services Market Size, by Organization Size, 2021–2035 (USD Billion) |
  35. TABLE 23 South America IoT Professional Services Market Size, by Service Type, 2021–2035 (USD Billion) |
  36. TABLE 24 South America IoT Professional Services Market Size, by End-User Vertical, 2021–2035 (USD Billion) |
  37. TABLE 25 South America IoT Professional Services Market Size, by Organization Size, 2021–2035 (USD Billion) |
  38. TABLE 26 Middle East & Africa IoT Professional Services Market Size, by Service Type, 2021–2035 (USD Billion) |
  39. TABLE 27 Middle East & Africa IoT Professional Services Market Size, by End-User Vertical, 2021–2035 (USD Billion) |
  40. TABLE 28 Middle East & Africa IoT Professional Services Market Size, by Organization Size, 2021–2035 (USD Billion) |
  41. TABLE 29 United States IoT Professional Services Market Size, by Service Type, 2021–2035 (USD Billion) |
  42. TABLE 30 United States IoT Professional Services Market Size, by End-User Vertical, 2021–2035 (USD Billion) |
  43. TABLE 31 Canada IoT Professional Services Market Size, by Service Type, 2021–2035 (USD Billion) |
  44. TABLE 32 Canada IoT Professional Services Market Size, by End-User Vertical, 2021–2035 (USD Billion) |
  45. TABLE 33 Mexico IoT Professional Services Market Size, by Service Type, 2021–2035 (USD Billion) |
  46. TABLE 34 Mexico IoT Professional Services Market Size, by End-User Vertical, 2021–2035 (USD Billion) |
  47. TABLE 35 Germany IoT Professional Services Market Size, by Service Type, 2021–2035 (USD Billion) |
  48. TABLE 36 Germany IoT Professional Services Market Size, by End-User Vertical, 2021–2035 (USD Billion) |
  49. TABLE 37 United Kingdom IoT Professional Services Market Size, by Service Type, 2021–2035 (USD Billion) |
  50. TABLE 38 United Kingdom IoT Professional Services Market Size, by End-User Vertical, 2021–2035 (USD Billion) |
  51. TABLE 39 France IoT Professional Services Market Size, by Service Type, 2021–2035 (USD Billion) |
  52. TABLE 40 France IoT Professional Services Market Size, by End-User Vertical, 2021–2035 (USD Billion) |
  53. TABLE 41 China IoT Professional Services Market Size, by Service Type, 2021–2035 (USD Billion) |
  54. TABLE 42 China IoT Professional Services Market Size, by End-User Vertical, 2021–2035 (USD Billion) |
  55. TABLE 43 India IoT Professional Services Market Size, by Service Type, 2021–2035 (USD Billion) |
  56. TABLE 44 India IoT Professional Services Market Size, by End-User Vertical, 2021–2035 (USD Billion) |
  57. TABLE 45 Japan IoT Professional Services Market Size, by Service Type, 2021–2035 (USD Billion) |
  58. TABLE 46 Japan IoT Professional Services Market Size, by End-User Vertical, 2021–2035 (USD Billion) |
  59. TABLE 47 Brazil IoT Professional Services Market Size, by Service Type, 2021–2035 (USD Billion) |
  60. TABLE 48 Brazil IoT Professional Services Market Size, by End-User Vertical, 2021–2035 (USD Billion) |
  61. TABLE 49 UAE IoT Professional Services Market Size, by Service Type, 2021–2035 (USD Billion) |
  62. TABLE 50 UAE IoT Professional Services Market Size, by End-User Vertical, 2021–2035 (USD Billion) |
  63. TABLE 51 Saudi Arabia IoT Professional Services Market Size, by Service Type, 2021–2035 (USD Billion) |
  64. TABLE 52 Saudi Arabia IoT Professional Services Market Size, by End-User Vertical, 2021–2035 (USD Billion) |
  65. TABLE 53 Competitive Benchmarking Matrix — Global IoT Professional Services Market, 2025 |
  66. TABLE 54 Company Profiles — Key Players, Global IoT Professional Services Market |
  67. TABLE 55 Recent Developments & Strategic Announcements, 2023–2025 |
  68. TABLE 56 Report Scope & Methodology Summary
  69. 13 LIST OF FIGURES |
  70. FIGURE 1 Global IoT Professional Services Market Dynamics — Drivers, Restraints, Opportunities |
  71. FIGURE 2 Industry Value Chain Analysis — IoT Professional Services Market |
  72. FIGURE 3 Porter's Five Forces Analysis — IoT Professional Services Market |
  73. FIGURE 4 Global IoT Professional Services Market Size Trend (USD Billion), 2021–2035 |
  74. FIGURE 5 Global IoT Professional Services Market Share, by Service Type, 2025 (%) |
  75. FIGURE 6 Global IoT Professional Services Market Share, by End-User Vertical, 2025 (%) |
  76. FIGURE 7 Global IoT Professional Services Market Share, by Organization Size, 2025 (%) |
  77. FIGURE 8 Global IoT Professional Services Market Share, by Region, 2025 (%) |
  78. FIGURE 9 North America IoT Professional Services Market Size Trend, 2021–2035 (USD Billion) |
  79. FIGURE 10 Europe IoT Professional Services Market Size Trend, 2021–2035 (USD Billion) |
  80. FIGURE 11 Asia-Pacific IoT Professional Services Market Size Trend, 2021–2035 (USD Billion) |
  81. FIGURE 12 South America IoT Professional Services Market Size Trend, 2021–2035 (USD Billion) |
  82. FIGURE 13 Middle East & Africa IoT Professional Services Market Size Trend, 2021–2035 (USD Billion) |
  83. FIGURE 14 Competitive Landscape — Market Share Distribution, 2025

Segmentation Quick Reference

DimensionSub-SegmentsDominant SegmentFastest Growing Segment
By Service TypeSystem Integration & Deployment, Managed Services, Consulting & Advisory, Support & MaintenanceSystem Integration & DeploymentManaged Services
By End-User VerticalManufacturing, Healthcare, Energy & Utilities, Retail & Logistics, BFSI, OthersManufacturingHealthcare
By Organization SizeLarge Enterprises, Small & Medium EnterprisesLarge EnterprisesSmall & Medium Enterprises
By RegionNorth America, Europe, Asia-Pacific, South America, Middle East & AfricaNorth AmericaAsia-Pacific


Market Segmentation Overview

By Service Type

Sub-SegmentKey Trend
System Integration & DeploymentMulti-cloud and hybrid-edge architectures are driving integration complexity and multi-year engagement cycles.
Managed ServicesOutcome-based pricing models replacing traditional time-and-materials contracts
Consulting & AdvisoryGrowing demand for a vendor-neutral IoT strategy and cybersecurity posture assessment
Support & MaintenancePredictive support leveraging AI-driven diagnostics, reducing mean-time-to-resolution


System integration remains the revenue backbone of the IoT professional services landscape as enterprise deployments increasingly span multiple cloud providers, edge nodes, and legacy OT systems. Managed services are gaining share rapidly as organizations prioritize operational efficiency and predictable cost structures over in-house IoT infrastructure management.

By End-User Vertical

Sub-SegmentKey Trend
ManufacturingDigital-twin and predictive-maintenance deployments expanding from pilot to plant-wide scale
HealthcareConnected medical devices and remote patient monitoring are driving compliance-intensive services demand.
Energy & UtilitiesSmart-grid modernization and real-time emissions monitoring are accelerating services adoption.
Retail & LogisticsInventory automation and last-mile visibility solutions requiring full-stack integration
BFSIBranch digitization and ATM fleet management are creating niche IoT services opportunities.
Others (Government, Agriculture, Telecom)Smart-city programs and precision-agriculture platforms are generating sustained public-sector demand.


Manufacturing and healthcare together represent over 40% of global services spending, reflecting the capital-intensive and compliance-heavy nature of IoT deployments in these verticals. Energy and utilities are emerging as a high-growth vertical driven by regulatory mandates for grid modernization and sustainability reporting.

By Organization Size

Sub-SegmentKey Trend
Large EnterprisesMulti-site, multi-region deployments requiring global delivery capabilities and dedicated IoT CoEs
Small & Medium EnterprisesCloud-native platforms and packaged service offerings are lowering adoption barriers.


Large enterprises continue to account for the majority of services revenue. Still, SME adoption is accelerating as providers introduce standardized, lower-cost engagement models designed for organizations deploying IoT across single-site or limited-scope environments.


Download PDF ×

We do not share your information with anyone. However, we may send you emails based on your report interest from time to time. You may contact us at any time to opt-out.