Italy Italy Lithium Ion Battery Market Segmentation
Italy Lithium Ion Battery Market By Type (USD Million, 2025-2035)
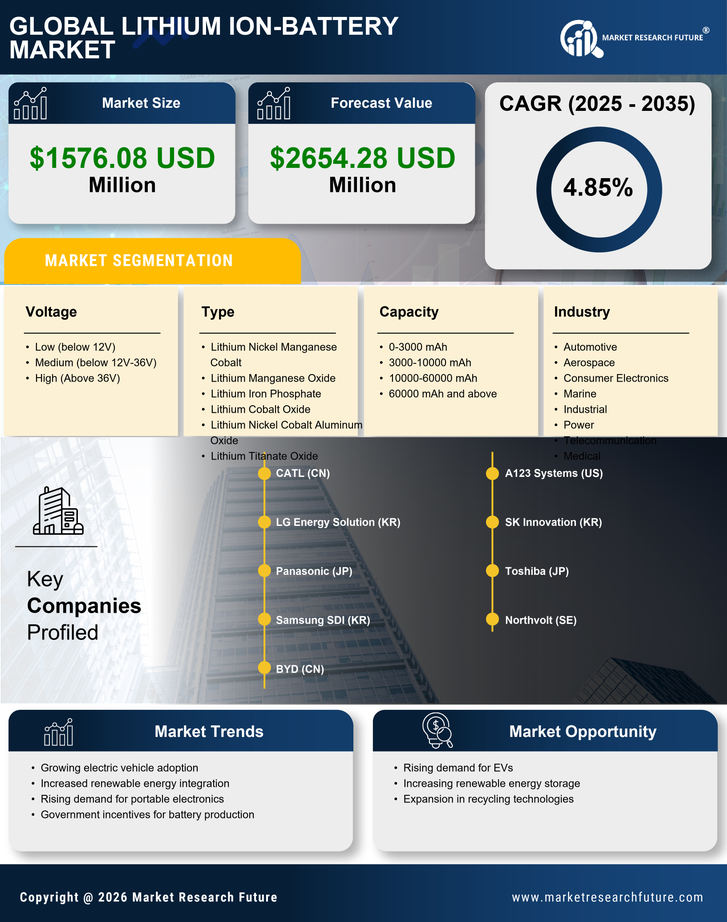
- Lithium Nickel Manganese Cobalt
- Lithium Manganese Oxide
- Lithium Iron Phosphate
- Lithium Cobalt Oxide
- Lithium Nickel Cobalt Aluminum Oxide
- Lithium Titanate Oxide
Italy Lithium Ion Battery Market By Capacity (USD Million, 2025-2035)
- 0-3000 mAh
- 3000-10000 mAh
- 10000-60000 mAh
- 60000 mAh and above
Italy Lithium Ion Battery Market By Voltage (USD Million, 2025-2035)
- Low (below 12V)
- Medium (below 12V-36V)
- High (Above 36V)
Italy Lithium Ion Battery Market By Industry (USD Million, 2025-2035)
- Automotive
- Aerospace
- Consumer Electronics
- Marine
- Industrial
- Power
- Telecommunication
- Medical