Japan Mobility Demand Market Segmentation
Japan Mobility Demand Market By Vehicle Type (USD Million, 2025-2035)
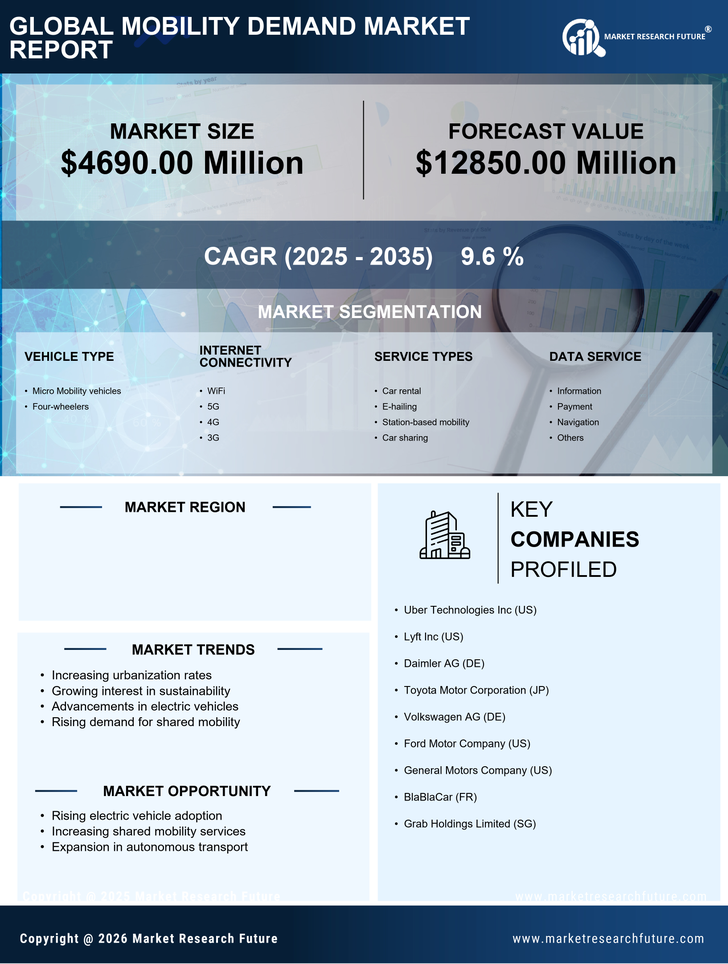
- Micro Mobility vehicles
- Four-wheelers
Japan Mobility Demand Market By Internet Connectivity (USD Million, 2025-2035)
- WiFi
- 5G
- 4G
- 3G
Japan Mobility Demand Market By Japan Mobility Demand Market Types (USD Million, 2025-2035)
- Car rental
- E-hailing
- Station-based mobility
- Car sharing
Japan Mobility Demand Market By Data Japan Mobility Demand Market (USD Million, 2025-2035)
- Information
- Payment
- Navigation
- Others