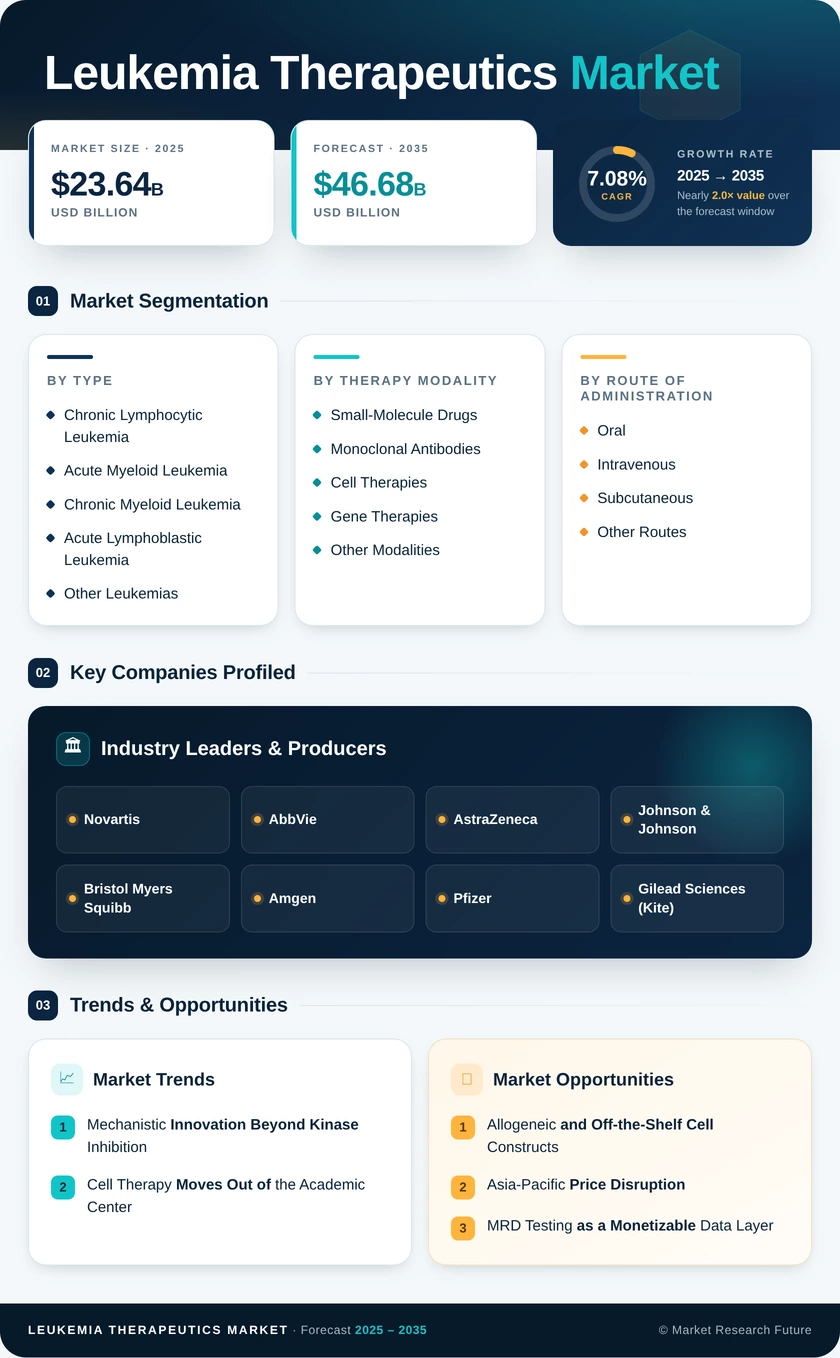
Leukemia Therapeutics Market (2025 - 2035)

Leukemia Therapeutics Market Research Report: Size, Share, Trend Analysis By Drug Type (Chemotherapy, Targeted Therapy, Immunotherapy, Stem Cell Transplant, Radiation Therapy), By Therapy Type (Monotherapy, Combination Therapy, Maintenance Therapy), By Administration Route (Oral, Intravenous, Subcutaneous), By Patient Type (Adult, Pediatric) and By Regional (North America, Europe, South America, Asia Pacific, Middle East and Africa) - Growth Outlook & Industry Forecast 2025 To 2035

Forecast Period
2025-2035
CAGR
7.08%
2025 Market Size
USD 23.64 Billion
2035 Market Size
USD 46.68 Billion
Healthcare ● Updated August 2026 Report ID: MRFR/HC/5956-HCR | Pages: 110 | Author: Vikita Thakur, Rahul Gotadki
  1. 1 Market Overview |
    1. 1.1 Study Assumptions & Market Definition |
    2. 1.2 Scope of the Study |
    3. 1.3 Research Methodology
  2. 2 Market Summary & Key Report Takeaways |
    1. 2.1 By Treatment Type |
    2. 2.2 By Disease and Modality |
    3. 2.3 By Geography
  3. 3 Global Market Size & Forecast (2021–2035) |
    1. 3.1 Historical Market Size (2021–2025) |
    2. 3.2 Current & Forecast Market Size (2026–2035) |
    3. 3.3 Market Size by Revenue (USD Billion) |
    4. 3.4 Year-over-Year Growth Analysis
  4. 4 Market Drivers Analysis |
    1. 4.1 Mechanistic Innovation Beyond Kinase Inhibition |
    2. 4.2 Cell Therapy Moves Out of the Academic Center |
    3. 4.3 Fixed-Duration Regimens Reset CLL Economics |
    4. 4.4 Driver Impact Weighting Matrix
  5. 5 Market Restraints Analysis |
    1. 5.1 Reimbursement Scrutiny Tightens |
    2. 5.2 Manufacturing Remains the Bottleneck |
    3. 5.3 Patent Cliffs Approach |
    4. 5.4 Restraint Impact Weighting Matrix
  6. 6 Market Opportunity Analysis |
    1. 6.1 Allogeneic and Off-the-Shelf Cell Constructs |
    2. 6.2 Asia-Pacific Price Disruption |
    3. 6.3 MRD Testing as a Monetizable Data Layer |
    4. 6.4 Pediatric and Adolescent Protocol Expansion |
    5. 6.5 Community Oncology Delivery Models
  7. 7 Regional Market Share & Country-Level Analysis |
    1. 7.1 North America | |
      1. 7.1.1 US | |
      2. 7.1.2 Canada | |
      3. 7.1.3 Mexico |
    2. 7.2 Europe | |
      1. 7.2.1 Germany | |
      2. 7.2.2 UK | |
      3. 7.2.3 France | |
      4. 7.2.4 Italy | |
      5. 7.2.5 Spain | |
      6. 7.2.6 Nordic Countries | |
      7. 7.2.7 Russia | |
      8. 7.2.8 Rest of Europe |
    3. 7.3 Asia-Pacific | |
      1. 7.3.1 China | |
      2. 7.3.2 India | |
      3. 7.3.3 Japan | |
      4. 7.3.4 South Korea | |
      5. 7.3.5 ASEAN | |
      6. 7.3.6 Rest of Asia-Pacific |
    4. 7.4 South America | |
      1. 7.4.1 Brazil | |
      2. 7.4.2 Argentina | |
      3. 7.4.3 Rest of South America |
    5. 7.5 Middle East & Africa | |
      1. 7.5.1 Saudi Arabia | |
      2. 7.5.2 UAE | |
      3. 7.5.3 South Africa | |
      4. 7.5.4 Egypt | |
      5. 7.5.5 Rest of Middle East & Africa
  8. 8 Future Outlook (2026–2035) |
    1. 8.1 Computational Target Discovery Compresses Timelines |
    2. 8.2 Platform Economics Replace Product Economics |
    3. 8.3 Measurable Residual Disease Becomes the Regulatory Endpoint |
    4. 8.4 Access Divergence Widens Then Narrows
  9. 9 Market Segmentation Analysis |
    1. 9.1 By Treatment Type | |
      1. 9.1.1 Chemotherapy | |
      2. 9.1.2 Targeted Therapy | |
      3. 9.1.3 Immunotherapy | |
      4. 9.1.4 CAR-T Cell Therapy | |
      5. 9.1.5 Stem Cell Transplantation & Supportive Care |
    2. 9.2 By Leukemia Type | |
      1. 9.2.1 Acute Lymphocytic Leukemia | |
      2. 9.2.2 Acute Myeloid Leukemia | |
      3. 9.2.3 Chronic Lymphocytic Leukemia | |
      4. 9.2.4 Chronic Myeloid Leukemia | |
      5. 9.2.5 Other Leukemias |
    3. 9.3 By Therapy Modality | |
      1. 9.3.1 Small-Molecule Drugs | |
      2. 9.3.2 Monoclonal Antibodies | |
      3. 9.3.3 Cell Therapies | |
      4. 9.3.4 Gene Therapies | |
      5. 9.3.5 Other Modalities |
    4. 9.4 By Route of Administration | |
      1. 9.4.1 Oral | |
      2. 9.4.2 Intravenous | |
      3. 9.4.3 Subcutaneous | |
      4. 9.4.4 Other Routes |
    5. 9.5 By Age Group | |
      1. 9.5.1 Pediatric | |
      2. 9.5.2 Adults | |
      3. 9.5.3 Geriatric
  10. 10 Competitive Landscape |
    1. 10.1 Market Concentration Analysis (2026) |
    2. 10.2 Competitive Benchmarking Matrix |
    3. 10.3 Company Profiles | |
      1. 10.3.1 Novartis | |
      2. 10.3.2 AbbVie | |
      3. 10.3.3 AstraZeneca | |
      4. 10.3.4 Johnson & Johnson | |
      5. 10.3.5 Bristol Myers Squibb | |
      6. 10.3.6 Amgen | |
      7. 10.3.7 Pfizer | |
      8. 10.3.8 Gilead Sciences (Kite Pharma) | |
      9. 10.3.9 Takeda | |
      10. 10.3.10 Eli Lilly | |
      11. 10.3.11 Daiichi Sankyo | |
      12. 10.3.12 Servier
  11. 11 Recent Developments & News (2023–2025)
  12. 12 Report Scope & Methodology |
    1. 12.1 Study Period & Base Year |
    2. 12.2 Data Sources & Citations |
    3. 12.3 Abbreviations
  13. 13 Detailed Sources & Citations
  14. 14 Frequently Asked Questions
  15. 15 LIST OF TABLES |
  16. TABLE 1 Global Leukemia Therapeutics Market Size & Forecast, by Revenue (USD Billion), 2021–2035 |
  17. TABLE 2 Global Leukemia Therapeutics Market – Year-over-Year Growth Analysis, 2021–2035 |
  18. TABLE 3 Driver Impact Weighting Matrix, 2026–2035 |
  19. TABLE 4 Restraint Impact Weighting Matrix, 2026–2035 |
  20. TABLE 5 Global Market Size, by Region, 2021–2035 (USD Billion) |
  21. TABLE 6 North America Market Size, by Country, 2021–2035 (USD Billion) |
  22. TABLE 7 Europe Market Size, by Country, 2021–2035 (USD Billion) |
  23. TABLE 8 Asia-Pacific Market Size, by Country, 2021–2035 (USD Billion) |
  24. TABLE 9 South America Market Size, by Country, 2021–2035 (USD Billion) |
  25. TABLE 10 Middle East & Africa Market Size, by Country, 2021–2035 (USD Billion) |
  26. TABLE 11 Global Market Size, by Treatment Type, 2021–2035 (USD Billion) |
  27. TABLE 12 Global Market Size, by Leukemia Type, 2021–2035 (USD Billion) |
  28. TABLE 13 Global Market Size, by Therapy Modality, 2021–2035 (USD Billion) |
  29. TABLE 14 Global Market Size, by Route of Administration, 2021–2035 (USD Billion) |
  30. TABLE 15 Global Market Size, by Age Group, 2021–2035 (USD Billion) |
  31. TABLE 16 North America Market Size, by Treatment Type, 2021–2035 (USD Billion) |
  32. TABLE 17 North America Market Size, by Leukemia Type, 2021–2035 (USD Billion) |
  33. TABLE 18 Europe Market Size, by Treatment Type, 2021–2035 (USD Billion) |
  34. TABLE 19 Europe Market Size, by Leukemia Type, 2021–2035 (USD Billion) |
  35. TABLE 20 Asia-Pacific Market Size, by Treatment Type, 2021–2035 (USD Billion) |
  36. TABLE 21 Asia-Pacific Market Size, by Leukemia Type, 2021–2035 (USD Billion) |
  37. TABLE 22 South America Market Size, by Treatment Type, 2021–2035 (USD Billion) |
  38. TABLE 23 Middle East & Africa Market Size, by Treatment Type, 2021–2035 (USD Billion) |
  39. TABLE 24 United States Market Size, by Therapy Modality, 2021–2035 (USD Billion) |
  40. TABLE 25 China Market Size, by Therapy Modality, 2021–2035 (USD Billion) |
  41. TABLE 26 Competitive Benchmarking Matrix, 2026 |
  42. TABLE 27 Company Profiles – Key Players |
  43. TABLE 28 Recent Developments & Strategic Announcements, 2023–2025 |
  44. TABLE 29 Report Scope & Methodology Summary |
  45. TABLE 30 Detailed Sources & Citations Index
  46. 16 LIST OF FIGURES |
  47. FIGURE 1 Market Dynamics – Drivers, Restraints and Opportunities Snapshot |
  48. FIGURE 2 Industry Value Chain Analysis – Discovery to Patient Administration |
  49. FIGURE 3 Porter's Five Forces Analysis |
  50. FIGURE 4 Global Market Size Trend, 2021–2035 (USD Billion) |
  51. FIGURE 5 Year-over-Year Growth Trajectory, 2022–2035 (%) |
  52. FIGURE 6 Market Share by Treatment Type, 2025 vs 2035 (%) |
  53. FIGURE 7 Market Share by Leukemia Type, 2025 (%) |
  54. FIGURE 8 Market Share by Therapy Modality, 2025 (%) |
  55. FIGURE 9 Market Share by Route of Administration, 2025 (%) |
  56. FIGURE 10 Market Share by Age Group, 2025 (%) |
  57. FIGURE 11 Regional Market Share Distribution, 2025 (%) |
  58. FIGURE 12 Regional CAGR Comparison, 2026–2035 (%) |
  59. FIGURE 13 North America Country-Level Share, 2025 (%) |
  60. FIGURE 14 Europe Country-Level Share, 2025 (%) |
  61. FIGURE 15 Asia-Pacific Country-Level Share, 2025 (%) |
  62. FIGURE 16 Competitive Landscape – Estimated Revenue Share Bands, 2026 |
  63. FIGURE 17 Pipeline Density by Mechanism Class, 2026 |
  64. FIGURE 18 Cell Therapy Manufacturing Capacity vs Demand Outlook, 2026–2035
Share::
Request Free Sample

Segmentation Quick Reference

DimensionSub-SegmentsDominant SegmentFastest Growing Segment
By Treatment TypeChemotherapy; Targeted Therapy; Immunotherapy; CAR-T Cell Therapy; Stem Cell Transplantation & Supportive CareTargeted TherapyCAR-T Cell Therapy
By Leukemia TypeAcute Lymphocytic Leukemia; Acute Myeloid Leukemia; Chronic Lymphocytic Leukemia; Chronic Myeloid Leukemia; Other LeukemiasChronic Lymphocytic LeukemiaAcute Lymphocytic Leukemia
By Therapy ModalitySmall-Molecule Drugs; Monoclonal Antibodies; Cell Therapies; Gene Therapies; Other ModalitiesSmall-Molecule DrugsGene Therapies
By Route of AdministrationOral; Intravenous; Subcutaneous; Other RoutesOralIntravenous
By Age GroupPediatric; Adults; GeriatricAdultsPediatric
By GeographyNorth America; Europe; Asia-Pacific; South America; Middle East & AfricaNorth AmericaAsia-Pacific


Market Segmentation Overview

By Treatment Type

Sub-SegmentKey Trend
ChemotherapyRetains induction and pediatric protocol volume while value share erodes to generics
Targeted TherapyGenotype-directed prescribing at diagnosis routes patients straight to mechanism-matched agents
ImmunotherapyBispecific T-cell engagers migrating from salvage into consolidation settings
CAR-T Cell TherapyOutpatient administration and shorter vein-to-vein cycles unlock volume growth
Stem Cell Transplantation & Supportive CareReduced-intensity conditioning extends eligibility to older patients


Treatment-type mix is shifting toward mechanism-matched intervention, yet cytotoxic backbones are not disappearing. They are being repositioned as bridging and consolidation tools around newer agents rather than as standalone curative attempts.

By Leukemia Type

Sub-SegmentKey Trend
Acute Lymphocytic LeukemiaBlinatumomab consolidation and CD19 CAR-T reshape relapsed pediatric and adult care
Acute Myeloid LeukemiaMenin and IDH inhibitors create genotype-defined revenue layers
Chronic Lymphocytic LeukemiaFixed-duration BTK-plus-BCL2 combinations displace continuous dosing
Chronic Myeloid LeukemiaGeneric TKI pricing dominates volume; treatment-free remission is the clinical frontier
Other LeukemiasOrphan designations sustain development in hairy cell and rare subtypes


Disease-level value concentrates where relapse is frequent, and each successive line carries premium pricing. Chronic disease segments generate steady annuity revenue; acute segments generate episodic but higher-value demand.

By Therapy Modality

Sub-SegmentKey Trend
Small-Molecule DrugsOral convenience sustains share despite exclusivity expiries
Monoclonal AntibodiesCD20 and CD22 targeting broadens into earlier treatment lines
Cell TherapiesManufacturing slot availability, not clinical demand, sets the growth ceiling
Gene TherapiesEx vivo engineering matures while in vivo delivery enters early clinical testing
Other ModalitiesAntibody-drug conjugates expand payload diversity


Modality choice increasingly reflects payer tolerance as much as clinical evidence. Products that can be administered outside tertiary centers convert eligible patients into treated patients at materially higher rates.

By Route of Administration

Sub-SegmentKey Trend
OralHome administration supports adherence-linked persistence in chronic-phase disease
IntravenousInfusion capacity becomes a genuine commercial constraint as cell and bispecific volumes rise
SubcutaneousReformulation reduces chair time and shifts delivery to nurse-led clinics
Other RoutesIntrathecal delivery retains its role in CNS prophylaxis


Route economics quietly determine market access. Subcutaneous reformulation of infused biologics has become a standard lifecycle strategy precisely because it moves treatment out of scarce infusion capacity.

By Age Group

Sub-SegmentKey Trend
PediatricProtocol optimization and label extensions drive the fastest growth of any age cohort
AdultsLargest treated pool across chronic and acute presentations
GeriatricReduced-intensity and oral-first regimens serve transplant-ineligible populations


Age stratification increasingly drives regimen design rather than merely dose adjustment. Geriatric-specific evidence generation has become a differentiator in payer submissions across every major market.

By Geography

Sub-SegmentKey Trend
North AmericaAccreditation density and distinct reimbursement codes sustain premium adoption
EuropeHealth technology assessment gates access more than regulatory approval does
Asia-PacificDomestic manufacturing resets global price expectations for cell therapy
South AmericaPublic tender procurement favors high-volume generic supply
Middle East & AfricaSovereign health funds accelerate tertiary oncology capacity buildout


Geographic performance tracks payment architecture rather than disease burden. The decade's most consequential shift will be Asia-Pacific manufacturing economics filtering into pricing negotiations everywhere else.




Share::
Request Free Sample
Download PDF ×

We do not share your information with anyone. However, we may send you emails based on your report interest from time to time. You may contact us at any time to opt-out.