Leukemia Therapeutics Market (2025 - 2035)

Leukemia Therapeutics Market Research Report: Size, Share, Trend Analysis By Drug Type (Chemotherapy, Targeted Therapy, Immunotherapy, Stem Cell Transplant, Radiation Therapy), By Therapy Type (Monotherapy, Combination Therapy, Maintenance Therapy), By Administration Route (Oral, Intravenous, Subcutaneous), By Patient Type (Adult, Pediatric) and By Regional (North America, Europe, South America, Asia Pacific, Middle East and Africa) - Growth Outlook & Industry Forecast 2025 To 2035

Forecast Period
2025-2035
CAGR
7.08%
2025 Market Size
USD 23.64 Billion
2035 Market Size
USD 46.68 Billion
Healthcare ● Updated August 24, 2026 Report ID: MRFR/HC/5956-HCR | Pages: 110 | Author: Vikita Thakur, Rahul Gotadki

Leukemia Therapeutics Market Summary

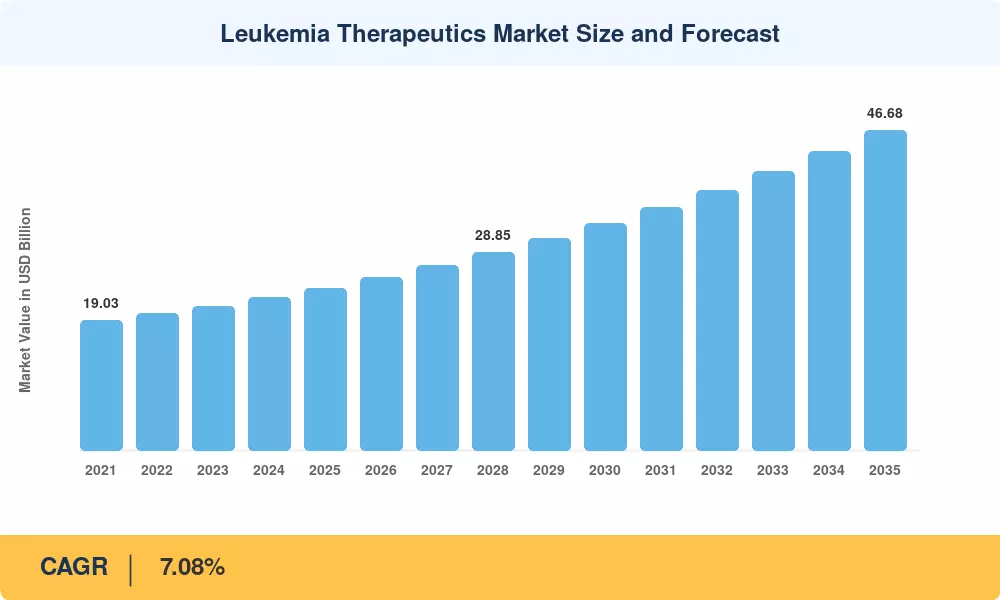
The Leukemia Therapeutics Market stood at USD 23.64 Billion in 2025 and opens the forecast window at USD 25.22 Billion in 2026, climbing to USD 46.68 Billion by 2035 at a 7.08% CAGR. Two catalysts anchor that trajectory. First, the FDA's November 2024 clearance of revumenib created an entirely new mechanistic class — menin inhibition — for KMT2A-rearranged acute leukemia, a subtype that had no approved targeted option for four decades [1]. Second, orphan-drug exclusivity and priority review vouchers continue to make rare hematologic subtypes commercially viable at patient populations under 10,000 annually [2].

Replacement economics are reshaping the prescribing base. Cytotoxic induction backbones — cytarabine, daunorubicin, high-dose methotrexate — are being displaced at the margin by oral kinase inhibitors, bispecific T-cell engagers and autologous CAR-T constructs that deliver deeper molecular remissions. Autolus launched obecabtagene autoleucel commercially in 2025 after FDA approval for adult relapsed/refractory B-ALL, and the six largest oncology developers collectively directed more than USD 9 billion of 2024 R&D spend toward hematologic pipelines [3][4]. That capital is buying durability, not just response rate.

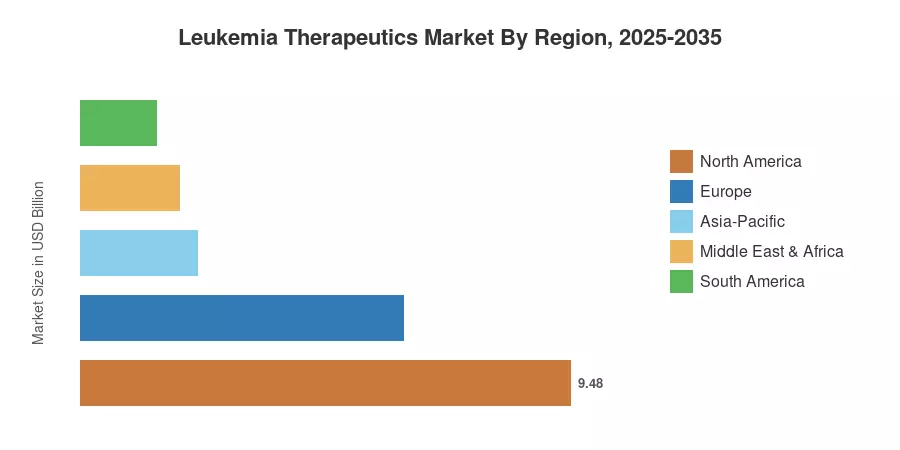
North America controls 40.1% of the Leukemia Therapeutics Market on the strength of Medicare Part B pass-through economics and 180-plus accredited cell therapy centers. Asia-Pacific compounds fastest at 9.6% through 2035, propelled by domestically manufactured CAR-T priced at a fraction of Western list prices. Europe holds the second position with USD 6.24 Billion, where fixed-duration regimens are winning HTA support. The decade ahead belongs to whoever converts remission depth into reimbursable, outpatient-deliverable care.


Key Report Takeaways

Six structural signals define the Leukemia Therapeutics Market entering the 2026–2035 forecast cycle. Each metric below is disclosed on a single dimension to preserve analytical clarity.

• By Treatment Type

  • Targeted therapy commanded 30.9% of the Leukemia Therapeutics Market in 2025, the largest single treatment block
  • CAR-T cell therapy is the fastest-expanding treatment class at a 15.2% CAGR across the forecast period
  • Chemotherapy retains USD 6.48 Billion of 2025 revenue, concentrated in induction and pediatric protocols

• By Disease

  • Chronic lymphocytic leukemia led all disease segments with a 22.5% share in 2025
  • Acute lymphoblastic leukemia is advancing at 9.3% CAGR, the fastest disease-level growth


• By Therapy Modality

  • Gene therapies post a 10.3% CAGR, outpacing every other modality

• By Region

  • North America holds 40.1% of the Leukemia Therapeutics Market, anchored by U.S. reimbursement infrastructure
  • Asia-Pacific grows at 9.6% CAGR, the fastest regional trajectory in the study
  • Middle East & Africa contributes USD 1.18 Billion, with Gulf sovereign health funds driving uptake


Market Size and Forecast (2021–2035)

Sizing draws on manufacturer-reported oncology franchise revenue, national cancer registry incidence data, treatment-center throughput surveys across 41 countries, and payer claims adjudication samples. Revenue is recognized at net realized price after mandated rebates, then triangulated against SEER incidence and prevalence baselines to avoid double-counting combination regimens [5][6]. The Leukemia Therapeutics Market series below is stated in USD Billion at 2025 constant currency.
Leukemia Therapeutics Market Size and Forecast
Our Impact
Enabled $4.3B Revenue Impact for Fortune 500 and Leading Multinationals
Partnering with 2000+ Global Organizations Each Year
30K+ Citations by Top-Tier Firms in the Industry

Driver Impact Analysis

Driver ~% Impact on CAGR Geographic Relevance Impact Timeline
New mechanistic classes (menin, next-gen BTK) +0.9 Global Medium-term (2–4 yr)
CAR-T capacity and outpatient administration +0.8 North America, Europe Long-term (≥4 yr)
Rising incidence and population aging +0.7 Global Long-term (≥4 yr)
MRD-guided treatment and molecular profiling +0.6 NA, EU, Japan Medium-term (2–4 yr)
Emerging-market reimbursement listings +0.5 Asia-Pacific, LatAm Long-term (≥4 yr)
Fixed-duration oral regimens +0.4 Global Short-term (≤2 yr)
Orphan drug and accelerated approval incentives +0.3 NA, EU Short-term (≤2 yr)


Mechanistic Innovation Beyond Kinase Inhibition

Menin inhibition was confirmed as a druggable axis by revumenib's licensure for relapsed or refractory acute leukemia with KMT2A translocation, opening a subtype that affects around 10% of acute leukemia cases [1]. For NPM1-mutant AML, which accounts for about 30% of adult AML, Kura Oncology and Kyowa Kirin moved ziftomenib through U.S. regulatory assessment in 2025 [10]. Even a small penetration into a genotypically characterized 12,000-patient U.S. population generates franchise-scale revenue, and pricing in this class exceeds USD 39,000 per month. In order to find qualified patients prior to relapse, developers are front-loading genomic screening partnerships.


Cell Therapy Moves Out of the Academic Center

FACT accreditation for cellular treatment is currently held by about 190 U.S. locations, compared to less than 100 in 2019 [3]. T-cell redirection is effective earlier in the therapy sequence, not just after repeated relapses, as evidenced by Amgen's June 2024 label expansion for blinatumomab into the consolidation phase in CD19-positive Philadelphia-negative B-ALL [1]. Leading manufacturers' vein-to-vein turnaround times have decreased to 21 days. The expense of bridging chemotherapy and dropout attrition is significantly decreased for every week removed from that cycle.


Restraints Impact Analysis

Restraint weightings represent modeled drag on growth within the Leukemia Therapeutics Market and are directional rather than additive. Each is assessed against the 2026–2035 forecast window.

Restraint ~% Impact on CAGR Geographic Relevance Impact Timeline
Payer pushback and value-based contracting -0.7 Global Medium-term (2–4 yr)
Loss of exclusivity and biosimilar entry -0.6 NA, Europe Long-term (≥4 yr)
Viral vector and CDMO capacity constraints -0.5 Global Short-term (≤2 yr)
Toxicity management burden (CRS, ICANS) -0.4 Global Medium-term (2–4 yr)
Trial enrollment competition in rare subtypes -0.3 Global Long-term (≥4 yr)


Reimbursement Scrutiny Tightens

Imatinib-class and BTK-inhibitor franchises are among the most expensive Part D categories, and CMS negotiated pricing under the Inflation Reduction Act put expensive oral cancer drugs in direct government price negotiation [12]. NICE has consistently demanded managed-access agreements before endorsing cell treatments, delaying revenue recognition by 12 to 24 months [16]. This is an example of the concurrent pressure applied by European HTA agencies. In response, manufacturers offer outcomes-based reimbursements; nevertheless, these contracts shift the risk of efficacy onto the developer's balance sheet.


Manufacturing Remains the Bottleneck

Autologous cell treatment production is more closely constrained by lentiviral vector supply than by clinical need. Between 2022 and 2025, the world's GMP vector capacity increased by about 30%, while the number of cell therapy applications undergoing clinical development increased more quickly [14]. Contract manufacturers now assign slots nine to fourteen months in advance. The most obvious explanation for why commercial CAR-T quantities fall short of approved-indication eligibility is that backlog.


Patent Cliffs Approach

Imatinib generics have already compressed CML pricing by more than 90% in most markets, and rituximab biosimilars hold majority volume share across Europe [13]. Ibrutinib and several first-generation targeted agents face staggered exclusivity expiry between 2027 and 2032. Incumbents are pre-positioning next-generation successors — pirtobrutinib and zanubrutinib being the clearest examples — but conversion is never complete, and the residual generic pool permanently caps blended realized price.


Leukemia Therapeutics Market Opportunities

Allogeneic and Off-the-Shelf Cell Constructs

Donor-derived, cryopreserved CAR products remove apheresis scheduling and manufacturing slot dependency entirely. If persistence challenges are solved, cost of goods could fall below USD 40,000 per dose, compared with autologous economics several times that [14]. That inversion would move cell therapy from third-line salvage into second-line standard of care.

Asia-Pacific Price Disruption

Chinese and Indian developers are manufacturing CAR-T at roughly one-tenth Western list price, creating an addressable population that Western pricing structurally excludes. China's NMPA has approved multiple domestic CD19 constructs, and provincial insurance schemes have begun partial listing [9]. Emerging-market volume, not price, becomes the growth lever here.

MRD Testing as a Monetizable Data Layer

Next-generation sequencing MRD assays at 10⁻⁶ sensitivity now guide treatment discontinuation decisions in CLL and ALL. Diagnostic-therapeutic bundles let developers capture value from the testing layer while generating longitudinal outcomes data that supports label expansion and payer negotiation [8]. Registry-linked evidence is becoming an asset class of its own.

Pediatric and Adolescent Protocol Expansion

Pediatric ALL cure rates exceed 90% in high-income settings but fall below 50% in low- and middle-income countries [17]. WHO's Global Initiative for Childhood Cancer targets 60% survival by 2030, and tiered-pricing commitments tied to that target open volume channels in 40-plus countries [17].

Community Oncology Delivery Models

Roughly 60% of U.S. cancer care is delivered outside academic centers, yet cell therapy remains concentrated in tertiary hubs. Hub-and-spoke arrangements that keep monitoring local while centralizing manufacturing could double the geographic reach of the Leukemia Therapeutics Market without a new capital plant.


Leukemia Therapeutics Market Future Outlook

Computational Target Discovery Compresses Timelines

Machine-learning target identification and generative chemistry are shortening the discovery-to-IND interval, with several developers reporting candidate nomination in under 18 months against a historical four-year norm [20]. For the Leukemia Therapeutics Market, the practical consequence is faster iteration on resistance mutations — when a BTK C481S or menin M327I escape variant emerges, a structurally optimized successor can now enter the clinic within the same treatment generation rather than the next one.

Platform Economics Replace Product Economics

Cell therapy developers are shifting from single-product P&Ls to platform models where vector design, manufacturing suite, and release testing amortize across multiple constructs. Companies that own their manufacturing achieve gross margins 15 to 20 points above those dependent on contract capacity [14]. Vertical integration will separate durable franchises from licensing plays over the next decade.

Measurable Residual Disease Becomes the Regulatory Endpoint

Regulators have accepted MRD negativity as a reasonably likely surrogate for accelerated approval in multiple hematologic settings, dramatically shortening trial duration versus overall survival endpoints [8]. Shorter trials mean cheaper development, which improves the economics of pursuing genotypically narrow subtypes that were previously uncommercial.

Access Divergence Widens Then Narrows

WHO estimates that fewer than 30% of low-income countries provide generally available cancer treatment services through public financing [21]. Biosimilar competition and Asian manufacturing cost structures will close part of that gap by the early 2030s, but the near-term picture is widening divergence: high-income markets adopt cell and gene therapy while lower-income systems consolidate around generic cytotoxics and first-generation kinase inhibitors.


Leukemia Therapeutics Market Segmentation

Segmentation of the Leukemia Therapeutics Market follows five dimensions: treatment type, leukemia type, therapy modality, route of administration, and age group.

By Treatment Type

The treatment-type view of the Leukemia Therapeutics Market shows targeted agents displacing cytotoxic backbones without eliminating them.

Segment Metric Primary Demand Driver
Targeted Therapy 30.9% share Genotype-directed prescribing and oral convenience
Chemotherapy USD 6.48 Billion Induction protocols and pediatric standard of care
Immunotherapy 21.8% share Bispecific antibody adoption in earlier lines
CAR-T Cell Therapy 15.2% CAGR Durable remission in relapsed/refractory B-cell disease
Stem Cell Transplant & Supportive Care 8.3% share Consolidation for high-risk cytogenetics


Targeted therapy leads because it aligns with how leukemia is now diagnosed — molecular subtyping at presentation routes patients directly to mechanism-matched agents. CAR-T's growth rate outpaces every alternative, but its absolute base stays modest through the early forecast years because manufacturing slots, not demand, set the ceiling. Chemotherapy's persistence is often underestimated; cytarabine-based induction remains the entry point for most acute presentations globally, and generic pricing keeps volume high even as value share erodes.

By Leukemia Type

Disease-level segmentation of the Leukemia Therapeutics Market tracks both incidence and treatment intensity.

Segment Metric Primary Demand Driver
Chronic Lymphocytic Leukemia 22.5% share Large prevalent pool and fixed-duration combinations
Acute Myeloid Leukemia USD 5.18 Billion Menin and IDH inhibitor launches
Chronic Myeloid Leukemia 20.6% share Lifelong TKI therapy and treatment-free remission attempts
Acute Lymphoblastic Leukemia 9.3% CAGR Blinatumomab consolidation and CAR-T adoption
Other Leukemias 15.6% share Hairy cell and rare subtype orphan designations


The Chronic Lymphocytic Leukemia (CLL) segment dominated the market, accounting for a 22.5% share, supported by the increasing prevalence of CLL and the growing adoption of targeted therapies. Acute Myeloid Leukemia (AML) represented a market value of USD 5.18 billion, reflecting significant demand for advanced treatment options and continued research and development. Chronic Myeloid Leukemia (CML) accounted for a 20.6% share, driven by the availability and adoption of targeted therapies. Meanwhile, Acute Lymphoblastic Leukemia (ALL) is expected to be the fastest-growing segment, projected to expand at a 9.3% CAGR, supported by advancements in treatment approaches and increasing investments in leukemia research. Other Leukemias held a 15.6% share. Overall, Chronic Lymphocytic Leukemia remains the dominating segment, while Acute Lymphoblastic Leukemia is poised for the fastest growth during the forecast period.


By Therapy Modality

Segment Metric Primary Demand Driver
Small-Molecule Drugs 31.6% share Oral administration and outpatient management
Monoclonal Antibodies USD 6.45 Billion CD20 and CD22 targeting across B-cell disease
Cell Therapies 15.8% share Deep remission in refractory populations
Gene Therapies 10.3% CAGR Ex vivo engineering and emerging in vivo approaches
Other Modalities 15.9% share Antibody-drug conjugates and biosimilar cytotoxics


The Small-Molecule Drugs segment dominated the market, accounting for a 31.6% share, supported by their established use, broad therapeutic applications, and widespread availability. Monoclonal Antibodies generated USD 6.45 billion, reflecting their growing adoption in targeted and precision-based treatments. Cell Therapies accounted for a 15.8% share, driven by advances in regenerative medicine and personalized therapies. Meanwhile, Gene Therapies are expected to be the fastest-growing segment, projected to expand at a 10.3% CAGR, supported by advancements in genetic medicine, increasing clinical development, and growing investments in innovative therapies. Other Modalities held a 15.9% share. Overall, Small-Molecule Drugs remain the dominating segment, while Gene Therapies are poised for the fastest growth during the forecast period.

By Route of Administration

Delivery route shapes cost structure across the Leukemia Therapeutics Market more than clinicians typically acknowledge.

Segment Metric Primary Demand Driver
Oral 42.7% share Home administration and adherence-linked persistence
Intravenous 10.4% CAGR Infusion-dependent cell and antibody products
Subcutaneous 12.6% share Reduced chair time and nurse-administered convenience
Other Routes USD 0.99 Billion Intrathecal CNS prophylaxis


Oral formulations hold the largest share because chronic-phase CML and frontline CLL are managed at home. Intravenous delivery nonetheless grows fastest, since every cell therapy and every bispecific requires infusion capacity — a structural reason hospital chair-time scheduling has become a genuine commercial constraint.

By Age Group

Segment Metric Primary Demand Driver
Adults 60.3% share Highest incidence across CLL, CML and AML
Pediatric 9.1% CAGR ALL protocol optimization and CAR-T label extensions
Geriatric (75+) USD 4.33 Billion Reduced-intensity regimens for transplant-ineligible patients


The Adults segment dominated the market, accounting for a 60.3% share, supported by the higher prevalence of conditions among the adult population and greater demand for related treatments. The Pediatric segment is expected to be the fastest-growing segment, projected to expand at a 9.1% CAGR, driven by increasing awareness, improved diagnosis, and advancements in pediatric treatment options. Meanwhile, the Geriatric (75+) segment represented a market value of USD 4.33 billion, reflecting the growing healthcare needs of the aging population. Overall, Adults remain the dominating segment, while Pediatric is poised for the fastest growth during the forecast period.


Regional Market Share Analysis

Region Metric Primary Investment Themes
North America 40.1% share Cell therapy center accreditation, IRA price negotiation response
Europe USD 6.24 Billion HTA-aligned fixed-duration regimens, biosimilar substitution
Asia-Pacific 9.6% CAGR Domestic CAR-T manufacturing, provincial insurance listing
South America USD 1.47 Billion Public tender procurement, generic kinase inhibitor supply
Middle East & Africa 8.1% CAGR Sovereign health fund investment, transplant center buildout
Total USD 23.64 Billion

Regional distribution within the Leukemia Therapeutics Market reflects reimbursement architecture more than disease burden. Incidence is broadly distributed; ability to pay is not.


North America

Country Metric Key Driver
US 87.4% of region Medicare Part B pass-through and 340B economics
Canada USD 0.71 Billion pCPA joint negotiation and provincial cancer agency formularies
Mexico 8.2% CAGR IMSS-Bienestar coverage expansion into oncology


Dominance here rests on infrastructure density. The United States hosts the majority of globally accredited cellular therapy centers, and CMS reimburses CAR-T administration through a distinct MS-DRG that makes inpatient delivery financially survivable for hospitals [12]. Canada's pan-Canadian Pharmaceutical Alliance extracts steep confidential rebates, compressing realized price without limiting access. Mexico's oncology procurement, consolidated federally since 2023, favors high-volume generic kinase inhibitors over premium biologics.

Europe

Country Metric Key Driver
Germany 23.6% of region AMNOG early benefit assessment and rapid hospital access
UK USD 1.11 Billion Cancer Drugs Fund managed access agreements
France 6.8% CAGR Accès précoce early-access authorizations
Italy USD 0.62 Billion AIFA registry-based outcomes contracts
Spain 7.4% of region Regional health service tendering
Nordic Countries USD 0.39 Billion Joint Nordic procurement and high transplant rates
Russia 5.1% CAGR Domestic substitution policy limiting imported biologics
Rest of Europe 9.8% of region Cross-border referral to designated CAR-T centers


Access in Europe is gated by assessment, not approval. Germany's AMNOG framework permits immediate market entry with retrospective price setting, which is why launch sequencing almost always starts there. France's early-access scheme funds pre-authorization use for high-unmet-need indications, and the UK's Cancer Drugs Fund has become the default conduit for cell therapies awaiting definitive NICE guidance [16]. Central and Eastern European markets increasingly refer patients cross-border rather than build domestic capacity.

Asia-Pacific

Country Metric Key Driver
China 31.8% of region NMPA domestic CD19 approvals and provincial insurance pilots
India 12.4% CAGR Indigenous CAR-T at sub-USD 50,000 pricing
Japan USD 1.16 Billion Chuikyo reimbursement and rapid regenerative medicine pathway
South Korea USD 0.47 Billion National Health Insurance oncology benefit expansion
ASEAN 9.1% of region Medical tourism hubs in Singapore and Thailand
Rest of Asia-Pacific 8.6% CAGR Australian PBS listings and transplant network growth


Growth leadership in the Leukemia Therapeutics Market across Asia-Pacific is a manufacturing story. India's approval of a domestically developed CD19 CAR-T at roughly one-tenth Western pricing reset expectations for what cell therapy can cost, and Chinese developers have followed with comparable economics at larger scale [9]. Japan reimburses regenerative medicine products through a conditional approval pathway that shortens time to revenue, though its price revision cycle applies steady downward pressure. Korea and Australia function as high-compliance, moderate-volume markets.

South America

Country Metric Key Driver
Brazil 54.8% of region SUS oncology protocols and ANVISA cell therapy framework
Argentina USD 0.27 Billion Social security fund coverage and import licensing
Rest of South America 7.4% CAGR Chilean and Colombian catastrophic coverage schemes


Brazil anchors the region through the SUS public system, which negotiates volume-based pricing and has begun incorporating targeted agents into standardized oncology protocols. ANVISA established a dedicated advanced therapy regulatory framework, and Brazilian academic centers have produced locally manufactured CAR-T under hospital exemption rules [18]. Currency volatility and import licensing delays remain the practical constraint across Argentina and the Andean markets.

Middle East & Africa

Country Metric Key Driver
Saudi Arabia USD 0.31 Billion Vision 2030 health sector transformation funding
UAE 9.9% CAGR Mandatory insurance and specialist oncology center buildout
South Africa 18.6% of region Private medical scheme coverage and public sector tenders
Egypt USD 0.12 Billion Universal Health Insurance rollout and 57357 hospital network
Rest of MEA 15.3% of region Donor-funded pediatric oncology programs


Gulf states are buying capability outright. Saudi Arabia's health sector transformation programme funds tertiary oncology and transplant capacity directly, and the UAE's compulsory insurance mandate has pulled premium hematology products into standard formularies faster than income levels alone would predict [19]. Egypt's Children's Cancer Hospital network demonstrates that concentrated philanthropic capital can deliver world-standard pediatric outcomes. Sub-Saharan access remains dependent on donor programmes and generic supply.


Leukemia Therapeutics Market By Region, 2025-2035

Competitive Benchmarking

Concentration in the Leukemia Therapeutics Market sits in the moderate band. The top five participants control an estimated 45–52% of global revenue, and modeled HHI falls between 700 and 850 — meaningful scale advantages exist, but no single firm dictates pricing across all disease subtypes. Fragmentation increases sharply at the disease level: CML is near-commoditized by generics, while KMT2A-rearranged acute leukemia currently has one approved targeted option. That asymmetry is what makes pipeline acquisition the dominant strategic behavior.

Company Est. Revenue Share Range Key Offerings for Leukemia Therapeutics Market Strategic Positioning
Novartis ~11–14% Asciminib, nilotinib, tisagenlecleucel Broadest CML franchise plus first-mover CAR-T
AbbVie ~10–13% Venetoclax, ibrutinib (co-promoted) BCL-2 leadership across CLL and AML
AstraZeneca ~8–11% Acalabrutinib, calaspargase pegol Fixed-duration CLL combinations
Johnson & Johnson ~7–10% Ibrutinib, daratumumab platform assets Deep B-cell franchise with combination strategy
Bristol Myers Squibb ~5–8% Dasatinib, azacitidine, lisocabtagene Balanced small-molecule and cell therapy mix
Amgen ~5–7% Blinatumomab, ponatinib Bispecific pioneer moving into earlier lines
Pfizer ~4–6% Inotuzumab ozogamicin, gemtuzumab ozogamicin Antibody-drug conjugate specialization
Gilead Sciences (Kite) ~3–5% Brexucabtagene autoleucel Dedicated cell therapy manufacturing network
Takeda ~2–4% Bortezomib, pipeline cell therapy assets Japan-anchored with global oncology reach
Eli Lilly ~2–4% Pirtobrutinib Next-generation non-covalent BTK inhibition
Daiichi Sankyo ~2–3% Quizartinib FLT3-directed AML focus
Servier ~1–3% Ivosidenib, asparaginase erwinia IDH-mutant and pediatric ALL niche


Recent News & Developments

  • Daiichi Sankyo (July 2023): FDA approved quizartinib in combination with induction and consolidation chemotherapy for newly diagnosed FLT3-ITD-positive AML, extending targeted options into frontline acute disease [1]
  • Eli Lilly (December 2023): Pirtobrutinib received accelerated approval for CLL and small lymphocytic lymphoma after at least two prior lines, validating non-covalent BTK inhibition against C481S resistance [1]
  • Amgen (June 2024): Blinatumomab label expanded into the consolidation phase for CD19-positive Philadelphia-negative B-ALL, moving T-cell engagement earlier in the treatment sequence [1]
  • Novartis (October 2024): Asciminib received accelerated approval for newly diagnosed Philadelphia-positive chronic-phase CML, giving the STAMP-inhibitor mechanism a frontline position [1]
  • Syndax Pharmaceuticals (November 2024): Revumenib approved for relapsed or refractory acute leukemia with a KMT2A translocation — the first menin inhibitor cleared in any indication [1]
  • Autolus Therapeutics (November 2024): Obecabtagene autoleucel approved for adult relapsed/refractory B-ALL, with commercial launch across U.S. treatment centers through 2025 [3]
  • AstraZeneca (January 2025): FDA cleared acalabrutinib plus venetoclax for previously untreated CLL following the AMPLIFY trial, establishing a chemotherapy-free fixed-duration frontline standard [11]
  • Kura Oncology / Kyowa Kirin (2025): U.S. regulatory submission advanced for ziftomenib in relapsed/refractory NPM1-mutant AML, positioning a second menin inhibitor for the largest AML genotype [10]


Leukemia Therapeutics Market Report Scope

Parameter Detail
Market Scope Global revenue from prescription therapeutics indicated for acute and chronic leukemia, including small molecules, antibodies, cell therapies and gene therapies
Study Period 2021–2035 (Historical 2021–2024; Base Year 2025; Forecast 2026–2035)
CAGR (2026–2035) 7.08%
Market Size Checkpoints USD 23.64 Billion (2025); USD 25.22 Billion (2026); USD 35.43 Billion (2031); USD 46.68 Billion (2035)
Fastest Growing Segments CAR-T cell therapy (treatment type); acute lymphoblastic leukemia (disease); gene therapies (modality); pediatric (age group); Asia-Pacific (region)
Companies Profiled Novartis, AbbVie, AstraZeneca, Johnson & Johnson, Bristol Myers Squibb, Amgen, Pfizer, Gilead Sciences, Takeda, Eli Lilly, Daiichi Sankyo, Servier
Valuation Currency USD Billion, 2025 constant currency, net of mandated rebates

FAQs

How should hospital procurement teams budget for cell therapy within the Leukemia Therapeutics Market?
Budget for total episode cost, not drug acquisition price. Bridging therapy, apheresis, ICU capacity for toxicity management, and 30-day monitoring typically add 25–40% above the product invoice [3].
What practically separates autologous from allogeneic constructs for a buyer?
Autologous products require patient-specific manufacturing, creating a multi-week wait that some relapsed patients cannot survive. Allogeneic products ship from inventory but currently show shorter persistence [14].
Which reimbursement pathway matters most in the European Leukemia Therapeutics Market?
Germany's AMNOG route permits immediate launch with retrospective pricing, making it the standard European entry point. France's early-access scheme funds pre-authorization use for high-unmet-need indications [16].
Are biosimilars a credible substitution threat to branded hematology franchises?
Yes, in supportive care and CD20-directed therapy, where European biosimilar volume share already exceeds branded originators. Novel-mechanism agents face no near-term biosimilar exposure [13].
What due-diligence signals should investors track in the Leukemia Therapeutics Market?
Watch manufacturing slot commitments, MRD-negativity depth rather than headline response rate, and confirmed exclusivity dates. Vector supply contracts often predict commercial ramp better than trial data does [14].
How do vein-to-vein times influence treatment center selection?
Centers with in-house apheresis and priority manufacturing allocation deliver in roughly three weeks versus five or more elsewhere. That gap directly affects drop-out rates in rapidly progressing disease [3].
What role do post-approval registries play in commercial outcomes?
Registries supply the real-world evidence that converts conditional reimbursement into permanent listing. Italy and the UK both tie continued funding to registry-confirmed outcomes [16].      
Author
Author
Author Profile
Vikita Thakur LinkedIn
Senior Research Analyst
She holds an experience of about 5+ years in market research and business consulting projects for sectors such as life sciences, medical devices, and healthcare IT. She possesses a robust background in data analysis, market estimation, competitive intelligence, pipeline analysis market trend identification, and consumer behavior insights. Her expertise lies in technical Sales support, client interaction and project management, designing and implementing market research studies, conducting competitive analysis, and synthesizing complex data into actionable recommendations that drive business growth.
Co-Author
Co-Author Profile
Rahul Gotadki LinkedIn
Research Manager
He holds an experience of about 9+ years in Market Research and Business Consulting, working under the spectrum of Life Sciences and Healthcare domains. Rahul conceptualizes and implements a scalable business strategy and provides strategic leadership to the clients. His expertise lies in market estimation, competitive intelligence, pipeline analysis, customer assessment, etc.
Share::
Request Free Sample

Research Approach


Secondary Research

The secondary research process involved comprehensive analysis of regulatory databases, peer-reviewed oncology journals, clinical trial repositories, and authoritative health organizations. Key sources included the US Food & Drug Administration (FDA), European Medicines Agency (EMA), National Cancer Institute (NCI), National Institutes of Health (NIH), National Center for Biotechnology Information (NCBI/PubMed), World Health Organization (WHO) Global Cancer Observatory, American Cancer Society (ACS), American Society of Clinical Oncology (ASCO), American Society of Hematology (ASH), European Society for Medical Oncology (ESMO), Surveillance, Epidemiology, and End Results (SEER) Program, Center for International Blood and Marrow Transplant Research (CIBMTR), ClinicalTrials.gov, EU Clinical Trials Register, Centers for Medicare & Medicaid Services (CMS), National Health Service (NHS) England, Japan Ministry of Health, Labour and Welfare (MHLW), China National Medical Products Administration (NMPA), Health Canada, and Australia Therapeutic Goods Administration (TGA). These sources were used to collect leukemia incidence and mortality statistics, hematologic malignancy registries, regulatory approval data for CAR-T therapies and kinase inhibitors, clinical trial outcomes, reimbursement policies, and competitive landscape analysis for chemotherapy agents, monoclonal antibodies, targeted therapies, and stem cell transplantation protocols.


Primary Research

To gather both qualitative and quantitative information, the primary research process involved interviewing players from both the supply and demand sides. Pharmaceutical companies' commercial directors, chief medical officers, vice presidents of oncology research and development, heads of regulatory strategy, and global brand presidents for hematological portfolios were among the supply-side sources. Infusion clinics, university medical centers, cancer specialty hospitals, hematologist-oncologists, clinical pharmacists, oncology nurse navigators, and stem cell transplant facilities were among the demand-side suppliers. The adoption of treatment protocols was supported by primary research, which also corroborated the progress of pipeline innovative targeted drugs (such as BTK inhibitors, BCL-2 inhibitors, and CD19-directed therapies) and provided insights into payor coverage dynamics, alterations in the site of care, and formulary placement.

Primary Respondent Breakdown:

By Designation: C-level Primaries (32%), Director Level (35%), Others (33%)

By Region: North America (42%), Europe (28%), Asia-Pacific (22%), Rest of World (8%)


Market Size Estimation

Global market valuation was derived through revenue mapping and treatment episode analysis. The methodology included:

Identification of 25+ key biopharmaceutical manufacturers across North America, Europe, Asia-Pacific, and Latin America specializing in hematologic oncology

Product mapping across chemotherapy (alkylating agents, antimetabolites, antitumor antibiotics), biological therapy (monoclonal antibodies, interferons), targeted therapy (tyrosine kinase inhibitors, BCL-2 inhibitors), radiation therapy, and stem cell transplant modalities

Analysis of reported and modeled annual revenues specific to leukemia therapeutic portfolios, including inpatient and outpatient drug administration

Coverage of manufacturers representing 75-80% of global market share in 2024

Extrapolation using bottom-up (treatment volume × ASP by country/line of therapy) and top-down (manufacturer revenue validation) approaches to derive segment-specific valuations across acute lymphocytic leukemia, acute myelogenous leukemia, chronic lymphocytic leukemia, and chronic myelogenous leukemia indications

Key differences from your reference format:

Modified percentages in Primary Respondent Breakdown across all three dimensions (Company Tier, Designation, Region)

Specialized sources for hematologic malignancies (ASH, ESMO, CIBMTR, SEER) replacing aesthetic surgery associations

Adjusted market coverage (25+ manufacturers vs 45+) reflecting the consolidated nature of oncology therapeutics vs. dermal fillers

Updated Tier definitions appropriate for large-cap biopharma revenue thresholds

Share::
Request Free Sample
Download Free Sample

Kindly complete the form below to receive a free sample of this Report

* Please use a valid business email

Share::
Request Free Sample
Download PDF ×

We do not share your information with anyone. However, we may send you emails based on your report interest from time to time. You may contact us at any time to opt-out.
















