Segmentation Quick Reference
| Dimension | Sub-Segments | Dominant Segment | Fastest Growing Segment |
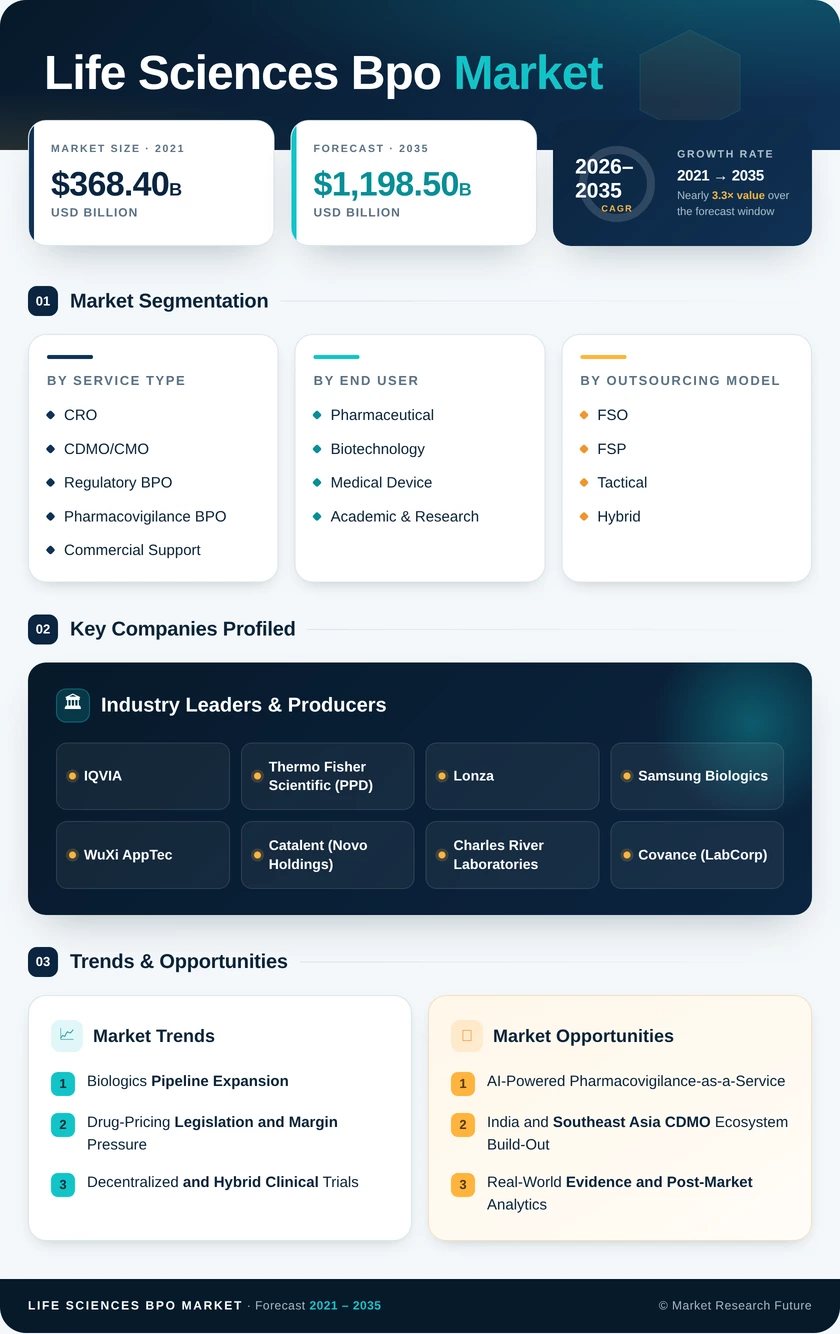
| Service Type | CRO, CDMO/CMO, Regulatory BPO, Pharmacovigilance BPO, Commercial Support, Supply-Chain BPO | CRO | CDMO/CMO |
| End User | Pharmaceutical, Biotechnology, Medical Device, Academic & Research | Pharmaceutical | Biotechnology |
| Outsourcing Model | FSO, FSP, Tactical, Hybrid | FSO | FSP |
| Region | North America, Europe, Asia-Pacific, South America, Middle East & Africa | North America | Asia-Pacific |
Market Segmentation Overview
By Service Type
| Sub-Segment | Key Trend |
| CRO | Decentralized trial adoption expanding addressable scope |
| CDMO/CMO | Biologics and cell-gene therapy driving capacity investments |
| Regulatory BPO | AI automation transforming submission assembly workflows |
| Pharmacovigilance BPO | Machine-learning case triage replacing manual processing |
| Commercial Support | Market-access analytics and pricing strategy outsourcing rising |
| Supply-Chain BPO | Cold-chain complexity for biologics fueling demand |
CRO services remain the largest service category, processing thousands of clinical trials annually across all therapeutic areas. CDMO/CMO services are scaling at the fastest rate as biologics and advanced therapies require specialized manufacturing that most sponsors cannot build in-house.
By End User
| Sub-Segment | Key Trend |
| Pharmaceutical | Margin pressure accelerating outsource-first operating models |
| Biotechnology | Venture-funded startups outsourcing from day one |
| Medical Device | EU MDR compliance driving regulatory BPO demand |
| Academic & Research | Grant-funded translational programs requiring CRO partnerships |
Pharmaceutical companies account for the majority of outsourcing spend due to their large, diversified pipelines and enterprise-wide cost-optimization mandates. Biotechnology firms represent the fastest-growing user segment as capital-efficient startups externalize virtually all operational functions.
By Outsourcing Model
| Sub-Segment | Key Trend |
| Full-Service Outsourcing (FSO) | Single-vendor accountability for end-to-end program delivery |
| Functional Service Provider (FSP) | Sponsors embedding outsourced teams under internal governance |
| Tactical Outsourcing | Short-term resource augmentation for peak workloads |
| Hybrid Model | Blended FSO-FSP structures for complex multi-regional trials |
Full-service outsourcing dominates by revenue share, offering streamlined project management across clinical development milestones. The FSP model is the fastest-growing structure, appealing to large pharmaceutical companies that want direct control over outsourced teams and workflows.
By Region
| Sub-Segment | Key Trend |
| North America | Regulatory complexity and pharma HQ density sustain leadership |
| Europe | EMA harmonization and post-Brexit UK agility shape dynamics |
| Asia-Pacific | India PLI scheme and South Korea biologics CDMO fuel growth |
| South America | Brazil's ANVISA modernization expands clinical trial access |
| Middle East & Africa | Vision 2030 healthcare investment opens new outsourcing corridors |
North America leads global spending, driven by the concentration of large pharmaceutical headquarters and the FDA's extensive regulatory requirements. Asia-Pacific is the fastest-growing region, with India, South Korea, and Southeast Asian nations rapidly building CDMO and CRO capacity to serve both domestic and global sponsors.