Liquid Handling System Market (2025 - 2035)

ID: MRFR/MED/5126-HCR
90 Pages
Rahul Gotadki
Last Updated: July 12, 2026
Liquid Handling System Market Research Report: Size, Share, Trend Analysis By Fusion Type (Anterior Interbody Fusion, Anterior Liquid handling system, Posterior Fusion), By Types (Metal, Polymer, And Others), By Surgery (Minimally Invasive Spine Surgery, And Open Spine Surgery), By End Userss (Orthopedic Clinics, Multispecialty Hospitals, Neurology Clinics, And Others), And By Region (North America, Europe, Asia-Pacific, And Rest Of The World) - Growth Outlook & Industry Forecast 2025 To 2035
Liquid Handling System Market
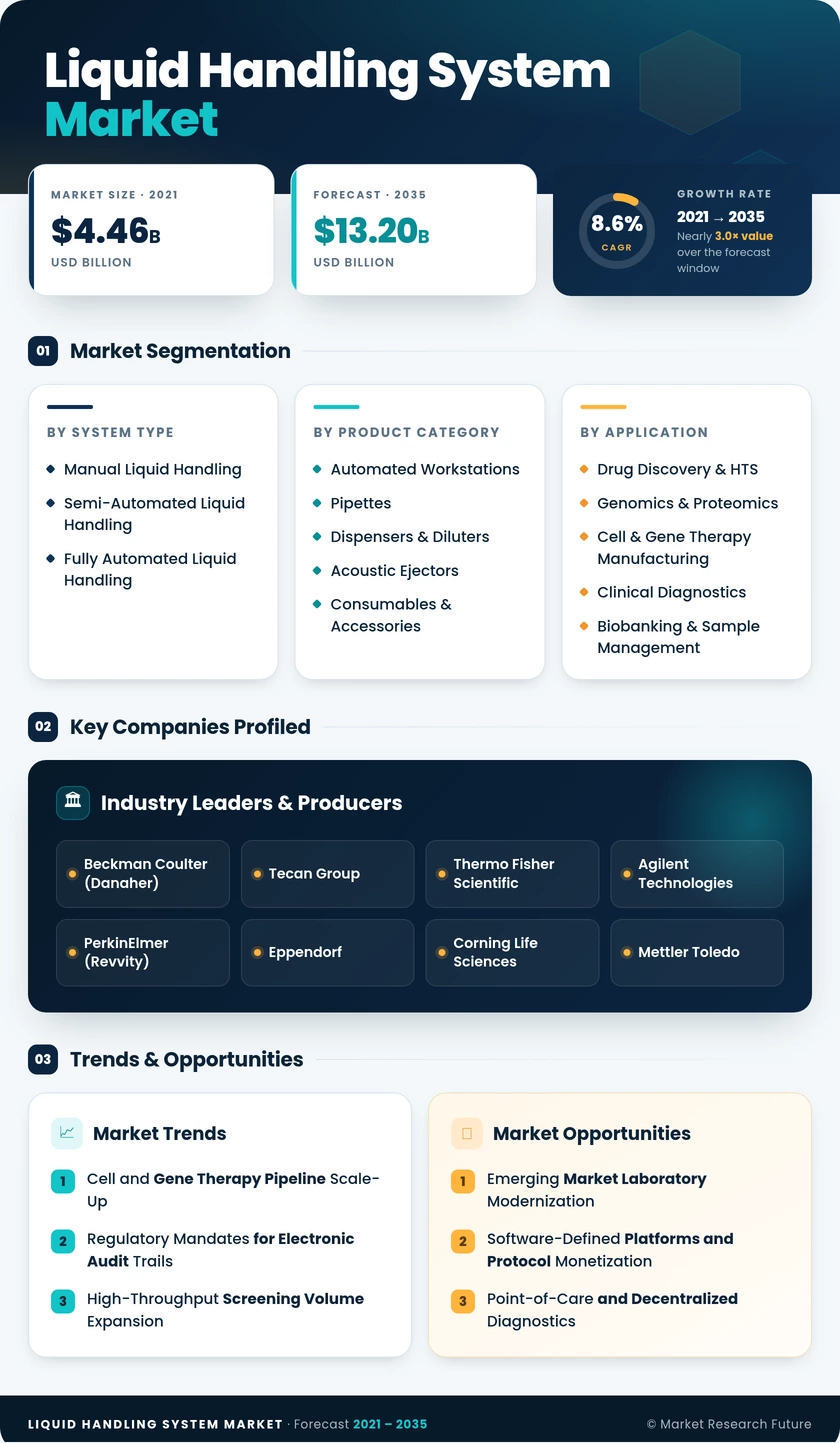
Market Size
Forecast Period2025-2035
CAGR (2025-2035)8.6%
2025 Market SizeUSD 5.79 Billion
2035 Market SizeUSD 13.20 Billion
Key Players
Beckman Coulter
Tecan Group
Thermo Fisher Scientific
Agilent Technologies
PerkinElmer
Eppendorf
Opportunities
  • Emerging Market Laboratory Modernization
  • Software-Defined Platforms and Protocol Monetization
  • Point-of-Care and Decentralized Diagnostics
  1. 1 Market Overview |
    1. 1.1 Study Assumptions & Market Definition |
    2. 1.2 Scope of the Study |
    3. 1.3 Research Methodology
  2. 2 Market Summary & Key Takeaways
  3. 3 Market Dynamics |
    1. 3.1 Market Drivers Analysis | |
      1. 3.1.1 Cell & Gene Therapy Pipeline Scale-Up | |
      2. 3.1.2 Regulatory Mandates for Electronic Audit Trails | |
      3. 3.1.3 High-Throughput Screening Volume Expansion | |
      4. 3.1.4 AI and Machine Learning Integration in Lab Workflows | |
      5. 3.1.5 Synthetic Biology Venture Funding Surge | |
      6. 3.1.6 Modular Leasing and DaaS Financing Models | |
      7. 3.1.7 Precision Medicine and Companion Diagnostics Expansion |
    2. 3.2 Market Restraints Analysis | |
      1. 3.2.1 High Upfront Capital Costs for Automated Platforms | |
      2. 3.2.2 Integration Complexity with Legacy LIMS/ELN Systems | |
      3. 3.2.3 Shortage of Trained Automation Specialists | |
      4. 3.2.4 Proprietary Consumable Lock-In Concerns | |
      5. 3.2.5 Validation Burden for Regulated Applications |
    3. 3.3 Market Opportunity Analysis | |
      1. 3.3.1 Emerging Market Laboratory Modernization | |
      2. 3.3.2 Software-Defined Platforms and Protocol Monetization | |
      3. 3.3.3 Point-of-Care and Decentralized Diagnostics | |
      4. 3.3.4 Sustainability-Driven Consumable Innovation | |
      5. 3.3.5 Synthetic Biology and Biofoundry Expansion |
    4. 3.4 Industry Value Chain Analysis |
    5. 3.5 Porter's Five Forces Analysis
  4. 4 Global Liquid Handling System Market Size & Forecast (2021–2035) |
    1. 4.1 Historical Market Size (2021–2025) |
    2. 4.2 Current & Forecast Market Size (2026–2035) |
    3. 4.3 Market Size by Revenue (USD Billion) |
    4. 4.4 Year-over-Year Growth Analysis
  5. 5 Segmentation Analysis |
    1. 5.1 By System Type | |
      1. 5.1.1 Manual Liquid Handling | |
      2. 5.1.2 Semi-Automated Liquid Handling | |
      3. 5.1.3 Fully Automated Liquid Handling |
    2. 5.2 By Product Category | |
      1. 5.2.1 Automated Workstations | |
      2. 5.2.2 Pipettes (Single-Channel, Multi-Channel) | |
      3. 5.2.3 Dispensers & Diluters | |
      4. 5.2.4 Acoustic Ejectors | |
      5. 5.2.5 Consumables & Accessories |
    3. 5.3 By Application | |
      1. 5.3.1 Drug Discovery & High-Throughput Screening | |
      2. 5.3.2 Genomics & Proteomics | |
      3. 5.3.3 Cell & Gene Therapy Manufacturing | |
      4. 5.3.4 Clinical Diagnostics | |
      5. 5.3.5 Biobanking & Sample Management |
    4. 5.4 By End User | |
      1. 5.4.1 Pharmaceutical & Biotechnology Companies | |
      2. 5.4.2 Academic & Government Research Institutes | |
      3. 5.4.3 Contract Research & Manufacturing Organizations | |
      4. 5.4.4 Clinical Diagnostics Laboratories | |
      5. 5.4.5 Other End Users
  6. 6 Regional Analysis |
    1. 6.1 North America | |
      1. 6.1.1 United States | |
      2. 6.1.2 Canada | |
      3. 6.1.3 Mexico |
    2. 6.2 Europe | |
      1. 6.2.1 Germany | |
      2. 6.2.2 United Kingdom | |
      3. 6.2.3 France | |
      4. 6.2.4 Italy | |
      5. 6.2.5 Spain | |
      6. 6.2.6 Nordic Countries | |
      7. 6.2.7 Russia | |
      8. 6.2.8 Rest of Europe |
    3. 6.3 Asia-Pacific | |
      1. 6.3.1 China | |
      2. 6.3.2 India | |
      3. 6.3.3 Japan | |
      4. 6.3.4 South Korea | |
      5. 6.3.5 ASEAN | |
      6. 6.3.6 Rest of Asia-Pacific |
    4. 6.4 South America | |
      1. 6.4.1 Brazil | |
      2. 6.4.2 Argentina | |
      3. 6.4.3 Rest of South America |
    5. 6.5 Middle East & Africa | |
      1. 6.5.1 Saudi Arabia | |
      2. 6.5.2 UAE | |
      3. 6.5.3 South Africa | |
      4. 6.5.4 Egypt | |
      5. 6.5.5 Rest of MEA
  7. 7 Competitive Landscape |
    1. 7.1 Market Share Analysis (2025) |
    2. 7.2 Competitive Benchmarking Matrix |
    3. 7.3 Company Profiles | |
      1. 7.3.1 Beckman Coulter (Danaher) | |
      2. 7.3.2 Hamilton Company | |
      3. 7.3.3 Tecan Group | |
      4. 7.3.4 Thermo Fisher Scientific | |
      5. 7.3.5 Agilent Technologies | |
      6. 7.3.6 Revvity (formerly PerkinElmer) | |
      7. 7.3.7 Eppendorf | |
      8. 7.3.8 Corning Life Sciences | |
      9. 7.3.9 Mettler Toledo | |
      10. 7.3.10 Sartorius | |
      11. 7.3.11 Bio-Rad Laboratories | |
      12. 7.3.12 Gilson
  8. 8 Future Outlook & Strategic Recommendations (2026–2035) |
    1. 8.1 AI-Autonomous Laboratory Operations |
    2. 8.2 Platform Economics and Recurring Revenue Models |
    3. 8.3 Sustainability and Circular Lab Operations |
    4. 8.4 Precision Medicine and Companion Diagnostics Integration
  9. 9 Recent Developments & News
  10. 10 Frequently Asked Questions (FAQs)
  11. 11 Report Scope & Methodology |
    1. 11.1 Study Period & Base Year |
    2. 11.2 Data Sources & Citations |
    3. 11.3 Abbreviations
  12. 12 LIST OF TABLES |
  13. TABLE 1 Global Liquid Handling System Market Size & Forecast, by Revenue (USD Billion), 2021–2035 |
  14. TABLE 2 Global Liquid Handling System Market — Year-over-Year Growth Analysis, 2021–2035 |
  15. TABLE 3 Global Liquid Handling System Market — Driver Impact Analysis |
  16. TABLE 4 Global Liquid Handling System Market — Restraint Impact Analysis |
  17. TABLE 5 Global Liquid Handling System Market Size, by System Type, 2021–2035 (USD Billion) |
  18. TABLE 6 Global Liquid Handling System Market Size, by Product Category, 2021–2035 (USD Billion) |
  19. TABLE 7 Global Liquid Handling System Market Size, by Application, 2021–2035 (USD Billion) |
  20. TABLE 8 Global Liquid Handling System Market Size, by End User, 2021–2035 (USD Billion) |
  21. TABLE 9 Global Liquid Handling System Market Size, by Region, 2021–2035 (USD Billion) |
  22. TABLE 10 North America Liquid Handling System Market Size, by Country, 2021–2035 (USD Billion) |
  23. TABLE 11 Europe Liquid Handling System Market Size, by Country, 2021–2035 (USD Billion) |
  24. TABLE 12 Asia-Pacific Liquid Handling System Market Size, by Country, 2021–2035 (USD Billion) |
  25. TABLE 13 South America Liquid Handling System Market Size, by Country, 2021–2035 (USD Billion) |
  26. TABLE 14 Middle East & Africa Liquid Handling System Market Size, by Country, 2021–2035 (USD Billion) |
  27. TABLE 15 Competitive Benchmarking Matrix — Global Liquid Handling System Market, 2025 |
  28. TABLE 16 Company Profiles — Key Players, Global Liquid Handling System Market |
  29. TABLE 17 Recent Developments & Strategic Announcements, 2023–2025 |
  30. TABLE 18 North America Liquid Handling System Market Size, by System Type, 2021–2035 (USD Billion) |
  31. TABLE 19 North America Liquid Handling System Market Size, by Product Category, 2021–2035 (USD Billion) |
  32. TABLE 20 North America Liquid Handling System Market Size, by Application, 2021–2035 (USD Billion) |
  33. TABLE 21 North America Liquid Handling System Market Size, by End User, 2021–2035 (USD Billion) |
  34. TABLE 22 Europe Liquid Handling System Market Size, by System Type, 2021–2035 (USD Billion) |
  35. TABLE 23 Europe Liquid Handling System Market Size, by Product Category, 2021–2035 (USD Billion) |
  36. TABLE 24 Europe Liquid Handling System Market Size, by Application, 2021–2035 (USD Billion) |
  37. TABLE 25 Europe Liquid Handling System Market Size, by End User, 2021–2035 (USD Billion) |
  38. TABLE 26 Asia-Pacific Liquid Handling System Market Size, by System Type, 2021–2035 (USD Billion) |
  39. TABLE 27 Asia-Pacific Liquid Handling System Market Size, by Product Category, 2021–2035 (USD Billion) |
  40. TABLE 28 Asia-Pacific Liquid Handling System Market Size, by Application, 2021–2035 (USD Billion) |
  41. TABLE 29 Asia-Pacific Liquid Handling System Market Size, by End User, 2021–2035 (USD Billion) |
  42. TABLE 30 South America Liquid Handling System Market Size, by System Type, 2021–2035 (USD Billion) |
  43. TABLE 31 South America Liquid Handling System Market Size, by Product Category, 2021–2035 (USD Billion) |
  44. TABLE 32 South America Liquid Handling System Market Size, by Application, 2021–2035 (USD Billion) |
  45. TABLE 33 South America Liquid Handling System Market Size, by End User, 2021–2035 (USD Billion) |
  46. TABLE 34 Middle East & Africa Liquid Handling System Market Size, by System Type, 2021–2035 (USD Billion) |
  47. TABLE 35 Middle East & Africa Liquid Handling System Market Size, by Product Category, 2021–2035 (USD Billion) |
  48. TABLE 36 Middle East & Africa Liquid Handling System Market Size, by Application, 2021–2035 (USD Billion) |
  49. TABLE 37 Middle East & Africa Liquid Handling System Market Size, by End User, 2021–2035 (USD Billion) |
  50. TABLE 38 Report Scope & Methodology Summary |
  51. TABLE 39 Detailed Sources and Citations
  52. 13 LIST OF FIGURES |
  53. FIGURE 1 Global Liquid Handling System Market Dynamics — Drivers, Restraints, Opportunities |
  54. FIGURE 2 Industry Value Chain Analysis — Liquid Handling System Market |
  55. FIGURE 3 Porter's Five Forces Analysis — Liquid Handling System Market |
  56. FIGURE 4 Global Liquid Handling System Market Size Trend (USD Billion), 2021–2035 |
  57. FIGURE 5 Global Liquid Handling System Market Share, by System Type, 2025 (%) |
  58. FIGURE 6 Global Liquid Handling System Market Share, by Product Category, 2025 (%) |
  59. FIGURE 7 Global Liquid Handling System Market Share, by Application, 2025 (%) |
  60. FIGURE 8 Global Liquid Handling System Market Share, by End User, 2025 (%) |
  61. FIGURE 9 Global Liquid Handling System Market Share, by Region, 2025 (%) |
  62. FIGURE 10 North America Liquid Handling System Market Size Trend, 2021–2035 (USD Billion) |
  63. FIGURE 11 Europe Liquid Handling System Market Size Trend, 2021–2035 (USD Billion) |
  64. FIGURE 12 Asia-Pacific Liquid Handling System Market Size Trend, 2021–2035 (USD Billion) |
  65. FIGURE 13 South America Liquid Handling System Market Size Trend, 2021–2035 (USD Billion) |
  66. FIGURE 14 Middle East & Africa Liquid Handling System Market Size Trend, 2021–2035 (USD Billion) |
  67. FIGURE 15 Competitive Landscape — Market Share Analysis, 2025

Segmentation Quick Reference

DimensionSub-SegmentsDominant SegmentFastest Growing Segment
By System TypeManual Liquid Handling, Semi-Automated Liquid Handling, Fully Automated Liquid HandlingSemi-Automated Liquid Handling (30.6% share)Fully Automated Liquid Handling (11.55% CAGR)
By Product CategoryAutomated Workstations, Pipettes, Dispensers & Diluters, Acoustic Ejectors, Consumables & AccessoriesAutomated Workstations (26.9% share)Acoustic Ejectors (10.95% CAGR)
By ApplicationDrug Discovery & HTS, Genomics & Proteomics, Cell & Gene Therapy Manufacturing, Clinical Diagnostics, Biobanking & Sample ManagementDrug Discovery & HTS (37.8% share)Cell & Gene Therapy Manufacturing (12.75% CAGR)
By End UserPharmaceutical & Biotechnology Companies, Academic & Government Research Institutes, CROs/CMOs, Clinical Diagnostics Laboratories, Other End UsersPharmaceutical & Biotechnology Companies (40.7% share)CROs/CMOs (11.95% CAGR)


Market Segmentation Overview

By System Type

Sub-SegmentKey Trend
Manual Liquid HandlingPersistent in academic and educational settings; electronic pipettes gradually replacing mechanical models
Semi-Automated Liquid HandlingTransitional adoption tier; mid-tier labs upgrading for reproducibility and audit capability
Fully Automated Liquid HandlingFastest growth driven by GxP compliance, cell therapy manufacturing, and high-throughput screening requirements


Manual liquid handling retains a meaningful installed base in academic teaching laboratories and budget-constrained research environments, though the shift toward electronic pipettes with Bluetooth data logging is eroding the purely manual segment. Semi-automated platforms serve as the gateway to full automation, while fully automated systems increasingly define procurement priorities in pharmaceutical and CDMO settings.

By Product Category

Sub-SegmentKey Trend
Automated WorkstationsCentral platform for drug screening and compound management; modular configurations gaining favor
Pipettes (Single-Channel, Multi-Channel)Universal laboratory staple; electronic models with connectivity features displacing mechanical units
Dispensers & DilutersGrowing in clinical diagnostics; peristaltic and syringe-based models for medium-throughput workflows
Acoustic EjectorsContactless dispensing for genomics and miniaturized assays; eliminates consumable tip waste
Consumables & AccessoriesRecurring revenue driver; tips, plates, and reservoirs represent ongoing spend for all system types


Automated workstations remain the highest-value product segment, with vendors competing on integration depth, software ecosystem quality, and multi-modality dispensing capability. Acoustic ejectors represent the most differentiated technology, using focused sound energy for tip-free nanoliter dispensing that is increasingly critical in genomics applications.

By Application

Sub-SegmentKey Trend
Drug Discovery & HTSLargest application segment; compound library expansion driving volume requirements
Genomics & ProteomicsNGS library preparation and single-cell workflows require high-precision, low-volume transfers
Cell & Gene Therapy ManufacturingFastest growing; GMP-compliant closed-system liquid handling for autologous and allogeneic therapies
Clinical DiagnosticsImmunoassay and molecular diagnostics automation; regulatory requirements favor validated systems
Biobanking & Sample ManagementPopulation genomics and longitudinal cohort studies driving automated aliquoting and storage


Drug discovery and high-throughput screening dominate by revenue, while cell and gene therapy manufacturing is the standout growth vertical as approved therapies move from clinical-stage boutique production to commercial-scale operations.

By End User

Sub-SegmentKey Trend
Pharmaceutical & Biotechnology CompaniesLargest end-user group; platform standardization across multi-site operations
Academic & Government Research InstitutesGrant-funded instrumentation cycles; core facility shared-access models
Contract Research & Manufacturing OrganizationsFastest growing; flexibility and rapid reconfiguration for multi-client service
Clinical Diagnostics LaboratoriesAutomation of routine immunoassay and molecular workflows
Other End UsersFood safety testing, environmental monitoring, forensics


Pharmaceutical and biotechnology companies drive the largest share of procurement activity, while CROs and CDMOs are expanding fastest as the outsourcing model continues to gain share in drug development and manufacturing.


 

Download PDF ×

We do not share your information with anyone. However, we may send you emails based on your report interest from time to time. You may contact us at any time to opt-out.