Low Code Development Platform Market (2026 - 2035)

ID: MRFR/ICT/3912-CR
167 Pages
Ankit Gupta
Last Updated: August 04, 2026
Low Code Development Platform Market Size, Share and Trends Analysis Research Report By Component (Solution and Service), Type (General Purpose Platform, Database App Platform, Process App Platform, Request Handling Platform and Others), Deployment (On Premise and On Cloud), Organization Size (Small and Medium Enterprise and Large Enterprise), Vertical (Retail and E-Commerce, Healthcare Media and Entertainment, BFSI, IT & Telecommunications, Government and Others), and Region (North America, Europe, Asia-Pacific, Middle East & Africa, and South America) - Forecast till 2035
Low Code Development Platform Market
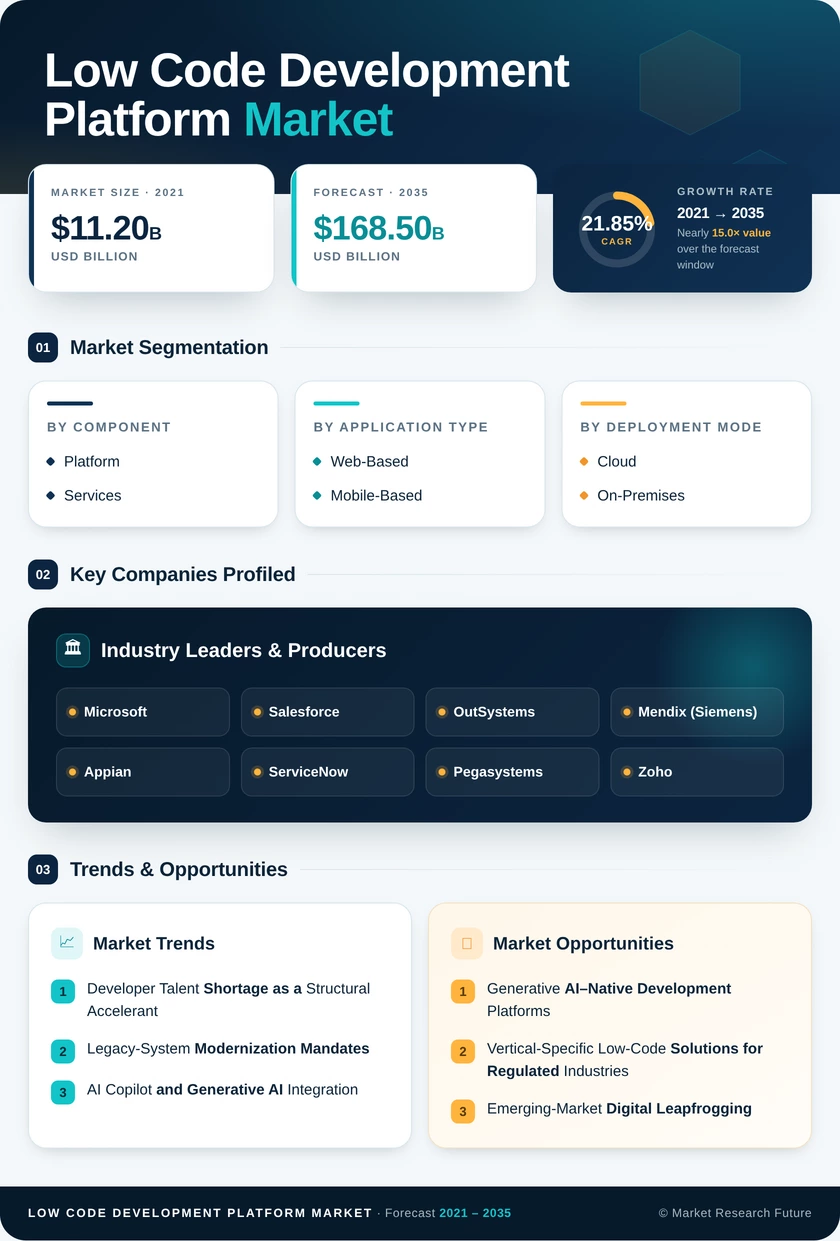
Market Size
Forecast Period2026-2035
CAGR (2026-2035)21.85%
2025 Market SizeUSD 28.15 Billion
2035 Market SizeUSD 168.50 Billion
Key Players
Microsoft
Salesforce
OutSystems
Mendix
Appian
ServiceNow
Opportunities
  • Generative AI–Native Development Platforms
  • Vertical-Specific Low-Code Solutions for Regulated Industries
  • Emerging-Market Digital Leapfrogging
  1. 1 Market Overview |
    1. 1.1 Study Assumptions & Market Definition |
    2. 1.2 Scope of the Study |
    3. 1.3 Research Methodology
  2. 2 Market Summary & Key Takeaways
  3. 3 Market Dynamics |
    1. 3.1 Market Drivers Analysis | |
      1. 3.1.1 Acute Developer Talent Shortage | |
      2. 3.1.2 Legacy-System Modernization Mandates | |
      3. 3.1.3 AI Copilot and Generative AI Integration | |
      4. 3.1.4 Cloud-First and Sovereign-Cloud Frameworks | |
      5. 3.1.5 Regulatory Compliance Deadlines (DORA, FedRAMP) | |
      6. 3.1.6 Citizen Developer Workforce Expansion | |
      7. 3.1.7 Data-Fabric and Composable Architecture Adoption |
    2. 3.2 Market Restraints Analysis | |
      1. 3.2.1 Vendor Lock-In and Portability Risks | |
      2. 3.2.2 Security Gaps in Citizen-Developed Applications | |
      3. 3.2.3 Scalability Ceilings for Mission-Critical Workloads | |
      4. 3.2.4 Integration Complexity with Legacy Middleware | |
      5. 3.2.5 Shadow IT Governance Risks |
    3. 3.3 Market Opportunity Analysis | |
      1. 3.3.1 Generative AI–Native Development Platforms | |
      2. 3.3.2 Vertical-Specific Low-Code Solutions for Regulated Industries | |
      3. 3.3.3 Emerging-Market Digital Leapfrogging | |
      4. 3.3.4 Low-Code as a Data Monetization Enabler | |
      5. 3.3.5 Embedded Finance and Composable Banking Modules |
    4. 3.4 Industry Value Chain Analysis |
    5. 3.5 Porter's Five Forces Analysis
  4. 4 Global Low Code Development Platform Market Size & Forecast (2021–2035) |
    1. 4.1 Historical Market Size (2021–2025) |
    2. 4.2 Current & Forecast Market Size (2026–2035) |
    3. 4.3 Market Size by Revenue (USD Billion) |
    4. 4.4 Year-over-Year Growth Analysis
  5. 5 Segmentation Analysis |
    1. 5.1 By Component | |
      1. 5.1.1 Platform | |
      2. 5.1.2 Services |
    2. 5.2 By Application Type | |
      1. 5.2.1 Web-Based Development | |
      2. 5.2.2 Mobile-Based Development |
    3. 5.3 By Deployment Mode | |
      1. 5.3.1 Cloud | |
      2. 5.3.2 On-Premises |
    4. 5.4 By Organization Size | |
      1. 5.4.1 Large Enterprises | |
      2. 5.4.2 Small and Medium Enterprises (SMEs) |
    5. 5.5 By Industry Vertical | |
      1. 5.5.1 BFSI | |
      2. 5.5.2 Retail & E-Commerce | |
      3. 5.5.3 IT & Telecom | |
      4. 5.5.4 Healthcare | |
      5. 5.5.5 Education | |
      6. 5.5.6 Manufacturing | |
      7. 5.5.7 Government & Public Sector
  6. 6 Regional Analysis |
    1. 6.1 North America | |
      1. 6.1.1 United States | |
      2. 6.1.2 Canada | |
      3. 6.1.3 Mexico |
    2. 6.2 Europe | |
      1. 6.2.1 Germany | |
      2. 6.2.2 United Kingdom | |
      3. 6.2.3 France | |
      4. 6.2.4 Italy | |
      5. 6.2.5 Spain | |
      6. 6.2.6 Nordic Countries | |
      7. 6.2.7 Russia | |
      8. 6.2.8 Rest of Europe |
    3. 6.3 Asia-Pacific | |
      1. 6.3.1 China | |
      2. 6.3.2 India | |
      3. 6.3.3 Japan | |
      4. 6.3.4 South Korea | |
      5. 6.3.5 ASEAN | |
      6. 6.3.6 Rest of Asia-Pacific |
    4. 6.4 South America | |
      1. 6.4.1 Brazil | |
      2. 6.4.2 Argentina | |
      3. 6.4.3 Rest of South America |
    5. 6.5 Middle East & Africa | |
      1. 6.5.1 Saudi Arabia | |
      2. 6.5.2 UAE | |
      3. 6.5.3 South Africa | |
      4. 6.5.4 Egypt | |
      5. 6.5.5 Rest of MEA
  7. 7 Competitive Landscape |
    1. 7.1 Market Share Analysis (2025) |
    2. 7.2 Competitive Benchmarking Matrix |
    3. 7.3 Company Profiles | |
      1. 7.3.1 Microsoft | |
      2. 7.3.2 Salesforce | |
      3. 7.3.3 OutSystems | |
      4. 7.3.4 Mendix (Siemens) | |
      5. 7.3.5 Appian | |
      6. 7.3.6 ServiceNow | |
      7. 7.3.7 Pegasystems | |
      8. 7.3.8 Zoho | |
      9. 7.3.9 Retool | |
      10. 7.3.10 Kissflow
  8. 8 Future Outlook & Strategic Recommendations (2026–2035) |
    1. 8.1 AI-Autonomous Development Agents (2026–2029) |
    2. 8.2 Platform Economics and Marketplace Consolidation (2027–2031) |
    3. 8.3 Composable Enterprise Architecture (2028–2033) |
    4. 8.4 Sustainability and ESG Reporting Automation (2029–2035)
  9. 9 Recent Developments & News
  10. 10 Frequently Asked Questions (FAQs)
  11. 11 Report Scope & Methodology |
    1. 11.1 Study Period & Base Year |
    2. 11.2 Data Sources & Citations |
    3. 11.3 Abbreviations
  12. 12 LIST OF TABLES |
  13. TABLE 1 Global Low Code Development Platform Market Size & Forecast, by Revenue (USD Billion), 2021–2035 |
  14. TABLE 2 Global Low Code Development Platform Market – Year-over-Year Growth Analysis, 2021–2035 |
  15. TABLE 3 Global Low Code Development Platform Market – Driver Impact Analysis |
  16. TABLE 4 Global Low Code Development Platform Market – Restraint Impact Analysis |
  17. TABLE 5 Global Low Code Development Platform Market Size, by Component, 2021–2035 (USD Billion) |
  18. TABLE 6 Global Low Code Development Platform Market Size, by Application Type, 2021–2035 (USD Billion) |
  19. TABLE 7 Global Low Code Development Platform Market Size, by Deployment Mode, 2021–2035 (USD Billion) |
  20. TABLE 8 Global Low Code Development Platform Market Size, by Organization Size, 2021–2035 (USD Billion) |
  21. TABLE 9 Global Low Code Development Platform Market Size, by Industry Vertical, 2021–2035 (USD Billion) |
  22. TABLE 10 Global Low Code Development Platform Market Size, by Region, 2021–2035 (USD Billion) |
  23. TABLE 11 North America Low Code Development Platform Market Size, by Country, 2021–2035 (USD Billion) |
  24. TABLE 12 Europe Low Code Development Platform Market Size, by Country, 2021–2035 (USD Billion) |
  25. TABLE 13 Asia-Pacific Low Code Development Platform Market Size, by Country, 2021–2035 (USD Billion) |
  26. TABLE 14 South America Low Code Development Platform Market Size, by Country, 2021–2035 (USD Billion) |
  27. TABLE 15 Middle East & Africa Low Code Development Platform Market Size, by Country, 2021–2035 (USD Billion) |
  28. TABLE 16 Competitive Benchmarking Matrix – Global Low Code Development Platform Market, 2025 |
  29. TABLE 17 Company Profiles – Key Players, Global Low Code Development Platform Market |
  30. TABLE 18 Recent Developments & Strategic Announcements, 2023–2025 |
  31. TABLE 19 Report Scope & Methodology Summary |
  32. TABLE 20 Detailed Sources and Citations |
  33. TABLE 21 North America Low Code Development Platform Market Size, by Component, 2021–2035 (USD Billion) |
  34. TABLE 22 North America Low Code Development Platform Market Size, by Application Type, 2021–2035 (USD Billion) |
  35. TABLE 23 North America Low Code Development Platform Market Size, by Deployment Mode, 2021–2035 (USD Billion) |
  36. TABLE 24 North America Low Code Development Platform Market Size, by Organization Size, 2021–2035 (USD Billion) |
  37. TABLE 25 North America Low Code Development Platform Market Size, by Industry Vertical, 2021–2035 (USD Billion) |
  38. TABLE 26 Europe Low Code Development Platform Market Size, by Component, 2021–2035 (USD Billion) |
  39. TABLE 27 Europe Low Code Development Platform Market Size, by Application Type, 2021–2035 (USD Billion) |
  40. TABLE 28 Europe Low Code Development Platform Market Size, by Deployment Mode, 2021–2035 (USD Billion) |
  41. TABLE 29 Europe Low Code Development Platform Market Size, by Organization Size, 2021–2035 (USD Billion) |
  42. TABLE 30 Europe Low Code Development Platform Market Size, by Industry Vertical, 2021–2035 (USD Billion) |
  43. TABLE 31 Asia-Pacific Low Code Development Platform Market Size, by Component, 2021–2035 (USD Billion) |
  44. TABLE 32 Asia-Pacific Low Code Development Platform Market Size, by Application Type, 2021–2035 (USD Billion) |
  45. TABLE 33 Asia-Pacific Low Code Development Platform Market Size, by Deployment Mode, 2021–2035 (USD Billion) |
  46. TABLE 34 Asia-Pacific Low Code Development Platform Market Size, by Organization Size, 2021–2035 (USD Billion) |
  47. TABLE 35 Asia-Pacific Low Code Development Platform Market Size, by Industry Vertical, 2021–2035 (USD Billion) |
  48. TABLE 36 South America Low Code Development Platform Market Size, by Component, 2021–2035 (USD Billion) |
  49. TABLE 37 South America Low Code Development Platform Market Size, by Application Type, 2021–2035 (USD Billion) |
  50. TABLE 38 South America Low Code Development Platform Market Size, by Deployment Mode, 2021–2035 (USD Billion) |
  51. TABLE 39 South America Low Code Development Platform Market Size, by Organization Size, 2021–2035 (USD Billion) |
  52. TABLE 40 South America Low Code Development Platform Market Size, by Industry Vertical, 2021–2035 (USD Billion) |
  53. TABLE 41 Middle East & Africa Low Code Development Platform Market Size, by Component, 2021–2035 (USD Billion) |
  54. TABLE 42 Middle East & Africa Low Code Development Platform Market Size, by Application Type, 2021–2035 (USD Billion) |
  55. TABLE 43 Middle East & Africa Low Code Development Platform Market Size, by Deployment Mode, 2021–2035 (USD Billion) |
  56. TABLE 44 Middle East & Africa Low Code Development Platform Market Size, by Organization Size, 2021–2035 (USD Billion) |
  57. TABLE 45 Middle East & Africa Low Code Development Platform Market Size, by Industry Vertical, 2021–2035 (USD Billion)
  58. 13 LIST OF FIGURES |
  59. FIGURE 1 Low Code Development Platform Market Dynamics — Drivers, Restraints, Opportunities |
  60. FIGURE 2 Industry Value Chain Analysis — Low Code Development Platform Market |
  61. FIGURE 3 Porter's Five Forces Analysis — Low Code Development Platform Market |
  62. FIGURE 4 Global Low Code Development Platform Market Size Trend (USD Billion), 2021–2035 |
  63. FIGURE 5 Low Code Development Platform Market Share, by Component, 2025 (%) |
  64. FIGURE 6 Low Code Development Platform Market Share, by Application Type, 2025 (%) |
  65. FIGURE 7 Low Code Development Platform Market Share, by Deployment Mode, 2025 (%) |
  66. FIGURE 8 Low Code Development Platform Market Share, by Organization Size, 2025 (%) |
  67. FIGURE 9 Low Code Development Platform Market Share, by Industry Vertical, 2025 (%) |
  68. FIGURE 10 Low Code Development Platform Market Share, by Region, 2025 (%) |
  69. FIGURE 11 North America Low Code Development Platform Market Size (USD Billion), 2021–2035 |
  70. FIGURE 12 Europe Low Code Development Platform Market Size (USD Billion), 2021–2035 |
  71. FIGURE 13 Asia-Pacific Low Code Development Platform Market Size (USD Billion), 2021–2035 |
  72. FIGURE 14 South America Low Code Development Platform Market Size (USD Billion), 2021–2035 |
  73. FIGURE 15 Middle East & Africa Low Code Development Platform Market Size (USD Billion), 2021–2035 |
  74. FIGURE 16 Competitive Landscape — Market Share Analysis, 2025 |
  75. FIGURE 17 Competitive Benchmarking Radar Chart — Top 10 Players

Segmentation Quick Reference

DimensionSub-SegmentsDominant SegmentFastest Growing Segment
ComponentPlatform, ServicesPlatform (76.2% share, 2025)Services (25.4% CAGR)
Application TypeWeb-Based, Mobile-BasedWeb-Based (USD 15.87B, 2025)Mobile-Based (24.5% CAGR)
Deployment ModeCloud, On-PremisesCloud (64.5% share, 2025)Cloud (22.76%+ CAGR)
Organization SizeLarge Enterprises, SMEsLarge Enterprises (67.5% share, 2025)SMEs (23.7% CAGR)
Industry VerticalBFSI, Retail & E-Commerce, IT & Telecom, Healthcare, Education, Manufacturing, Government & Public SectorBFSI (28.3% share, 2025)Education (25.7% CAGR)
GeographyNorth America, Europe, Asia-Pacific, South America, Middle East & AfricaNorth America (32.8% share, 2025)Asia-Pacific (22.95% CAGR)


Market Segmentation Overview

By Component

Sub-SegmentKey Trend
PlatformAI copilot integration and drag-and-drop software builder unification driving subscription growth
ServicesCenter-of-excellence consulting and citizen developer platforms training expanding alongside enterprise rollouts


Platform revenue continues to dominate as vendors bundle visual app builder canvases, automation engines, and generative-AI assistants into single subscription tiers. Services spending is growing proportionally faster as organizations formalize governance structures and train non-technical staff on rapid application development.

By Application Type

Sub-SegmentKey Trend
Web-Based DevelopmentEnterprise portals and internal-workflow automation remain the primary use case for no-code development tools
Mobile-Based DevelopmentField-workforce and customer-facing apps driving demand for native mobile rendering and offline-sync capabilities


Web-based applications dominate volume because most citizen developer platforms projects target browser-based internal tools. Mobile-based development is gaining momentum as enterprises equip distributed workforces with purpose-built field apps through visual app builder environments.

By Deployment Mode

Sub-SegmentKey Trend
CloudSaaS subscription models and elastic scalability accelerating adoption across all verticals
On-PremisesSovereign-cloud mandates and data-residency regulations sustaining demand in defense and healthcare


Cloud deployment leads adoption as drag-and-drop software builder platforms migrate to multi-cloud architectures. On-premises installations persist where regulatory frameworks mandate local data hosting.

By Organization Size

Sub-SegmentKey Trend
Large EnterprisesIT-backlog reduction and enterprise-wide digital transformation driving sustained spending
SMEsSubscription-based pricing and no-code development tools democratizing access to rapid application development


Large enterprises allocate the majority of spending to reduce application-request backlogs. SMEs represent the growth frontier as affordable visual app builder solutions eliminate the need for dedicated development teams.

By Industry Vertical

Sub-SegmentKey Trend
BFSIDORA, PSD3, and open-banking mandates compelling rapid application development for compliance workflows
Retail & E-CommerceOmnichannel experience-building and customer-data platform integration
IT & TelecomInternal-tool consolidation and drag-and-drop software builder adoption for operations dashboards
HealthcareEHR-integration portals and patient-engagement apps using citizen developer platforms
EducationCampus-management systems and LMS integration via no-code development tools
ManufacturingShop-floor quality-control and MES-integration applications
Government & Public SectorE-governance portals and citizen-service applications built on visual app builder platforms


BFSI remains the anchor vertical due to regulatory compliance pressure. Education is emerging as the fastest-growing vertical as institutions adopt rapid application development to build student-lifecycle management tools at compressed timelines.


 

Download PDF ×

We do not share your information with anyone. However, we may send you emails based on your report interest from time to time. You may contact us at any time to opt-out.