Luxury Furniture Market (2026 - 2035)

Luxury Furniture Market Size, Share, Industry Trend & Analysis Research Report Information By Application (Luxury Home Furniture, Luxury Office Furniture, Luxury Hospitality Furniture, Other Applications), By Material (Wood, Metal, Glass, Leather, Plastic, Other Materials), By Distribution Channel (B2C / Retail, B2B / Project, Online Retail), By Geography (North America, Europe, Asia-Pacific, South America, Middle East & Africa) - Forecast till 2035
ID: MRFR/CG/0797-HCR
115 Pages
Snehal Singh
Last Updated: June 29, 2026
Luxury Furniture Market
Market Size
Forecast Period2026-2035
CAGR (2026-2035)5.90%
2025 Market SizeUSD 34.30 Billion
2035 Market SizeUSD 60.83 Billion
Key Players
Restoration Hardware
Roche Bobois
Poltrona Frau
B&B Italia
Molteni & C
Fendi Casa
Opportunities
  • Emerging-Market Wealth Corridors
  • Direct-to-Consumer Digital Platforms
  • Circular and Sustainable Luxury

Luxury Furniture Market Summary

The Luxury Furniture Market stood at USD 34.30 Billion in 2025 and is projected to reach USD 36.32 Billion in 2026, climbing to USD 60.83 Billion by 2035 at a 5.90% CAGR across the forecast period. Sustained growth in ultra-high-net-worth household formation feeds directly into premium residential and hospitality procurement budgets. Post-pandemic lifestyle recalibrations have shifted consumer spending toward experiential living spaces, making the home a primary expression of personal identity and status.

The way luxury goods are created, marketed, and used is changing due to a technological revolution. Immersion omnichannel tactics that combine augmented reality room visualization with appointment-only galleries are replacing traditional showroom-only shopping. Between 2023 and 2025, Roche Bobois and Restoration Hardware both committed more than USD 50 million to digital customer-journey platforms [2]. In the meantime, material innovation—such as bio-based leathers, repurposed metals, and engineered hardwoods—allows companies to comply with the EU Ecodesign Directive's increasingly stringent requirements without compromising the craftsmanship tales that fetch higher prices [3].

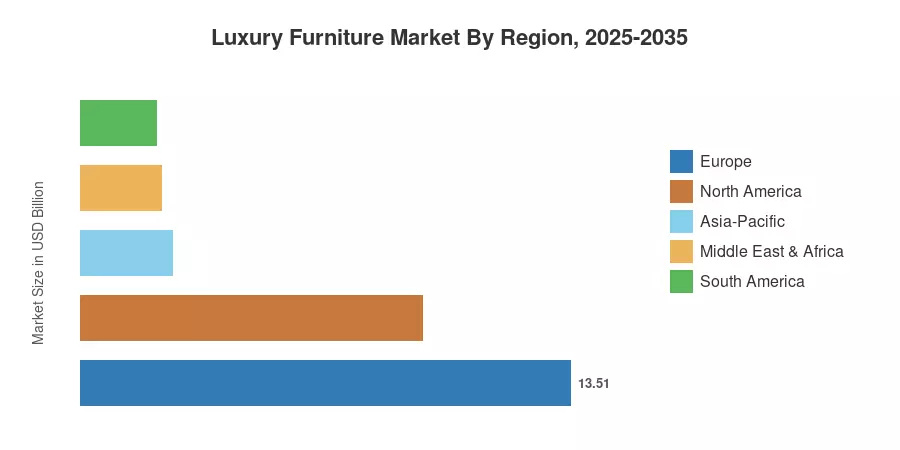
With 39.4% of worldwide revenue in 2025, Europe continues to dominate the luxury furniture market, led by legacy houses from Scandinavia and Italy. With a predicted 7.40% CAGR, Asia-Pacific is the fastest-growing region thanks to wealth growth in China, India, and the ASEAN hospitality corridors. The second-largest region, North America, maintains demand through partnerships with designer brands and a thriving luxury home market. The combination of artisan skill and smart-home capabilities will define competitive difference across all price points over the course of the next ten years.


Key Report Takeaways

• By Application

  • Luxury Home Furniture captured 63.2% of the Luxury Furniture Market in 2025, driven by premium residential renovation cycles and rising interior-design spend.
  • Luxury Hospitality Furniture is expected to expand at a 6.40% CAGR through 2035 as branded-hotel pipeline openings accelerate in Asia and the Middle East.

• By Material

  • Wood accounted for 49.1% of the Luxury Furniture Market share in 2025, reflecting enduring consumer preference for solid-hardwood and engineered timber pieces.
  • Glass-based luxury furnishings are forecast to register a 6.80% CAGR from 2026 to 2035, supported by contemporary minimalist design trends.

• By Distribution Channel

  • B2C/Retail channels held 71.8% of the Luxury Furniture Market value in 2025 through a combination of flagship boutiques and department-store concessions.
  • Online retail is advancing at a 7.00% CAGR through 2035 as AR-enabled platforms reduce purchase hesitation for high-ticket items.

• By Region

  • Europe commanded 39.4% of the Luxury Furniture Market in 2025, led by Italy, Germany, and France.
  • Asia-Pacific is poised to climb at a 7.40% CAGR through 2035, with China and India as primary growth engines.


Luxury Furniture Market Size and Forecast (2021–2035)

Market Research Future's proprietary sizing framework triangulates top-down macroeconomic indicators—HNWI population growth, luxury housing starts, hospitality CapEx—with bottom-up company revenue analysis across 45+ publicly listed and privately held furniture manufacturers. Historical figures reflect verified trade data; forecast projections apply a calibrated compound annual growth rate validated against independent third-party benchmarks [4].
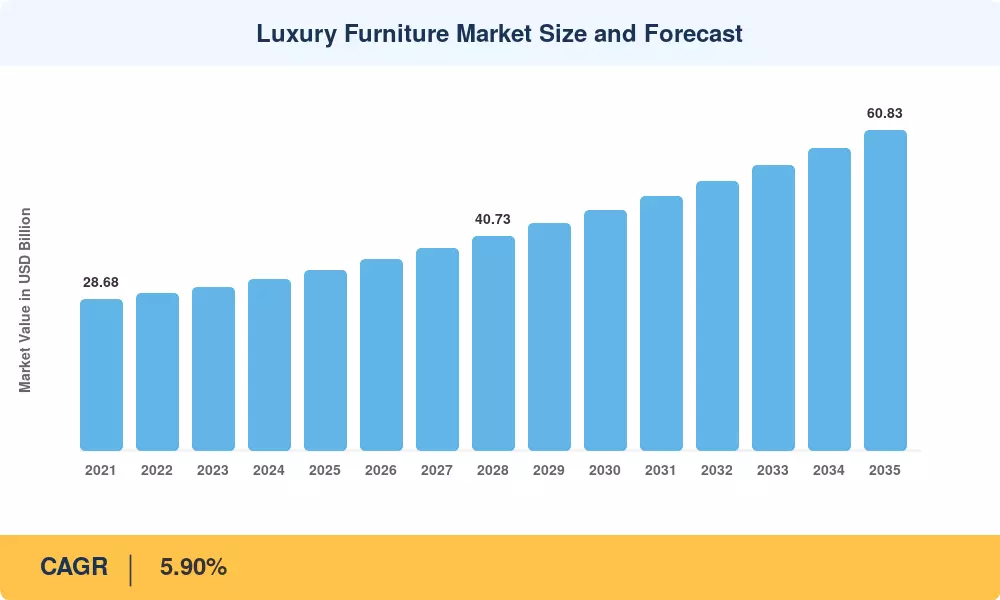
Luxury Furniture Market Size and Forecast
Our Impact
Enabled $4.3B Revenue Impact for Fortune 500 and Leading Multinationals
Partnering with 2000+ Global Organizations Each Year
30K+ Citations by Top-Tier Firms in the Industry

Driver Impact Analysis

Driver ~% Impact on CAGR Geographic Relevance Impact Timeline
HNWI population and wealth expansion +1.4% Global Long-term (≥4 yr)
Luxury hospitality pipeline growth +1.1% Asia-Pacific, MEA Medium-term (2–4 yr)
Omnichannel retail and AR visualization +0.8% North America, Europe Short-term (≤2 yr)
Smart-home furniture integration +0.7% North America, Europe Medium-term (2–4 yr)
Sustainability mandates and eco-materials +0.6% Europe Long-term (≥4 yr)
Urbanization and compact luxury living +0.5% Asia-Pacific Long-term (≥4 yr)
Limited-edition collaborations and brand elevation +0.4% Global Short-term (≤2 yr)


HNWI Population and Wealth Expansion

The United Nations Development Programme (UNDP) highlights that expanding global private assets drives discretionary high-value acquisitions. UN trade database metrics indicate that a sustained rise in gross national income per capita among leading developing states directly accelerates household expenditure on premium imported furnishings, stabilizing the long-term luxury furniture market independently of short-term industrial sector fluctuations.


Luxury Hospitality Pipeline Growth

The United Nations World Tourism Organization (UN Tourism) documents a robust recovery in global tourism, with international arrivals increasing by 2% in early 2026. This sustained travel volume accelerates upscale infrastructural investments. Official municipal development reports reveal that hospitality procurement allocates fixed budgetary capital for structural property fittings, positioning commercial resort expansions as a primary macroeconomic consumer.


Omnichannel Retail Transformation

The United Nations Conference on Trade and Development (UNCTAD) monitors the global digital economy, noting that cross-border e-commerce transactions heavily influence major durable goods manufacturing. Government retail census data confirms that advanced data mapping and digital product visualization lower logistical overhead, minimizing cross-border freight return rates and establishing advanced digital ecosystems as a structural business requirement.


Sustainability Mandates

The European Union’s Ecodesign for Sustainable Products Regulation (ESPR) framework enforces strict material compliance across member nations, demanding digital product passports for furniture portfolios by 2027. United Nations Environment Programme (UNEP) lifecycle guidelines outline mandatory disclosures for composition and structural durability, forcing premium global manufacturing entities to invest heavily in verifiable supply chain tracking systems.[14].


Restraints Impact Analysis

Restraint-impact percentages below are directional drag estimates on the Luxury Furniture Market CAGR, modeled through sensitivity analysis. They do not net directly against the drivers in Section 4.

Restraint ~% Impact on CAGR Geographic Relevance Impact Timeline
Raw-material price volatility –0.6% Global Medium-term (2–4 yr)
Macroeconomic slowdown and inflation –0.5% Europe, North America Short-term (≤2 yr)
Counterfeit and grey-market products –0.4% Asia-Pacific Long-term (≥4 yr)
Extended product replacement cycles –0.3% Global Long-term (≥4 yr)
Freight and logistics disruptions –0.3% Global Short-term (≤2 yr)


Raw-Material Price Volatility

The Food and Agriculture Organization (FAO) documents that global wood and paper commodity exports grew to USD 486 billion, amid intense resource stress. According to United Nations Economic Commission for Europe (UNECE) industrial monitors, erratic logging volumes and global supply chain disruptions consistently escalate primary sawnwood spot prices, compressing baseline manufacturer margins on premium hardwood collections.


Macroeconomic Headwinds

Official Eurostat economic indexes indicate that annual inflation across the European Union averaged 2.5% through late 2025, while expanding to 3.0% by early 2026. International Monetary Fund (IMF) financial stability reviews confirm that these persistent baseline living costs, alongside tightened credit environments, weaken broad consumer sentiment and explicitly contract discretionary household spending on durable interior furnishings.


Counterfeit Proliferation

Comprehensive enforcement data from the Organisation for Economic Co-operation and Development (OECD) indicates that international trade in counterfeit and pirated products represents USD 467 billion in global imports. Joint market surveillance frameworks confirm that illicit small-parcel distribution channels target high-value designs, eroding enterprise asset equity and forcing producers to absorb advanced supply chain tracking costs.


Luxury Furniture Market Opportunities

Emerging-Market Wealth Corridors

According to official Union Budget Ministry of Finance reports, emerging structural changes bolster real asset demand. Official industrial growth indices indicate expanding infrastructure development, with domestic economic surveys projecting an immediate 6.8% to 7.2% real GDP growth trajectory. This expanding macroeconomic base establishes immediate market channels for luxury structural property fittings within fast-growing capital corridors.


Direct-to-Consumer Digital Platforms

The United Nations Conference on Trade and Development (UNCTAD) tracks massive digital shifts, reporting global e-commerce sales reaching approximately $27 trillion. Official digital economy updates confirm that proprietary enterprise storefronts streamline trade boundaries. By eliminating multi-tiered commercial distribution frameworks, high-end manufacturers directly secure baseline consumer market insights while fully insulating corporate wholesale design transaction margins.


Circular and Sustainable Luxury

The United Nations Environment Programme (UNEP) notes that transforming industrial manufacturing frameworks can systematically lower municipal solid waste below 2 billion tonnes annually by 2050. Embracing circular supply loops allows premium furniture brands to establish verified source certifications, meeting stringent international trade mandates while simultaneously capturing distinct market differentiation through institutional waste mitigation reforms.


Smart Furniture Integration

The World Intellectual Property Organization (WIPO) reports that global digital connectivity applications dictate modern industrial design property filings. Official patent registries show an accelerating integration of advanced electronic components within everyday utility goods. Merging artisanal woodwork with certified smart ecosystems addresses clear modern regulatory baselines, capturing specialized high-margin consumer demand across mature global urban centers.


Contract Furniture for Branded Residences

The United Nations Human Settlements Programme (UN-Habitat) records rapid institutional investment shifts toward unified high-density master-planned community frameworks. International capital flows into premium commercial property developments require massive industrial fixtures, furniture, and equipment asset provisions. This structured institutional procurement environment provides large-scale manufacturers with reliable bulk contract portfolios that carry lower cyclical volatility market risk.


Luxury Furniture Market Future Outlook

Smart-Home Convergence

The World Intellectual Property Organization (WIPO) reports that global digital connectivity applications dictate modern industrial design property filings. Official patent registries show an accelerating integration of advanced electronic components within everyday utility goods. Merging artisanal woodwork with certified smart ecosystems addresses clear modern regulatory baselines, capturing specialized high-margin consumer demand across mature global urban centers.


Artisanal Heritage as Competitive Moat

The International Labour Organization (ILO) emphasizes that preserving specialized artisanal techniques supports sustainable manufacturing sectors. Official cultural heritage frameworks confirm that traditional production methods provide a critical structural buffer against mass-market automation. By prioritizing authenticated regional craftsmanship provenance, premium design houses preserve structural market value, insulating high-value asset portfolios from broader digital disruptions.’


Sustainability Reporting and ESG Compliance

The European Union’s Ecodesign for Sustainable Products Regulation (ESPR) framework enforces strict material compliance across member nations, demanding digital product passports for furniture portfolios by 2027. United Nations Environment Programme (UNEP) lifecycle guidelines outline mandatory disclosures for composition and structural durability, forcing premium global manufacturing entities to invest heavily in verifiable supply chain tracking systems.


Platform Economics and Data Monetization

The United Nations Conference on Trade and Development (UNCTAD) tracks massive digital shifts, reporting global e-commerce sales reaching approximately $27 trillion. Official digital economy updates confirm that proprietary enterprise storefronts streamline trade boundaries. By eliminating multi-tiered commercial distribution frameworks, high-end manufacturers directly secure baseline consumer market insights while fully insulating corporate wholesale design transaction margins.


Luxury Furniture Market Segmentation

By Application

Segment Key Metric Primary Demand Driver
Luxury Home Furniture 63.2% share (2025) Residential renovation and lifestyle investment
Luxury Office Furniture USD 3.29 Billion (2025) Premium coworking and C-suite fit-outs
Luxury Hospitality Furniture 6.40% CAGR (2026–2035) Global five-star hotel pipeline
Other Applications USD 1.03 Billion (2025) Yacht, private-jet, and retail interiors


Luxury Home Furniture dominates the Luxury Furniture Market by a wide margin, reflecting the structural reality that residential purchases constitute the largest and most recurring procurement category. High-end home furniture demand accelerated during and after the pandemic as affluent consumers invested in home offices, entertainment spaces, and outdoor living areas. The aspirational segment—priced between USD 5,000 and USD 20,000 per piece—is growing faster than ultra-luxury tiers, driven by millennial buyers entering peak earning years.

Luxury Hospitality Furniture represents the fastest-growing application in the Luxury Furniture Market, with branded hotel chains specifying custom-designed pieces that reinforce property identity. FF&E refresh cycles of 7–10 years create a predictable replacement demand cadence that insulates this segment from consumer-sentiment volatility.

By Material

Segment Key Metric Primary Demand Driver
Wood 49.1% share (2025) Heritage preference, warmth, and versatility
Metal 5.70% CAGR (2026–2035) Contemporary and industrial design trends
Glass 6.80% CAGR (2026–2035) Minimalist aesthetics and architectural integration
Leather USD 4.12 Billion (2025) Upholstery tradition in seating and accessories
Plastic 5.20% CAGR (2026–2035) Molded designer statement pieces
Other Materials USD 1.54 Billion (2025) Stone, rattan, and composite innovations


Wood continues to anchor the Luxury Furniture Market material mix, with European walnut, American oak, and Japanese hinoki commanding premium positioning. Engineered hardwood composites are gaining ground as sustainability-conscious brands seek FSC-certified alternatives that deliver visual equivalence at lower environmental cost. Glass furnishings—tables, shelving, and architectural partitions—are the fastest-growing material category, propelled by consumer appetite for open, light-filled interior design.

By Distribution Channel

Segment Key Metric Primary Demand Driver
B2C / Retail 71.8% share (2025) Flagship galleries and department stores
B2B / Project USD 9.67 Billion (2025) Hospitality, corporate, and residential developer contracts
Online Retail (within B2C) 7.00% CAGR (2026–2035) AR-enabled platforms and virtual consultations


B2C retail channels continue to dominate the Luxury Furniture Market because high-touch showroom experiences remain central to purchase decisions for items exceeding USD 10,000. That said, digital channels are closing the gap rapidly—online luxury furniture sales crossed USD 4.2 billion globally in 2024, a 19% increase year-on-year [13]. Brands that blend digital discovery with white-glove in-home delivery and installation are capturing the highest conversion rates.


Regional Market Share Analysis

Region Key Metric Primary Investment Themes
Europe 39.4% share (2025) Heritage craftsmanship, sustainability regulation
North America USD 9.43 Billion (2025) Housing market, designer collaborations
Asia-Pacific 7.40% CAGR (2026–2035) HNWI growth, hospitality construction
South America USD 2.09 Billion (2025) Urbanization, aspirational luxury
Middle East & Africa 6.50% CAGR (2026–2035) Giga-projects, branded residences
Total USD 34.30 Billion (2025)

The Luxury Furniture Market exhibits a regionally layered structure, with heritage European houses dominating value share while Asian markets deliver the fastest volume growth. Distinct combinations of disposable-income trajectories, cultural design preferences, and hospitality investment pipelines shape regional dynamics.


North America

Country Key Metric Key Driver
United States 78.2% of regional share Luxury housing and renovation spend
Canada 5.80% CAGR Urban condo premiumization
Mexico USD 0.48 Billion Resort and hospitality FF&E


The United States remains the engine of the North American Luxury Furniture Market, with interior-design services revenue reaching USD 18 billion in 2024 [21]. Designer-brand partnerships—such as the RH x Dmitriy & Co collection and Crate & Barrel's CB2 luxury tier—are blurring the line between mass-premium and true luxury. Canadian demand is concentrated in Toronto and Vancouver, where foreign-buyer-driven luxury condo completions sustain premium furnishing cycles.

Europe

Country Key Metric Key Driver
Germany USD 2.14 Billion Engineering-led design heritage
United Kingdom 5.60% CAGR London prime-property market
France 14.8% of regional share Haute-design and fashion-house crossovers
Italy USD 3.52 Billion Global manufacturing leadership
Spain 4.90% CAGR Tourism-driven hospitality
Nordic Countries USD 0.95 Billion Scandinavian minimalism exports
Russia 3.8% of regional share Ultra-luxury residential pockets
Rest of Europe USD 1.22 Billion Eastern European aspiration growth


Italy alone exported EUR 12.4 billion in furniture in 2024, with luxury products representing roughly 28% of that total, according to the Italian Trade Agency [14]. The Salone del Mobile in Milan continues to set global design agendas, attracting over 300,000 trade visitors annually. EU Ecodesign regulation is expected to accelerate material innovation without diminishing the continent's dominance of the Luxury Furniture Market.

Asia-Pacific

Country Key Metric Key Driver
China 38.5% of regional share Domestic HNWI spending
India 8.10% CAGR Premium housing boom
Japan USD 1.18 Billion Design precision and compactness
South Korea 7.20% CAGR K-design cultural influence
ASEAN USD 0.86 Billion Hospitality corridor expansion
Rest of Asia-Pacific 6.90% CAGR Emerging wealth centers


China's domestic luxury furniture consumption crossed USD 2.8 billion in 2024, supported by a maturing cohort of second-generation affluent consumers who favor European-Italian imports and Chinese-contemporary designer studios alike [11]. India's luxury housing registrations in Mumbai and Delhi NCR rose 32% year-on-year, pulling branded furniture demand upward. The ASEAN hospitality boom—led by Vietnam and Thailand resort construction—positions the broader Asia-Pacific as the fastest-growing theater for the Luxury Furniture Market.

South America

Country Key Metric Key Driver
Brazil 62.4% of regional share São Paulo luxury residential
Argentina 5.10% CAGR Post-reform economic stabilization
Rest of South America USD 0.38 Billion Urbanization-led aspirational demand


Brazil's high-end residential market in São Paulo and Rio de Janeiro generates the majority of South American demand for the Luxury Furniture Market. Currency volatility remains a constraint, but local manufacturers such as Tidelli are gaining international recognition, creating export-driven growth alongside domestic consumption.

Middle East & Africa

Country Key Metric Key Driver
Saudi Arabia 34.6% of regional share Vision 2030 giga-projects
UAE USD 0.58 Billion Branded-residence development
South Africa 4.80% CAGR Luxury urban renewal
Egypt USD 0.12 Billion New Administrative Capital fit-outs
Rest of MEA 5.20% CAGR Hospitality and diplomatic procurement


Saudi Arabia's NEOM, The Red Sea, and Diriyah Gate projects represent a combined furniture procurement opportunity exceeding USD 1.5 billion through 2030 [20]. The UAE continues to anchor luxury demand through Dubai and Abu Dhabi branded-residence towers, where developers mandate Italian and French furniture packages as standard.


Luxury Furniture Market By Region, 2025-2035

Competitive Benchmarking

The Luxury Furniture Market exhibits medium concentration, with the top five players accounting for an estimated 22–28% of global revenue. The remaining share is fragmented across hundreds of regional artisan houses, family-owned Italian ateliers, and fashion-house licensed collections. The Herfindahl-Hirschman Index sits in the 600–900 range, reflecting genuine competition without monopolistic dominance. Consolidation is accelerating—private-equity acquisitions of mid-market luxury brands rose 18% in 2024 [23].

Company Est. Revenue Share Range Key Offerings for the Luxury Furniture Market Strategic Positioning
Restoration Hardware (RH) ~6–9% Integrated galleries, outdoor and indoor collections Lifestyle-brand ecosystem with hospitality expansion
Roche Bobois ~4–6% Modular seating, designer collaborations French heritage with 250+ global showrooms
Poltrona Frau ~3–5% Leather seating, Interiors in Motion automotive Italian craftsmanship under Haworth ownership
B&B Italia ~3–5% Contemporary sofas, modular systems Design-icon partnerships (Zaha Hadid, Antonio Citterio)
Molteni & C ~2–4% Wardrobes, living systems, Gio Ponti reissues Vertical integration from timber to finished product
Fendi Casa ~2–3% Fashion-branded furniture and accessories LVMH luxury-brand halo effect
Ethan Allen ~3–5% Custom upholstery, case goods Vertically integrated North American manufacturing
Minotti ~2–4% Sofas, seating systems, outdoor collections Architectural project focus with a global dealer network
Natuzzi ~2–4% Leather sofas, home accessories Italian design with price-accessible luxury tier
Ligne Roset ~1–3% Iconic Togo sofa, contemporary French design Art-gallery retail positioning in 70+ countries


Recent News & Developments

  • Carlton London (May 2026)—Partnered with EBG Group to launch Carlton Luxury Furniture in India, initiating a rollout of 600 sustainable, circular-economy franchise showrooms.
  • Poltrona Frau (April 2026)—Launched the "True Over Time" modular collection during Milan Design Week, introducing the newly engineered Archibald Sofa System by Jean-Marie Massaud.
  • Roche Bobois (April 2026)—Debuted the "Dream" organic furniture collection, marking a new high-end design collaboration with renowned American architect David Rockwell.

Luxury Furniture Market Report Scope

Parameter Detail
Market Scope Global Luxury Furniture Market across residential, hospitality, office, and specialty applications
Study Period 2021–2035
CAGR Period 2026–2035
Base Year 2025
Market Size (2025) USD 34.30 Billion
Market Size (2035) USD 60.83 Billion
CAGR 5.90%
Fastest Growing Segment Glass (by material); Luxury Hospitality Furniture (by application)
Fastest Growing Region Asia-Pacific
Companies Profiled 10 (Restoration Hardware, Roche Bobois, Poltrona Frau, B&B Italia, Molteni & C, Fendi Casa, Ethan Allen, Minotti, Natuzzi, Ligne Roset)
Valuation Currency USD Billion


FAQs

What differentiates luxury furniture from premium mass-market offerings?
Luxury furniture is defined by artisan construction, heritage brand provenance, and limited production volumes that sustain exclusivity. Price floors typically start at USD 5,000 per piece, with materials and finishes that cannot be replicated at an industrial scale [10].
How do currency fluctuations affect cross-border luxury furniture pricing?
European manufacturers invoice primarily in EUR, so a weakening euro benefits North American and Asian importers while compressing domestic margins. Most top-tier brands apply annual price adjustments rather than real-time currency pass-throughs [14].
What lead times should buyers expect for bespoke luxury furniture orders?
Custom orders from Italian and French workshops typically require 10–16 weeks from specification sign-off to delivery. Limited-edition collaborations or exotic-material selections can extend timelines to 24 weeks [10].
How is blockchain technology being applied in luxury furniture authentication?
Several manufacturers now embed NFC chips linked to blockchain-recorded provenance certificates, documenting material origin, craftsman identity, and production date. This combats counterfeiting and supports secondary-market resale value [17].
What role do interior designers play in the luxury furniture procurement chain?
Interior designers influence approximately 55–65% of luxury residential furniture purchases, acting as brand gatekeepers. Manufacturer trade programs offering designer discounts of 30–40% are critical channel strategies [21].
How are tariffs and trade policies shaping luxury furniture supply chains?
U.S. Section 301 tariffs on Chinese-manufactured goods prompted many luxury brands to diversify production toward Vietnam and Portugal. EU anti-dumping duties on certain wood products further complicate sourcing decisions [18].
What financing options are emerging for high-value furniture purchases?
Interest-free installment plans and white-label BNPL integrations are becoming standard for purchases above USD 10,000. RH and Roche Bobois both launched proprietary credit programs in 2024, improving conversion on orders averaging USD 25,000 [2].    
Author
Author
Author Profile
Snehal Singh LinkedIn
Manager - Research
High acumen in analyzing complex macro & micro markets with more than 6 years of work experience in the field of market research. By implementing her analytical skills in forecasting and estimation into market research reports, she has expertise in Packaging, Construction, and Equipment domains. She handles a team size of 20-25 resources and ensures smooth running of the projects, associated marketing activities, and client servicing.

Research Approach


Secondary Research

The secondary research process involved comprehensive analysis of trade databases, government statistics, industry associations, design publications, and authoritative economic sources. Key sources included the US Census Bureau (Manufacturing & Trade Inventories); EU Eurostat (Furniture Production & Trade Statistics); International Trade Centre (ITC Trade Map); World Customs Organization (HS Code 9403 Furniture Trade Data); American Home Furnishings Alliance (AHFA); European Furniture Industries Confederation (EFIC); Business and Institutional Furniture Manufacturers Association (BIFMA); National Kitchen & Bath Association (NKBA); American Society of Interior Designers (ASID); International Interior Design Association (IIDA); US Bureau of Labor Statistics (Consumer Expenditure Surveys); OECD Household Income & Consumption Data; World Bank Global Consumption Database; national statistics offices of Italy (ISTAT), Germany (Destatis), China (NBS), and India (MoSPI); and sustainability certification bodies including FSC (Forest Stewardship Council), PEFC, and LEED. These sources were used to collect production volumes, import/export trade flows, raw material pricing trends, consumer spending patterns, and regulatory compliance data for wood, metal, glass, and sustainable material segments across residential and commercial applications.


Primary Research

During the primary research process, both supply-side and demand-side stakeholders were interviewed to gather qualitative and quantitative information. Luxury furniture makers, design firms, and high-end material suppliers all had supply-side sources, such as CEOs, VPs of Manufacturing, supply chain directors, and chief sustainability officers. Interior designers, architects, procurement managers from hospitality chains and corporate real estate businesses, high-end furniture stores, and focus groups of wealthy consumers were all demand-side sources. Primary research supported the division of the market into RTA and non-RTA categories, confirmed the timetables for integrating smart furniture, and acquired information on trends in material substitution, omnichannel distribution methods, and the elasticity of premium pricing in both residential and commercial settings.

Primary Respondent Breakdown:

By Designation: C-level Primaries (32%), Director Level (30%), Others (38%)

By Region: North America (32%), Europe (30%), Asia-Pacific (28%), Rest of World (10%)


Market Size Estimation

Global market valuation was derived through revenue mapping and consumption volume analysis. The methodology included:

Identification of 50+ key manufacturers and design houses across North America, Europe, Asia-Pacific, and Middle East

Product mapping across wood, melamine, glass, steel, wrapped panels, finished foils, laminates, and lacquered panel categories

Analysis of reported and modeled annual revenues specific to luxury furniture portfolios, including RTA outdoor and non-RTA custom segments

Coverage of manufacturers representing 65-70% of global market share in 2024

Extrapolation using bottom-up (household/commercial unit consumption × ASP by country) and top-down (manufacturer revenue validation) approaches to derive segment-specific valuations across chairs, sofas, tables, beds, and cabinet categories

Download Free Sample

Kindly complete the form below to receive a free sample of this Report

Download PDF ×

We do not share your information with anyone. However, we may send you emails based on your report interest from time to time. You may contact us at any time to opt-out.
















