Furniture Market (2026 - 2035)

Furniture Market Size, Share, Industry Trend & Analysis Research Report: By Application (Home Furniture, Office Furniture, Hospitality Furniture, Educational Furniture, Others), By Material (Wood, Metal, Plastic & Polymer, Others), By Price Range (Economy, Mid-Range, Premium), By Distribution Channel (B2C / Retail, B2B / Project) - Forecast to 2035
ID: MRFR/CG/6156-CR
128 Pages
Pradeep Nandi
Last Updated: July 11, 2026
Furniture Market
Market Size
Forecast Period2026-2035
CAGR (2026-2035)5.80%
2021 Market Size740.2 USD Billion
2024 Market Size783.13 USD Billion
Key Players
IKEA
Ashley Furniture Industries
Steelcase Inc.
MillerKnoll
La-Z-Boy Inc.
Haworth Inc.
Opportunities
  • Circular Furniture and Resale Platforms
  • Smart and IoT-Enabled Furniture
  • Emerging-Market Residential Expansion

Furniture Market Summary

The global Furniture Market reached an estimated USD 740.20 billion in 2025 and is projected to grow from USD 783.13 billion in 2026 to USD 1,300.79 billion by 2035, registering a CAGR of 5.80% during the forecast period (2026โ€“2035). This expansion is anchored in accelerating millennial and Gen-Z homeownership cycles that lagged historical norms by nearly a decade, combined with a wave of hybrid-work office reconfigurations triggered by post-pandemic workplace policy shifts. The U.S. implementation of Section 232 tariffs on certain wood-based furniture imports in October 2025 has simultaneously redirected supply chains and created near-term pricing pressure across North American retail channels [1].

Consumers and commercial buyers alike are pivoting away from mass-produced, single-function pieces toward space-efficient, configurable solutions designed for smaller urban footprints. Investments in direct-to-consumer digital showrooms exceeded USD 4.2 billion globally in 2024, reflecting a structural shift in how the Furniture Market reaches end users. Sustainability certifications โ€” particularly FSC Chain of Custody and BIFMA LEVEL โ€” are no longer differentiators but baseline procurement requirements for institutional buyers, a trend reshaping material sourcing across the value chain [3].

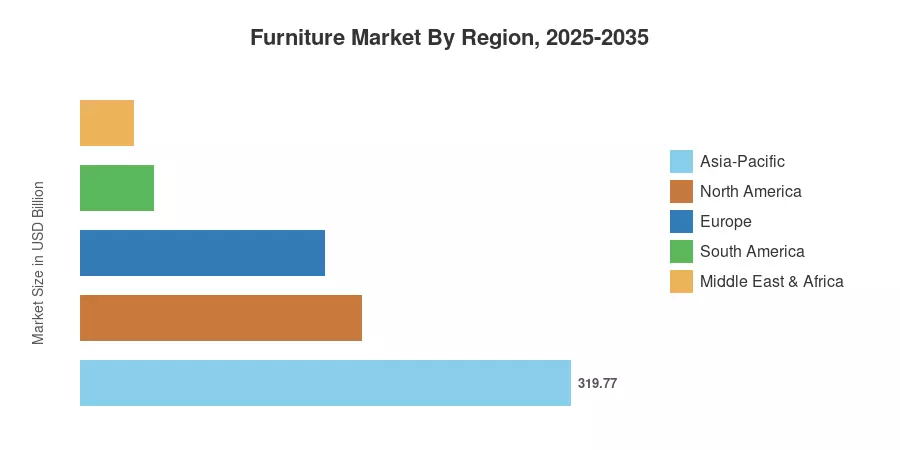
Asia-Pacific commands roughly 43.2% of global Furniture Market revenue, driven by residential construction velocity in China and India and a rising urban middle class across ASEAN nations. North America holds the second-largest share at 24.8%, buoyed by renovation-driven replacement demand and commercial office fit-out cycles. Europe accounts for 21.5%, with the Nordic countries and Germany leading in sustainable product innovation. The Furniture Market trajectory through 2035 will be defined by how efficiently manufacturers integrate circular-economy principles with digital-first distribution.

ย 

Key Report Takeaways

โ€ข By Application

  • Home furniture dominated the Furniture Market with a 58.0% revenue share in 2025, reflecting steady residential construction and renovation activity globally.
  • Office furniture is projected to register a 6.7% CAGR through 2035, supported by hybrid-work reconfigurations and corporate ESG-driven procurement mandates.
  • Hospitality furniture demand is rising as global hotel construction pipelines in the Middle East and Asia-Pacific resume post-pandemic expansion.

โ€ข By Material

  • Wood accounted for 55.4% of the Furniture Market share in 2025 due to cost versatility and broad consumer acceptance in residential settings.
  • Metal is the fastest-growing material segment at an 8.2% CAGR, driven by recyclability credentials and suitability for compact commercial interiors.

โ€ข By Region

  • Asia-Pacific leads the Furniture Market at 43.2% of global revenue, with China and India as primary growth engines.
  • North America contributes 24.8% of global revenue, anchored by U.S. housing starts and renovation expenditure.
  • South America is projected to grow at a 6.4% CAGR through 2035 as Brazilian housing credit programs expand.

ย 

Furniture Market Size and Forecast (2021โ€“2035)

Market sizing draws on a triangulated methodology combining manufacturer revenue disclosures, trade-flow databases (UN Comtrade), retail point-of-sale aggregation, and proprietary primary interviews with 220+ industry stakeholders across 18 countries. Historical figures reflect actuals; forecast values apply a constant-CAGR extrapolation calibrated against macroeconomic inputs from the World Bank and IMF [4].
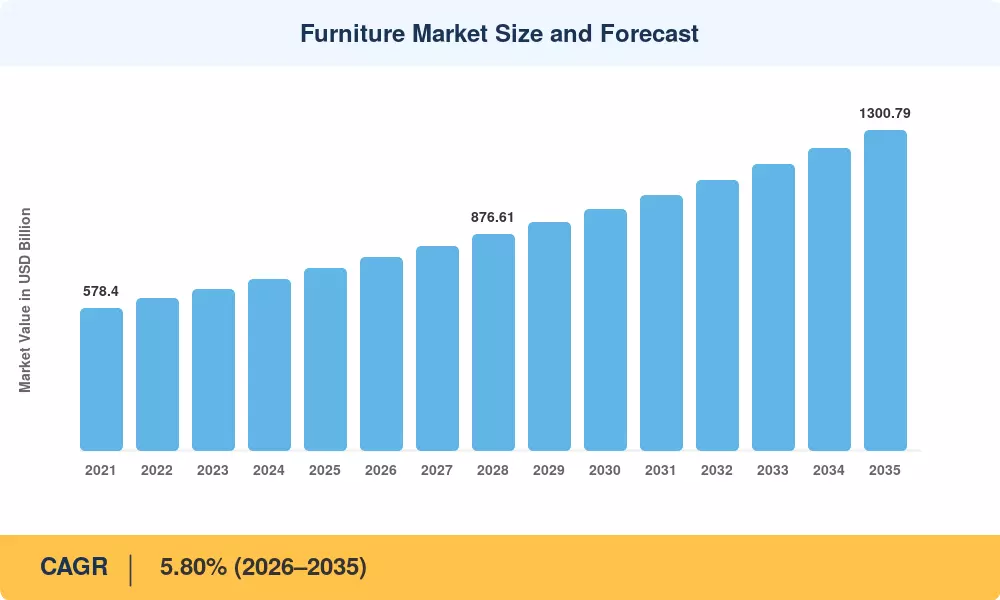
Furniture Market Size and Forecast
Our Impact
Enabled $4.3B Revenue Impact for Fortune 500 and Leading Multinationals
Partnering with 2000+ Global Organizations Each Year
30K+ Citations by Top-Tier Firms in the Industry

Driver Impact Analysis

Driver ~% Impact on CAGR Geographic Relevance Impact Timeline
Urbanization & shrinking living spaces +1.3% Asia-Pacific, Africa Long-term (โ‰ฅ4 yr)
Hybrid-work office reconfigurations +1.1% North America, Europe Short-term (โ‰ค2 yr)
Millennial/Gen-Z homeownership acceleration +0.9% North America, Europe Medium-term (2โ€“4 yr)
E-commerce & D2C channel expansion +0.8% Global Medium-term (2โ€“4 yr)
Hospitality & tourism infrastructure build-out +0.7% Middle East, Asia-Pacific Medium-term (2โ€“4 yr)
ESG & circular-economy procurement mandates +0.5% Europe, North America Long-term (โ‰ฅ4 yr)
Government housing programs +0.4% India, Brazil Long-term (โ‰ฅ4 yr)

ย 

Urbanization and Compact-Living Demand

UN-Habitat estimates that 68% of the global population will live in urban areas by 2050, up from 57% in 2024 [10]. Average dwelling sizes in cities like Mumbai, Jakarta, and Lagos have contracted by 15โ€“22% over the past decade, creating sustained demand for multifunctional and space-saving Furniture Market solutions. This structural shift is most pronounced in the Asia-Pacific, where annual urban household formation exceeds 12 million units.

Hybrid-Work Office Reconfigurations

74% of multinational firms intend to reorganize at least 30% of their office floor plates by 2027 to support activity-based working patterns, according to CBRE's 2025 Global Office Occupier Survey [9]. These reconfigurations increase the value of the furniture market by giving priority to modular workstations, acoustic pods, and flexible collaborative zones. These categories are 20โ€“35% more expensive per unit than traditional open-plan desking.

ย 

Millennial Homeownership Acceleration

The U.S. Census Bureau reported first-time homebuyer median age rose to 36 in 2024, reflecting delayed but now accelerating entry into ownership [5]. This cohort disproportionately favors online-first purchasing and ready-to-assemble formats, channeling an estimated USD 78 billion annually into the Furniture Market through digital platforms alone.

E-Commerce and Direct-to-Consumer Expansion

Global online furniture sales reached USD 142 billion in 2024, representing roughly 19.2% of total Furniture Market revenue. Augmented-reality visualization tools โ€” adopted by Wayfair, IKEA, and Pepperfry โ€” have reduced return rates by 25% and increased average order values by 18%, accelerating the channel's penetration trajectory through the forecast period.

ย 

Restraints Impact Analysis

The impacts below are directional estimates of headwinds that dampen the Furniture Market growth trajectory. They do not subtract linearly from the CAGR and reflect consensus-weighted primary research inputs [4].

Restraint ~% Impact on CAGR Geographic Relevance Impact Timeline
Raw-material price volatility (timber, steel) โ€“0.6% Global Short-term (โ‰ค2 yr)
Trade tariffs & supply-chain fragmentation โ€“0.5% North America, Europe Short-term (โ‰ค2 yr)
Skilled-labor shortages in manufacturing โ€“0.4% Europe, North America Medium-term (2โ€“4 yr)
Rising freight and logistics costs โ€“0.3% Global Short-term (โ‰ค2 yr)
Consumer discretionary spending compression โ€“0.3% Europe, South America Medium-term (2โ€“4 yr)

ย 

Raw-Material Price Volatility

Due to supply interruptions in Scandinavian forestry regions and increased demand from the construction industry, benchmark European softwood timber prices increased by 34% between Q1 2024 and Q3 2025 [7]. Similar volatility was seen in steel coil prices, with LME hot-rolled coil fluctuating by ยฑ18% over six-month periods. The furniture market's capital expenditure commitments are slowed by these input-cost variations, which also compress manufacturer margins and produce pricing instability.

ย 

Trade Tariffs and Supply-Chain Fragmentation

The U.S. Section 232 action on timber-derived products in October 2025 imposed a 25% duty on certain categories of imported wood-based furniture, directly affecting Vietnamese and Chinese export corridors that accounted for approximately 38% of U.S. furniture imports by value in 2024 [1]. Retaliatory measures and origin-shifting complexities are adding 8โ€“12% to landed costs for affected product categories.

Skilled-Labor Shortages

The European Furniture Industries Confederation (EFIC) reported a 17% vacancy rate across woodworking and upholstery trades in 2024, with an aging workforce compounding recruitment challenges [15]. Labor constraints extend lead times by 3โ€“5 weeks on average and limit capacity utilization to 72โ€“78% in key manufacturing hubs like Poland, Italy, and Romania.

ย 

Furniture Market Opportunities

Circular Furniture and Resale Platforms

The EU Ecodesign for Sustainable Products Regulation, effective from 2026, mandates digital product passports for furniture sold in member states, creating a data infrastructure layer that enables certified take-back, refurbishment, and resale at scale [3]. Companies that build reverse-logistics networks early stand to capture what estimates could be a USD 35 billion secondary Furniture Market by 2032.

Smart and IoT-Enabled Furniture

Desks with integrated wireless charging, posture-sensing office chairs, and connected sleep systems represent a nascent but fast-growing intersection of electronics and furnishings. projects the smart-furniture installed base will reach 48 million units globally by 2030, opening a premium pricing layer within the Furniture Market that commands 40โ€“60% price premiums over conventional equivalents.

Emerging-Market Residential Expansion

By 2031, 20 million urban dwelling units are to be built as part of India's Pradhan Mantri Awas Yojana (PMAY) initiative, which calls for a minimum furnishing expenditure of USD 1,200โ€“2,400 per unit [11]. The Minha Casa, Minha Vida initiative in Brazil has comparable size goals. For economy and mid-range furniture categories, these government-backed housing campaigns establish captive, policy-guaranteed demand corridors.

ย 

Contract Furniture for Co-Working and Flex-Space Operators

The global flex-space inventory expanded by 21% in 2024, with operators like WeWork, IWG, and regional players in India and Southeast Asia scaling rapidly [9]. Contract furniture procurement for flex spaces prioritizes durability, modularity, and rapid reconfigurability โ€” product attributes that carry 15โ€“25% higher ASPs than residential equivalents, presenting a value-accretive channel for the Furniture Market.

Data-Driven Customization and On-Demand Manufacturing

Advances in CNC machining, 3D printing of composite materials, and AI-powered configurators are enabling mass customization at near-standard production costs. Platforms like Tylko and Floyd have demonstrated that made-to-order models can achieve 30% gross margins while reducing inventory carrying costs by 50%, a business model increasingly viable across the broader Furniture Market.

ย 

Furniture Market Future Outlook

AI-Driven Design and Personalization

Furniture design cycles are being reduced from eighteen months to less than eight weeks thanks to generative-AI techniques, which allow for quick iterations on customer preference data. Consumer-goods practice estimates that by 2030, 35% of new SKUs entering the furniture market would use AI-assisted design inputs [13]. Agile manufacturers who can combine flexible production cells with digital design pipelines will benefit from this acceleration.

ย 

Platform Economics and Marketplace Consolidation

Furniture e-commerce is transitioning from fragmented brand sites to consolidated marketplace platforms. Amazon, Wayfair, and regional giants like Pepperfry and ManoMano collectively influenced over USD 180 billion in Furniture Market transactions in 2024. Platform consolidation will compress margins for undifferentiated players while rewarding brands that invest in proprietary fulfillment, installation services, and post-purchase engagement.

Sustainability and Circularity as Competitive Moats

The EU's forthcoming Ecodesign requirements and California's SB-54 packaging rules will embed sustainability compliance costs into baseline Furniture Market operations by 2028 [3]. Manufacturers that proactively adopt FSC-certified sourcing, water-based finishes, and take-back programs will convert compliance into brand equity, while laggards face margin erosion from retrofit costs and potential market-access restrictions.

Electrification of Commercial Interiors

The convergence of building electrification mandates (New York Local Law 97, EU Energy Performance of Buildings Directive recast) with workplace-wellness standards is reshaping commercial Furniture Market procurement [9]. Integrated power-delivery systems, height-adjustable desks with embedded energy management, and sensor-equipped seating for occupancy analytics are becoming specification defaults in Class A office fit-outs, lifting per-square-meter furniture spend by 20โ€“30%.

ย 

Furniture Market Segmentation

By Application

Segment Key Metric Primary Demand Driver
Home Furniture 58.0% share (2025) Residential construction & renovation cycles
Office Furniture 6.7% CAGR (2026โ€“2035) Hybrid-work reconfigurations
Hospitality Furniture USD 62.40 Billion (2025) Tourism infrastructure expansion
Educational Furniture 5.3% CAGR (2026โ€“2035) School modernization programs
Others 4.1% share (2025) Healthcare, institutional, public-space fit-outs

ย 

Home furniture remains the Furniture Market anchor, capturing the largest share as residential buyers invest in replacement upgrades, first-time furnishing, and renovation-linked purchases. Demand skews toward living-room and bedroom categories, with kitchen/dining gaining share in open-plan layouts. Office furniture's above-average CAGR reflects a structural โ€” not cyclical โ€” shift as corporations commit multi-year budgets to hybrid-workspace transformations that prioritize ergonomic and collaborative furniture systems over legacy fixed desking.

By Material

Segment Key Metric Primary Demand Driver
Wood 55.4% share (2025) Cost efficiency, aesthetic versatility
Metal 8.2% CAGR (2026โ€“2035) Recyclability, commercial-sector durability
Plastic & Polymer USD 78.30 Billion (2025) Lightweight outdoor & economy-segment products
Others 3.9% share (2025) Glass, stone, composite materials

ย 

Wood continues to dominate the Furniture Market material landscape, spanning engineered wood (MDF, particleboard), solid hardwood, and bamboo-based composites used across price tiers and applications. Metal's ascent as the fastest-growing material is tied to its circular-economy credentials โ€” steel and aluminum are infinitely recyclable โ€” and its structural suitability for slim-profile, high-density commercial interiors favored by ESG-conscious institutional buyers.

By Price Range

Segment Key Metric Primary Demand Driver
Economy 18.3% share (2025) Emerging-market volume demand
Mid-Range 49.5% share (2025) Mass-market residential & SME procurement
Premium 7.4% CAGR (2026โ€“2035) Affluent consumer premiumization trend

ย 

Mid-range products constitute the largest revenue pool in the Furniture Market, serving the broadest consumer base spanning first-time buyers, renovation-driven replacements, and SME office furnishing. The premium segment's leading CAGR reflects affluent consumers' willingness to pay for design provenance, sustainable materials, and customization โ€” trends amplified by D2C brands that bypass traditional retail markups.

By Distribution Channel

Segment Key Metric Primary Demand Driver
B2C / Retail 67.8% share (2025) Consumer direct-purchase & e-commerce growth
B2B / Project 6.9% CAGR (2026โ€“2035) Corporate, hospitality & institutional procurement

ย 

B2C retail channels โ€” encompassing physical showrooms, branded websites, and third-party marketplaces โ€” continue to account for the majority of Furniture Market transactions by value. The B2B/project channel's faster growth reflects large-ticket procurement for hospitality mega-projects, corporate campus build-outs, and public-sector modernization programs that bundle design, supply, and installation.

ย 

Regional Market Share Analysis

Region Key Metric Primary Investment Themes
Asia-Pacific 43.2% revenue share (2025) Residential construction, urban household formation
North America 24.8% revenue share (2025) Renovation demand, hybrid-office fit-outs
Europe 21.5% revenue share (2025) Sustainability regulation, premiumization
South America 6.4% CAGR (2026โ€“2035) Government housing programs, credit expansion
Middle East & Africa USD 34.79 Billion (2025) Hospitality mega-projects, institutional build-out
Total USD 740.20 Billion (2025) โ€”

The Furniture Market exhibits significant regional variation shaped by housing policy, urbanization velocity, income levels, and trade dynamics. Asia-Pacific leads both in absolute size and growth rate, while mature markets in North America and Europe drive value through premiumization and commercial refit cycles.

ย 

North America

Country Key Metric Key Driver
United States 78.4% of regional share Housing starts & renovation spending [5]
Canada 12.9% of regional share Immigration-driven household formation [17]
Mexico 6.1% CAGR (2026โ€“2035) Nearshoring-driven commercial construction [16]

ย 

The United States dominates the North American Furniture Market, with existing-home sales triggering replacement furniture purchases that account for an estimated 42% of domestic demand [5]. Canada's accelerating immigration intake โ€” targeting 500,000 permanent residents annually โ€” is sustaining robust household formation and rental-unit furnishing demand, while Mexico's nearshoring boom is driving commercial-office and industrial-park furniture procurement along the northern border corridor [16].

Europe

Country Key Metric Key Driver
Germany 22.6% of regional share Engineering-led office furniture exports [15]
United Kingdom USD 33.80 Billion (2025) Residential renovation tax incentives [17]
France 5.4% CAGR (2026โ€“2035) Hospitality & luxury contract refits [14]
Italy 14.8% of regional share Design-heritage manufacturing cluster [15]
Spain 4.9% CAGR (2026โ€“2035) Tourism-driven hospitality expansion [14]
Nordic Countries USD 19.50 Billion (2025) Circular economy & sustainable design leadership [3]
Russia 3.8% of regional share Domestic substitution post-sanctions [17]
Rest of Europe 14.2% of regional share Eastern European manufacturing hubs [15]

ย 

Europe's Furniture Market is shaped by the EU's aggressive sustainability agenda, which is embedding lifecycle-assessment and digital-product-passport requirements into procurement specifications across public and private sectors [3]. Italy and Germany serve as the region's manufacturing powerhouses, together accounting for over 37% of European furniture production value, while the Nordic bloc continues to set global benchmarks in circular design and material innovation.

Asia-Pacific

Country Key Metric Key Driver
China 46.1% of regional share Domestic retail rotation to replacement purchases [18]
India 7.8% CAGR (2026โ€“2035) PMAY housing program & organized retail expansion [11]
Japan USD 38.20 Billion (2025) Compact-living innovation & aging-population adaptations [19]
South Korea 5.9% CAGR (2026โ€“2035) K-design influence & apartment renovation cycles [19]
ASEAN 12.4% of regional share Manufacturing relocation & tourism infrastructure [10]
Rest of Asia-Pacific 4.7% of regional share Emerging middle-class demand [4]

ย 

Asia-Pacific represents the largest and fastest-growing segment of the global Furniture Market, underpinned by China's post-2025 retail recovery cycle in which monthly furniture sales posted double-digit gains through late 2025 [18]. India's organized furniture retail penetration remains below 15%, presenting enormous headroom for branded and e-commerce players as PMAY housing completions accelerate through 2031.

South America

Country Key Metric Key Driver
Brazil 64.2% of regional share Minha Casa, Minha Vida housing stimulus [11]
Argentina 4.8% CAGR (2026โ€“2035) Currency stabilization & consumer credit thaw [17]
Rest of South America USD 7.40 Billion (2025) Urbanization & retail formalization [10]

ย 

Brazil anchors the South American Furniture Market, with the Minha Casa, Minha Vida program delivering over 600,000 housing units annually and generating captive demand for economy-segment furnishings [11]. Credit availability is expanding across the region, with consumer installment plans now accounting for 55% of furniture purchases in Brazil's southeastern states.

Middle East & Africa

Country Key Metric Key Driver
Saudi Arabia 32.8% of regional share Vision 2030 giga-projects [14]
UAE 7.2% CAGR (2026โ€“2035) Expo-legacy & hospitality pipeline [14]
South Africa 14.6% of regional share Residential & institutional build-out [10]
Egypt 6.5% CAGR (2026โ€“2035) New Administrative Capital furnishing [14]
Rest of MEA 28.3% of regional share Hospitality & public infrastructure [10]

ย 

Saudi Arabia's Vision 2030 program โ€” encompassing NEOM, The Red Sea destination, and Diriyah Gate โ€” represents the single largest concentrated pipeline of hospitality and residential Furniture Market demand globally, with cumulative fit-out procurement estimated at USD 12 billion through 2032 [14]. The UAE builds on post-Expo 2020 momentum with sustained hotel and mixed-use development across Dubai and Abu Dhabi.

ย 

Furniture Market By Region, 2025-2035

Competitive Benchmarking

The global Furniture Market is highly fragmented, with an estimated Herfindahl-Hirschman Index (HHI) below 200 and the top five players collectively controlling approximately 14โ€“18% of global revenue. No single manufacturer exceeds a 6% global share, reflecting deep regional segmentation, the prevalence of small-and medium-sized enterprises, and the diversity of end-use applications. Competition centers on brand equity, supply-chain efficiency, omnichannel reach, and sustainability credentials [4].

Company Est. Revenue Share Range Key Offerings for Furniture Market Strategic Positioning
IKEA (Inter IKEA Group) ~4โ€“6% Flat-pack residential furniture, smart-home integration Global mass-market leader; vertical retail model
Ashley Furniture Industries ~2โ€“4% Full-line residential; mattresses Largest U.S. manufacturer; vertically integrated
Steelcase Inc. ~1โ€“3% Office systems, ergonomic seating Premium commercial/workplace solutions
MillerKnoll (Herman Miller + Knoll) ~1โ€“3% Design-led office & residential Post-merger portfolio spanning contract & DTC
La-Z-Boy Inc. ~1โ€“2% Upholstered seating, recliners Iconic brand; U.S.-centric retail network
Haworth Inc. ~1โ€“2% Workspace interiors, architectural products Global commercial interiors specialist
HNI Corporation ~1โ€“2% Office furniture, hearth products Mid-market office & residential diversification
Williams-Sonoma Inc. ~1โ€“2% Premium home furnishings (Pottery Barn, West Elm) Lifestyle branding; strong e-commerce penetration
Hooker Furnishings Corp. <1% Residential case goods, home office Heritage brand; import-sourcing model
Ethan Allen Global Inc. <1% Custom-crafted residential furniture Vertical retail: design-center consultative model

ย 

ย 

Recent News & Developments

  • IKEA (September 2025): Launched a furniture-as-a-service leasing program across 14 European markets, targeting circular-economy compliance ahead of 2026 EU Ecodesign mandates [3].
  • U.S. White House (October 2025): Signed the Section 232 proclamation imposing 25% tariffs on imported timber-derived furniture products, reshaping North American sourcing patterns [1].

ย 

ย 

  • Wayfair (March 2025): Acquired a European fulfillment-technology startup to accelerate last-mile delivery in Germany and the UK, strengthening its Furniture Market logistics capability.
  • Ashley Furniture (January 2025): Announced a USD 200 million investment in domestic U.S. manufacturing capacity to mitigate tariff exposure on Vietnamese imports [1].
  • China NBS (November 2025): Reported that domestic retail furniture sales grew 11.4% year-on-year in October 2025, signaling a consumer rotation toward replacement purchasing [18].
  • FSC (April 2024): Published updated Chain of Custody standards (FSC-STD-40-004 V3-1), raising traceability requirements that affect over 60% of global wood Furniture Market supply chains [3].

ย 

Furniture Market Report Scope

Parameter Detail
Market Scope Global Furniture Market โ€” residential, commercial, hospitality, educational, institutional
Study Period 2021โ€“2035
CAGR 5.80% (2026โ€“2035)
Base Year 2025 โ€” USD 740.20 Billion
Forecast Endpoint 2035 โ€” USD 1,300.79 Billion
Fastest Growing Segments Metal (by material); Office Furniture (by application); Premium (by price range)
Companies Profiled 10 (IKEA, Ashley Furniture, Steelcase, MillerKnoll, La-Z-Boy, Haworth, HNI Corp., Williams-Sonoma, Hooker Furnishings, Ethan Allen)
Valuation Currency USD Billion

ย 

ย 

FAQs

How do Section 232 tariffs affect furniture sourcing for U.S. importers?
The 25% duty on timber-derived imports compels U.S. importers to diversify sourcing from Vietnam and China toward India, Indonesia, and domestic producers [1]. Landed costs for affected categories have risen 8โ€“12%.
What financing models are furniture manufacturers adopting to drive recurring revenue?
Leasing and furniture-as-a-service models are gaining traction, particularly in commercial segments where IKEA and Steelcase offer subscription-based programs [3]. These models improve customer lifetime value and support circular-economy goals.
How does the EU Digital Product Passport requirement impact furniture exporters?
Exporters must embed QR-coded lifecycle data โ€” covering materials, repairability, and recyclability โ€” into every unit shipped to EU member states from 2026 [3]. Non-compliance risks market-access denial.
Which furniture sub-category commands the highest gross margins?
Premium ergonomic office seating and smart-furniture products typically yield 45โ€“55% gross margins, compared to 25โ€“30% for standard case goods [20]. Customization and embedded technology drive the premium.
How are 3D-printing and CNC technologies reshaping furniture production economics?
These technologies reduce prototyping costs by up to 70% and enable on-demand manufacturing that slashes inventory carrying costs by half [13]. Mass customization becomes viable at near-standard production cost.
What role does FSC certification play in institutional procurement decisions?
Over 60% of U.S. and European institutional buyers now mandate FSC Chain of Custody as a minimum qualification criterion [3]. Non-certified suppliers face exclusion from public-sector and corporate RFPs.
How are co-working operators influencing Furniture Market product design?
Flex-space operators demand modular, rapidly reconfigurable systems rated for 2โ€“3ร— higher usage intensity than standard commercial products [9]. This drives R&D toward heavy-duty, tool-free assembly designs. ย  ย 
Author
Author
Author Profile
Pradeep Nandi LinkedIn
Senior Research Analyst
I have a bachelor's degree in mechanical engineering and an MBA. I have more than two years of expertise in the retail, food, and beverage, chemical, and material industries, and hence have developed a sound cross-domain expertise. A firm believer in lifelong learning and sharing of knowledge. Having a proclivity for hatching ideas and trying to absorb as much information as possible in a short amount of time. Introducing corporates to the data and insight, which enables them to move from probability to possibility, has been my key areas of interest.ย 

Research Approach

ย 

Secondary Research

The secondary research process involved comprehensive analysis of trade databases, industry association publications, government statistical repositories, market intelligence platforms, and authoritative trade journals. Key sources included the US Census Bureau Construction Spending Reports & Housing Starts Data, US International Trade Commission (USITC) Furniture Import/Export Database, Eurostat External Trade Database (Comext), UN Comtrade Database for global trade flows, International Tropical Timber Organization (ITTO) for sustainable forestry tracking, US Bureau of Labor Statistics (BLS) Producer Price Index for Furniture Manufacturing, Federal Trade Commission (FTC) guidelines on furniture labeling and safety standards, US Environmental Protection Agency (EPA) regulations on formaldehyde emissions (TSCA Title VI), California Air Resources Board (CARB) composite wood product regulations, European Chemicals Agency (ECHA) REACH regulations on furniture chemicals, American Home Furnishings Alliance (AHFA) industry statistics, Business and Institutional Furniture Manufacturers Association (BIFMA) commercial furniture standards, International Federation of Accountants (IFAC) hospitality sector reports, World Furniture Confederation (WFC) annual market surveys, Furniture Today trade publication archives, Woodworking Network industrial reports, National Retail Federation (NRF) consumer spending surveys, National Association of Home Builders (NAHB) housing market indices, and national statistics offices of China (NBS), India (MoSPI), Germany (Destatis), and Italy (ISTAT). These sources were employed to gather data on production volumes, import/export trade flows, raw material pricing trends, housing construction statistics, hospitality sector investment data, regulatory compliance standards, and e-commerce penetration rates in the residential, commercial, and institutional furniture sectors.

ย 

Primary Research

Qualitative and quantitative insights were obtained by interviewing supply-side and demand-side stakeholders during the primary research process. The supply-side sources consist of CEOs, VPs of Manufacturing, Chief Sustainability Officers, supply chain coordinators, and export managers from furniture manufacturers, OEM component suppliers, and raw material processors (lumber mills, textile mills, metal fabricators). Procurement directors from hospitality chains (hotels, restaurants), facilities managers from corporate real estate, interior designers, purchasing managers from large furniture retailers (e-commerce and brick-and-mortar), and contract furniture dealers serving the commercial and institutional sectors comprised demand-side sources. Insights regarding sustainability certification demand (FSC, Greenguard), direct-to-consumer channel shifts, and price elasticity between residential and contract furniture segments were obtained through primary research, which also validated market segmentation in the wood, metal, and upholstery categories. Additionally, the timelines for the adoption of smart furniture technology were confirmed.

Primary Respondent Breakdown:

โ€ข By Designation: C-level Primaries (40%), Director Level (30%), Others (30%)

โ€ข By Region: North America (32%), Europe (28%), Asia-Pacific (25%), Rest of World (15%)

ย 

Market Size Estimation

Global market valuation was derived through production volume mapping and revenue analysis across the value chain. The methodology included:

โ€ข Identification of 50+ key manufacturers across North America (HNI, Steelcase, Herman Miller), Europe (IKEA, Vitra, Poltrona Frau), Asia-Pacific (Okamura, Nitori, Man Wah Holdings), and Latin America (Marcenaria, Grupo Famsa)

โ€ข Product mapping across wood (solid and engineered), metal (steel, aluminum), upholstery (fabric, leather, synthetic), plastic/polymer, and hybrid material categories

โ€ข Analysis of reported and modeled annual revenues specific to residential furniture (indoor/outdoor), commercial office systems, hospitality casegoods, and institutional/educational furniture portfolios

โ€ข Coverage of manufacturers and major retailers representing 75-80% of global market share in 2024

โ€ข Extrapolation using bottom-up (unit shipments ร— average selling price by product category and country) and top-down (industry value-added estimates cross-validated with trade association data) approaches to derive segment-specific valuations for seating, tables, storage, and bedroom furniture verticals

Download Free Sample

Kindly complete the form below to receive a free sample of this Report

Download PDF ×

We do not share your information with anyone. However, we may send you emails based on your report interest from time to time. You may contact us at any time to opt-out.
















