Office Furniture Market (2026 - 2035)

Global Office Furniture Market Size, Share, Industry Trend & Analysis Research Report: By Product Category (Seating (Chairs), Desks & Tables, Storage Units, Systems & Modular Workstations, Partitions & Accessories), By Material (Wood & Wood Panels, Metal, Plastic & Polymers, Glass & Composites, Textiles & Upholstery Systems), By Price Range (Economy, Mid-Range, Premium), By End User (Corporate Offices, Government & Public Sector, Education & Institutional, Healthcare, Hospitality & Retail Back-Office), By Distribution Channel (B2B Direct-from-Manufacturer, B2B Dealer & Contract Networks, B2C Retail & Online), By Geography (North America, Europe, Asia-Pacific, South America, Middle East & Africa) - Forecast to 2035

Forecast Period
2026-2035
CAGR
7.65%
2025 Market Size
USD 83.60 Billion
2035 Market Size
USD 171.64 Billion
Consumer and Retail ● Updated August 26, 2026 Report ID: MRFR/CG/10998-HCR | Pages: 128 | Author: Pradeep Nandi

Office Furniture Market Summary

The Office Furniture Market closed 2025 at USD 83.60 billion and enters the forecast window at USD 88.40 billion in 2026, tracking toward USD 171.64 billion by 2035 at a 7.65% CAGR. Two catalysts anchor that trajectory. The U.S. General Services Administration's consolidation program has pushed federal agencies into dense, reconfigurable floorplates, releasing multi-year fit-out tenders [1]. In parallel, the European Union's Ecodesign for Sustainable Products Regulation brought furniture into scope for durability and recyclability requirements, forcing manufacturers to redesign catalogues rather than simply recertify them [2].

Legacy fixed-panel cubicle systems, bolted-in benching, and static filing walls are being stripped out and replaced by demountable partitions, power-and-data-integrated tables, and sensor-equipped desks that report occupancy back to building management platforms. Corporate real estate teams now spend heavily on this swap because they are paying for fewer square feet per employee and need each seat to work harder. JLL's fit-out benchmarking places global average furniture spend near USD 76 per square foot in premium builds, a line item that has resisted the broader capex squeeze [3]. That resilience underpins the Office Furniture Market through the softest years of the office cycle.

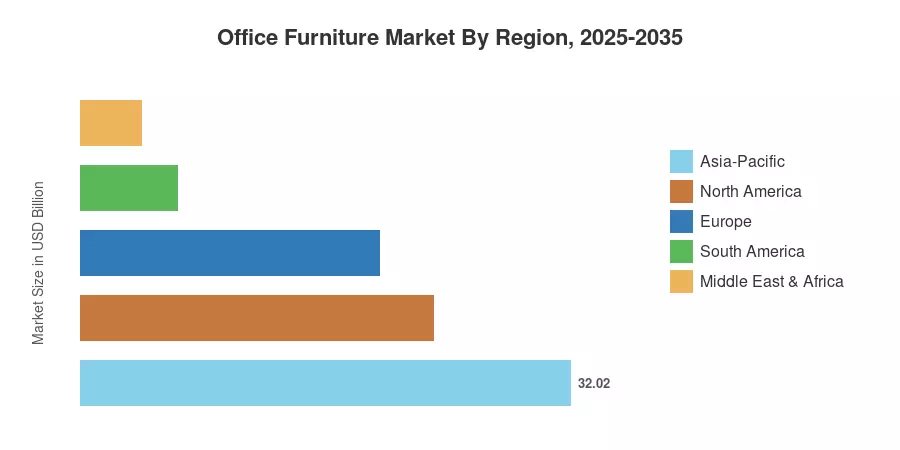
Regionally, Asia-Pacific commands 38.30% of 2025 revenue and simultaneously grows fastest at 7.90% through 2035, an unusual double lead driven by Grade-A construction in China, India, and ASEAN. North America follows as the second-largest region on 27.60% share, where demand is renovation-led rather than new-build. Buyers should expect the next decade to reward manufacturers who can prove material provenance as convincingly as they can quote lead times.


Key Report Takeaways

• By Product Category

  • Seating led the Office Furniture Market with a 29.20% revenue share in 2025
  • Systems and modular workstations are forecast to expand at an 8.55% CAGR through 2035
  • Storage units generated USD 14.88 billion in 2025

• By End User & Distribution Channel

  • Corporate offices accounted for 38.90% of the Office Furniture Market in 2025
  • Hospitality and retail back-office demand is projected to grow at a 7.60% CAGR
  • B2C retail and online channels are advancing at an 8.45% CAGR through 2035

• By Region

  • Asia-Pacific held 38.30% of global revenue in 2025
  • North America contributed USD 23.07 billion in 2025
  • Middle East & Africa is expanding at a 7.85% CAGR, the second-fastest regional pace


Market Size and Forecast (2021–2035)

Estimates blend audited revenue disclosures from listed contract manufacturers, association shipment data from BIFMA and FEMB, national furniture trade statistics, and primary interviews with dealer principals and corporate real estate leads across 14 countries [4][5]. Historical years are reconciled bottom-up against installed-base fit-out activity; forecast years apply category-level elasticity to committed construction pipelines and lease-expiry schedules.
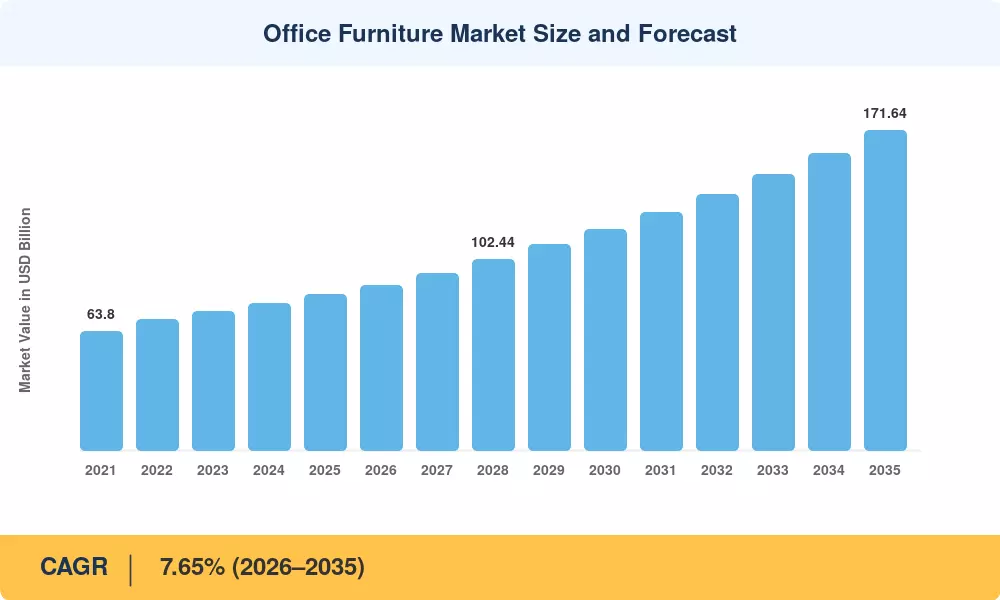
Office Furniture Market Size and Forecast
Our Impact
Enabled $4.3B Revenue Impact for Fortune 500 and Leading Multinationals
Partnering with 2000+ Global Organizations Each Year
30K+ Citations by Top-Tier Firms in the Industry

Driver Impact Analysis

Driver ~% Impact on CAGR Geographic Relevance Impact Timeline
Hybrid-work floorplate reconfiguration +1.45 pp Global; NA and Europe lead Short-term (≤2 yr)
Asia-Pacific Grade-A construction pipeline +1.35 pp Asia-Pacific Long-term (≥4 yr)
Occupational health and ergonomics regulation +1.10 pp Europe, North America Medium-term (2–4 yr)
Sustainability and embodied-carbon procurement +0.95 pp Europe, North America Medium-term (2–4 yr)
Technology-integrated desking and AV rooms +0.80 pp Global Medium-term (2–4 yr)
Public-sector and giga-project fit-out programs +0.70 pp MEA, Asia-Pacific Long-term (≥4 yr)
Flexible-space operator expansion +0.60 pp Global Short-term (≤2 yr)


Hybrid-Work Floorplate Reconfiguration

Occupiers are not shrinking quietly; they are rebuilding. CBRE's occupier survey found that 61% of large corporates plan to redesign existing space rather than relocate, and roughly half expect to increase spend per square foot even while cutting total footprint [6]. That trade — less area, richer specification — is the single most reliable revenue mechanism in the Office Furniture Market today, because it converts a real estate contraction into a furniture replacement event. Collaboration zones, enclosed focus pods, and touchdown benches all carry higher unit values than the open-plan desks they displace.

Asia-Pacific Construction Pipeline

Delivery volumes in the region dwarf Western activity. India alone absorbed more than 70 million square feet of Grade-A office space in 2024, with Bengaluru, Hyderabad, and Pune accounting for the majority of global capability centre expansion [12]. New buildings furnish at full density from day one, which is why regional revenue growth outpaces the global average by nearly 25 basis points annually.

Ergonomics and Occupational Health Regulation

Europe's regulatory floor keeps rising. The EU Display Screen Equipment framework and national implementations such as Germany's ArbStättV oblige employers to provide adjustable seating and work surfaces, and enforcement inspections have increased in several member states [7]. Musculoskeletal disorders still account for roughly a fifth of lost working days across the bloc, giving finance teams a quantifiable payback case for higher-specification task chairs [8].

Sustainability and Embodied-Carbon Procurement

Buyers now ask for numbers, not adjectives. The World Green Building Council's push toward whole-life carbon accounting has pulled furniture into scope-3 reporting for major occupiers, and Environmental Product Declarations have shifted from differentiator to entry ticket in European public tenders [9]. Manufacturers holding verified declarations across a majority of SKUs report measurably shorter tender cycles.


Restraints Impact Analysis

Restraint weightings are directional drag estimates derived from the same modelling framework. They quantify relative headwind severity within the Office Furniture Market and are not subtractive line items against the headline growth rate.

Restraint ~% Impact on CAGR Geographic Relevance Impact Timeline
Structural office vacancy and lease downsizing −0.95 pp North America Medium-term (2–4 yr)
Steel and aluminium input cost inflation −0.85 pp NA, Europe Short-term (≤2 yr)
Ocean freight volatility on bulky cargo −0.55 pp Global Short-term (≤2 yr)
Refurbished and secondary-market supply −0.45 pp Europe, North America Long-term (≥4 yr)
Dealer economics and installation labour shortage −0.40 pp NA, Europe Medium-term (2–4 yr)


Structural Vacancy in North America

Vacancy remains the hardest ceiling on Western demand. National office availability held above 19% through 2025, with several downtown submarkets above 25%, and empty floors do not order furniture [10]. Landlords are converting some inventory to residential use, which permanently removes seat count from the addressable base. Renovation intensity partially offsets the loss, but it cannot fully replace greenfield absorption.

Input Cost Inflation from Metals Policy

Tariff acts on steel and aluminum have repriced frames, bases & filing carcasses. US Sec 232 taxes increased to 50% on covered imports over 2025 . Derivative-product expansions included components manufacturers had previously sourced duty-free [17]. Contract pricing is generally locked for 90-180 days, so margin compression happens before list price modifications catch up. Several producers have responded by dual-sourcing regionally instead of absorbing the disparity.


Refurbished Supply and Circular Competition

Circularity is a two way street. Take-back programs and remanufacturing facilities now return huge volumes of near-new inventory to the market at 40-60% of list, particularly in London, Amsterdam and the US Northeast [9]. This channel is increasingly used by incumbents to retain brand and specification control, but also demonstrably substitutes for new unit sales in cost sensitive tenders.


Office Furniture Market Opportunities

Furniture-as-a-Service for Flexible Operators

Subscription and rental models convert the capital acquisition into an ongoing expense, which is a good fit for coworking operators and scale-up tenants signing 24-month contracts. Providers realize residual value through refurbishing cycles and secure multi-year revenue visibility. [11] Northern European early adopters cite attach rates of above 30% for tenants under 5,000 sq. ft.


Demountable Architectural Interiors

Movable walls straddle the border between construction and furniture and in some countries are classified as depreciable equipment rather than leasehold improvement, a tax benefit occupiers are increasingly taking advantage of. Modular office design principles mean that a floor can be altered over a weekend without a permit – just what tenants on short leases need.


India, ASEAN, and Emerging-Market Depth

Manufacturers with local assembly in Vietnam, Indonesia, and India avoid both tariff exposure and freight drag while serving the fastest-expanding demand pool. Government capability-centre incentives and state-level industrial policy continue to pull multinational back-office functions into the region [12].

Occupancy Data Monetization

Sensor-equipped desks and chairs generate utilization telemetry that corporate real estate teams will pay for on a recurring basis. Manufacturers that package this data into portfolio dashboards move from a one-time hardware sale to an annuity relationship, and the resulting utilization evidence often justifies the next hardware refresh [5].

Healthcare and Education Institutional Refresh

Public institutional buyers refresh on fixed cycles largely insulated from commercial property sentiment, and infection-control and accessibility standards are tightening specification requirements. Both factors raise average selling prices in segments that competitors often under-serve [15].


Office Furniture Market Future Outlook

Sensor-Native Workplaces

By the early 2030s, the assumption will invert: furniture without embedded telemetry will be the exception. Desks and chairs already report occupancy, adjustment behaviour, and dwell time into building management platforms, and the International Energy Agency's building-efficiency work identifies occupancy-responsive control as one of the cheapest routes to operational carbon reduction in commercial stock [13]. Furniture becomes a data endpoint, not just an asset.

Consolidation and Platform Scale

HNI Corporation's agreement to acquire Steelcase signals where the industry is heading — scale to absorb input volatility and to serve global accounts through a single contract [19]. Expect further roll-ups among mid-tier dealers, since installation and service networks are now the genuine moat rather than manufacturing capacity.

Embodied Carbon as a Pricing Variable

Whole-life carbon accounting will move from voluntary reporting into procurement scoring across most OECD markets. Manufacturers holding verified declarations and credible material traceability should command a measurable premium, while those without will find themselves excluded from tender shortlists entirely [9].

Circular Business Models at Scale

Take-back, refurbishment, and resale will mature from pilot programmes into structured revenue lines. Producers that control the secondary channel capture residual value instead of ceding it to independent refurbishers, and the model aligns neatly with the subscription structures gaining ground among flexible-space operators [11].


Office Furniture Market Segmentation

By Product Category

Product mix within the Office Furniture Market is anchored by seating, which carries both the highest unit volume and the strongest regulatory tailwind.

Segment Metric Primary Demand Driver
Seating (Chairs) 29.20% share (2025) Ergonomics compliance and replacement cycles
Desks & Tables USD 22.15 Billion (2025) Height-adjustment and power integration
Storage Units USD 14.88 Billion (2025) Locker-based hot-desking infrastructure
Systems & Modular Workstations 8.55% CAGR (2026–2035) Reconfigurable floorplate demand
Partitions & Accessories 10.60% share (2025) Acoustic zoning in open plans


Seating stays dominant because it is the one category where a documented health obligation forces replacement irrespective of real estate sentiment. Systems and modular workstations grow fastest for a different reason: tenants signing shorter leases will not pay for anything they cannot move. Desks are the interesting middle case — sit-stand workstations have moved from executive perk to baseline specification in Northern Europe and increasingly in North American Class A buildings, lifting average selling prices even as unit counts flatten [7].

By Material

Material choice in the Office Furniture Market is now a compliance decision as much as an aesthetic one.

Segment Metric Primary Demand Driver
Wood & Wood Panels 42.00% share (2025) Warm aesthetics and FSC-certified supply
Metal 8.10% CAGR (2026–2035) Recyclability and structural durability
Plastic & Polymers USD 12.71 Billion (2025) Cost efficiency in economy tiers
Glass & Composites 8.40% share (2025) Executive and meeting-room specification
Textiles & Upholstery Systems 5.80% share (2025) Acoustic performance requirements


Wood retains the largest share on aesthetic preference and certified-supply availability, but metal is growing faster because it disassembles cleanly and carries a credible recycled-content story — precisely what circular procurement scoring rewards [9]. Tariff exposure works against metal on cost, creating a genuine tension buyers must resolve tender by tender.

By Price Range

Segment Metric Primary Demand Driver
Economy 44.90% share (2025) Volume public and SME procurement
Mid-Range USD 28.93 Billion (2025) Corporate standard specification
Premium 9.20% CAGR (2026–2035) Executive floors and flight-to-quality fit-outs


Economy holds the largest share on unit volume, particularly across Asia-Pacific and institutional tenders. Premium grows fastest as occupiers concentrate spend into smaller, higher-specification footprints — the direct financial consequence of the density trade described earlier [6].

By End User

Segment Metric Primary Demand Driver
Corporate Offices 38.90% share (2025) Hybrid reconfiguration cycles
Government & Public Sector USD 15.38 Billion (2025) Scheduled refresh mandates
Education & Institutional 16.20% share (2025) Campus modernization funding
Healthcare 7.40% CAGR (2026–2035) Infection-control specification upgrades
Hospitality & Retail Back-Office 7.60% CAGR (2026–2035) Service-sector expansion in emerging economies


Corporate offices remain the volume anchor, though their spend is now episodic and tied to lease events rather than steady annual budgets. Institutional buyers — government, education, healthcare — provide the counterweight, refreshing on fixed cycles that commercial property sentiment barely touches [15].

By Distribution Channel

Segment Metric Primary Demand Driver
B2B Direct-from-Manufacturer 62.20% share (2025) Large-account contract pricing
B2B Dealer & Contract Networks USD 17.81 Billion (2025) Installation, service, and specification support
B2C Retail & Online 8.45% CAGR (2026–2035) Home-office and SME self-service purchasing


Direct channels dominate because enterprise buyers negotiate global framework agreements that dealers cannot match on price. B2C grows fastest from a small base, sustained by residual home-office demand and by small businesses that never enter a formal tender process at all.


Regional Market Share Analysis

Region Metric (2025 / Forecast) Primary Investment Themes
North America 27.60% revenue share Renovation-led refits, GSA consolidation, demountable interiors
Europe USD 19.56 Billion Ecodesign compliance, circular take-back, EPD-verified catalogues
Asia-Pacific 38.30% revenue share Grade-A completions, capability centres, local assembly capacity
South America 7.60% CAGR (2026–2035) Import substitution, Brazilian public procurement
Middle East & Africa USD 4.01 Billion Giga-project fit-out, free-zone HQ relocations
Total USD 83.60 Billion

Geographic concentration in the Office Furniture Market is unusually balanced across the three major regions, but the growth differential is not. Asia-Pacific leads on both share and pace, while Europe's revenue base is defended more by regulation-driven specification uplift than by volume. The regional structure of the Office Furniture Market below reflects 2025 positioning.


North America

Country Metric Key Driver
US USD 16.43 Billion (2025) Federal consolidation and corporate renovation cycles
Canada 16.40% of regional revenue Public-sector fit-out and Toronto financial district refresh
Mexico 8.60% CAGR (2026–2035) Nearshoring-driven corporate campus construction


The U.S. picture is genuinely bifurcated. Federal demand is firm — GSA's portfolio consolidation continues to fund reconfiguration of retained buildings — while private-sector orders track lease expiry rather than headcount [1]. Mexico is the outlier: manufacturing relocation has pulled administrative and engineering functions into Monterrey, Querétaro, and Bajío corridors, generating office demand where little existed five years ago.

Europe

Country Metric Key Driver
Germany 22.60% of regional revenue Workplace ordinance compliance and industrial HQ refits
UK USD 3.38 Billion (2025) London prime refurbishment and flight-to-quality leasing
France 7.30% CAGR (2026–2035) Grand Paris office delivery pipeline
Italy 11.50% of regional revenue Domestic design manufacturing and export base
Spain USD 1.64 Billion (2025) Madrid and Barcelona shared-service centre growth
Nordic Countries 7.60% CAGR (2026–2035) Circular procurement mandates
Russia 6.20% of regional revenue Domestic substitution of Western brands
Rest of Europe USD 2.09 Billion (2025) CEE nearshoring and Polish manufacturing capacity


Regulation is the region's growth engine. Ecodesign requirements and national green public procurement rules have forced catalogue-wide redesign, and buyers increasingly weight EPD coverage and disassembly documentation alongside price [2][9]. Nordic public authorities go further, embedding refurbishment obligations directly into framework agreements — a template other member states are studying closely.

Asia-Pacific

Country Metric Key Driver
China 38.40% of regional revenue Domestic brand scale and tier-1 office inventory
India 9.40% CAGR (2026–2035) Global capability centre absorption
Japan USD 4.83 Billion (2025) Corporate HQ renewal and seismic retrofit programs
South Korea 8.90% of regional revenue Conglomerate campus consolidation
ASEAN 8.80% CAGR (2026–2035) Vietnam and Indonesia manufacturing-linked offices
Rest of Asia-Pacific USD 2.50 Billion (2025) Australian institutional and government refits


Asia-Pacific's advantage compounds because manufacturing capacity sits alongside demand. Chinese and Vietnamese plants supply both local projects and export markets, insulating regional pricing from freight shocks that hurt Western importers [18]. India's capability-centre wave is the single largest incremental demand source globally, and specification levels there have converged rapidly on Western standards.

South America

Country Metric Key Driver
Brazil USD 2.68 Billion (2025) São Paulo corporate towers and public tenders
Argentina 19.60% of regional revenue Post-stabilization corporate reinvestment
Rest of South America 7.20% CAGR (2026–2035) Chilean and Colombian services-sector offices


Brazil dominates through a mature domestic manufacturing base concentrated in Bento Gonçalves and São Paulo state, which shields the market from import cost swings. Public procurement rules favouring locally produced goods reinforce that position, though currency volatility continues to complicate multi-year contract pricing.

Middle East & Africa

Country Metric Key Driver
Saudi Arabia 29.40% of regional revenue Vision 2030 headquarters relocation programme
UAE USD 0.99 Billion (2025) Free-zone expansion and Dubai commercial towers
South Africa 6.90% CAGR (2026–2035) Johannesburg and Cape Town corporate refits
Egypt 12.30% of regional revenue New Administrative Capital government relocation
Rest of MEA USD 0.60 Billion (2025) Qatari and Kenyan services growth


Saudi Arabia's Regional Headquarters Programme has required multinationals to establish Riyadh bases to remain eligible for government contracts, generating a concentrated wave of new fit-out demand since 2024 [14]. Egypt's administrative capital relocation adds a second, government-funded pipeline of unusual scale for the region.


Office Furniture Market By Region, 2025-2035

Competitive Benchmarking

Concentration in the Office Furniture Market is moderate and trending upward. The top five producers hold an estimated 17–22% of global revenue, with a calculated HHI in the 260–340 range — squarely fragmented by regulatory standards, though the pending HNI–Steelcase combination would materially reshape the North American picture [19]. Thousands of regional manufacturers serve local tenders on price and lead time, which keeps the long tail thick even as global accounts consolidate toward a handful of vendors capable of coordinated multi-country delivery.

Company Est. Revenue Share Range Key Offerings for Office Furniture Market Strategic Positioning
Steelcase Inc. ~4.5–6.0% Task seating, benching systems, architectural walls Global contract leader; deep enterprise account base
MillerKnoll Inc. ~3.8–5.2% Premium seating, collaborative systems, design portfolio Brand-led premium positioning across multiple labels
HNI Corporation ~3.2–4.5% Workstations, storage, mid-market seating Scale acquirer; strong North American dealer network
Haworth Inc. ~2.8–3.9% Movable walls, adaptive workspaces, raised floors Privately held; architectural interiors specialist
Okamura Corporation ~1.8–2.6% Ergonomic chairs, desking, laboratory furniture Japanese leader with expanding APAC footprint
KOKUYO Co., Ltd. ~1.5–2.3% Integrated office systems, stationery-linked ecosystem Strong domestic base; ASEAN expansion focus
Teknion Corporation ~1.1–1.7% Panel systems, height-adjustable desking, casegoods Design-forward mid-premium contract player
Vitra Holding AG ~0.9–1.5% Designer seating, lounge systems, project furniture European design authority; architectural collaborations
Kinnarps AB ~0.8–1.3% Sustainable seating, storage, circular services Nordic circularity and low-emission logistics leader
Godrej Interio ~0.7–1.2% Volume office systems, institutional furniture Dominant Indian incumbent with national distribution
Global Furniture Group ~0.7–1.1% Value seating, education and healthcare lines Broad price-tier coverage across the Americas
Humanscale Corporation ~0.5–0.9% Ergonomic tools, monitor arms, task lighting Health-and-performance niche specialist


Recent News & Developments

  • HNI Corporation (August 2025): Announced a definitive agreement to acquire Steelcase, targeting substantial procurement and distribution synergies and creating the largest North American contract furniture platform [19].
  • European Commission (April 2024): Adopted the Ecodesign for Sustainable Products Regulation framework, bringing furniture into scope for durability, repairability, and recycled-content requirements with phased delegated acts [2].
  • U.S. Department of Commerce (June 2025): Raised Section 232 duties on steel and aluminium imports to 50% and expanded derivative product coverage, directly repricing frames and metal componentry [17].
  • MillerKnoll (March 2024): Consolidated multiple brand showrooms into unified regional flagships to reduce fixed cost and simplify specifier engagement across its label portfolio [20].
  • Saudi Ministry of Investment (January 2024): Enforced the Regional Headquarters Programme requirement, triggering a concentrated wave of Riyadh office establishment among multinational contractors [14].
  • BIFMA (September 2024): Published updated LEVEL certification criteria tightening chemical disclosure and social responsibility thresholds for North American contract furniture [16].
  • Kinnarps (November 2023): Expanded its refurbishment and take-back operation across Nordic markets, formalizing residual-value capture within its own service network [21].
  • Okamura Corporation (February 2025): Opened an expanded Southeast Asian showroom and distribution hub to serve capability-centre demand outside Japan [22].


Office Furniture Market Report Scope

Parameter Detail
Market Scope Global Office Furniture Market by product category, material, price range, end user, distribution channel, and geography
Study Period 2021–2035 (Historical 2021–2024; Base Year 2025; Forecast 2026–2035)
CAGR 7.65% (2026–2035)
Market Size Checkpoints USD 83.60 Billion (2025); USD 88.40 Billion (2026); USD 171.64 Billion (2035)
Fastest Growing Segments Premium price tier (9.20% CAGR); Systems & modular workstations (8.55% CAGR); B2C retail and online (8.45% CAGR)
Companies Profiled 12 global and regional manufacturers including Steelcase, MillerKnoll, HNI, Haworth, Okamura, KOKUYO, Teknion, Vitra, Kinnarps, Godrej Interio, Global Furniture Group, Humanscale
Valuation Currency USD Billion, constant 2025 exchange rates

FAQs

How should procurement teams structure a tender to avoid tariff-driven price resets mid-contract?
Build index-linked adjustment clauses tied to published metals benchmarks rather than accepting fixed pricing that vendors will pad. Cap adjustment frequency at twice annually. Require dual-sourcing disclosure at bid stage [17].
What warranty terms are realistic when buying into the Office Furniture Market today?
Twelve-year structural warranties are standard for premium task seating; five to ten years applies to desking and storage. Confirm whether coverage includes gas cylinders and casters, which most manufacturers exclude [16].
Does furniture-as-a-service actually cost less than outright purchase?
Over a full seven-year term it generally costs more in absolute outlay. The advantage is balance-sheet treatment and flexibility for tenants on short leases, not headline savings [11].
Which certifications carry genuine weight in Office Furniture Market tenders?
BIFMA LEVEL and verified Environmental Product Declarations dominate scoring in North America and Europe respectively. FSC chain-of-custody matters for wood-heavy specifications. Generic "eco-friendly" claims carry no procurement value [9][25].
How long are typical lead times for a large contract order?
Ten to sixteen weeks is standard for configured products from regional plants, extending to twenty-two weeks for transoceanic shipment. Custom finishes add four to six weeks [18].
What integration problems arise when adding sensors to Office Furniture Market purchases?
Protocol mismatch with existing building management systems is the recurring failure point. Confirm API compatibility and data ownership terms before specification, since several manufacturers retain telemetry rights by default [5].
Is refurbished inventory a credible option for a corporate headquarters?
Yes for storage, tables, and structural items where wear is cosmetic. Task seating is riskier because foam and mechanism fatigue is difficult to assess visually, and warranty coverage rarely transfers [21].      
Author
Author
Author Profile
Pradeep Nandi LinkedIn
Senior Research Analyst
I have a bachelor's degree in mechanical engineering and an MBA. I have more than two years of expertise in the retail, food, and beverage, chemical, and material industries, and hence have developed a sound cross-domain expertise. A firm believer in lifelong learning and sharing of knowledge. Having a proclivity for hatching ideas and trying to absorb as much information as possible in a short amount of time. Introducing corporates to the data and insight, which enables them to move from probability to possibility, has been my key areas of interest. 
Share::
Request Free Sample

Research Approach


Secondary Research

The secondary research process involved comprehensive analysis of industry databases, government publications, trade association reports, and authoritative market intelligence sources. Key sources included the Business and Institutional Furniture Manufacturers Association (BIFMA), American Society of Furniture Designers (ASFD), European Furniture Industries Confederation (EFIC), International Labour Organization (ILO) workplace standards database, US Bureau of Labor Statistics (BLS) occupational employment and wage data, US Census Bureau construction spending and business patterns data, Eurostat structural business statistics and production data, National Institute of Standards and Technology (NIST) engineering laboratory standards, US Green Building Council (USGBC) LEED certification database, Forest Stewardship Council (FSC) certification registry, Environmental Protection Agency (EPA) sustainable materials management data, Occupational Safety and Health Administration (OSHA) workplace ergonomics guidelines, World Green Building Council sustainable construction reports, Organisation for Economic Co-operation and Development (OECD) workspace productivity studies, United Nations Industrial Development Organization (UNIDO) manufacturing statistics, national statistical offices of China (NBS China), India (Ministry of Statistics), and Japan (Statistics Bureau), as well as commercial real estate databases including CoStar, Jones Lang LaSalle (JLL), and CBRE global office market reports.

Data on manufacturing output, commercial building trends, workplace safety laws, sustainability certifications, ergonomic standards compliance, and trade flow analysis for the wood, metal, plastic, and glass furniture segments were gathered from these sources.


Primary Research

In order to gather both qualitative and quantitative insights, supply-side and demand-side stakeholders were interviewed during the primary research process. CEOs, VPs of Manufacturing Operations, Chief Sustainability Officers, and heads of marketing strategy from top producers of office furniture, suppliers of components, and suppliers of raw materials were examples of supply-side sources. Chief procurement officers, facility managers, workspace design consultants, and heads of real estate and workplace strategy from Fortune 500 companies, government procurement agencies, administrators of educational institutions, and co-working space operators were examples of demand-side sources. Primary research confirmed material sourcing trends and sustainability roadmaps, validated market segmentation across product types (desks, chairs, storage units, tables, partition panels), and obtained information on B2B procurement channel dynamics, smart furniture integration timelines, and hybrid work adoption patterns.

Primary Respondent Breakdown:

By Designation: C-level Primaries (28%), Director Level (32%), Others (40%)

By Region: North America (32%), Europe (30%), Asia-Pacific (33%), Rest of World (5%)


Market Size Estimation

Production volume analysis, revenue mapping, and end-user demand evaluation were used to determine the global market valuation. The methodology comprised:

Finding more than 60 important firms in Latin America, Asia-Pacific, Europe, and North America

Product mapping with material segmentation (wood, metal, plastic, glass) spanning tables, desks, seats, storage units, and partition panels

Examination of annual revenues for commercial furniture portfolios, both reported and modeled

coverage of producers accounting for 75–80% of the world market in 2024

Extrapolation to obtain segment-specific valuations utilizing top-down (manufacturer revenue validation) and bottom-up (square footage of commercial development × furniture expenditure per sq ft by region) methods

Share::
Request Free Sample
Download Free Sample

Kindly complete the form below to receive a free sample of this Report

* Please use a valid business email

Share::
Request Free Sample
Download PDF ×

We do not share your information with anyone. However, we may send you emails based on your report interest from time to time. You may contact us at any time to opt-out.
















