Maritime Logistics Services Market (2026 - 2035)

Maritime Logistics and Services Market Research Report Information By Cargo Type (Containerized Cargo, Dry Bulk Cargo, Liquid Bulk Cargo, General Cargo, and Roll-On/Roll-Off Cargo), By End-User Industry (Manufacturing & Consumer Goods, Chemicals & Petrochemicals, Food & Beverage, Electronics & Semiconductors, Energy & Mining, Pharmaceuticals & Healthcare, and Automotive & Others), and By Service Type (Ocean Freight Transportation, Port & Terminal Handling, Freight Forwarding & Customs Brokerage, Warehousing & Distribution, and Ship Management & Marine Support Services) – Forecast Till 2035
ID: MRFR/PCM/7286-HCR
111 Pages
Snehal Singh
Last Updated: August 24, 2026
Maritime Logistics Services Market
Market Size
Forecast Period2026-2035
CAGR (2026-2035)5.8%
2025 Market SizeUSD 641.8 Billion
2035 Market SizeUSD 1,127.8 Billion
Key Players
A.P. Moller-Maersk
CMA CGM
COSCO Shipping
Hapag-Lloyd
Ocean Network Express
Evergreen Marine
Opportunities
  • Compliance-as-a-Service for Cargo Owners
  • African and South Asian Gateway Buildout
  • Data Monetization Across the Booking Layer

Maritime Logistics Services Market Summary

The Maritime Logistics and Services Market reached USD 641.8 billion in 2025 and opens the forecast window at USD 679.0 billion in 2026, climbing to USD 1,127.8 billion by 2035 at a 5.8% CAGR. Two catalysts anchor that trajectory. First, the International Maritime Organization's Net-Zero Framework, agreed in 2025, sets a binding greenhouse-gas fuel-intensity trajectory that pulls forward roughly USD 1.5 trillion in fleet renewal and bunkering infrastructure spend through 2050 [1]. Second, rerouting around the Red Sea and drought-constrained Panama transits has permanently lengthened average voyage distances, inflating ton-mile demand even when box volumes flatten [2].

Technology is displacing the paper-and-phone spine of ocean trade. Manual bills of lading, EDI batch files, and telephone booking desks are giving way to electronic transferable records, API-native booking, and predictive berth scheduling; digital platforms now intermediate close to 74% of container transactions and have cut average terminal dwell time by 13% [3]. Global port authorities committed over USD 82 billion in terminal automation and shore-power capex between 2023 and 2025 [4].

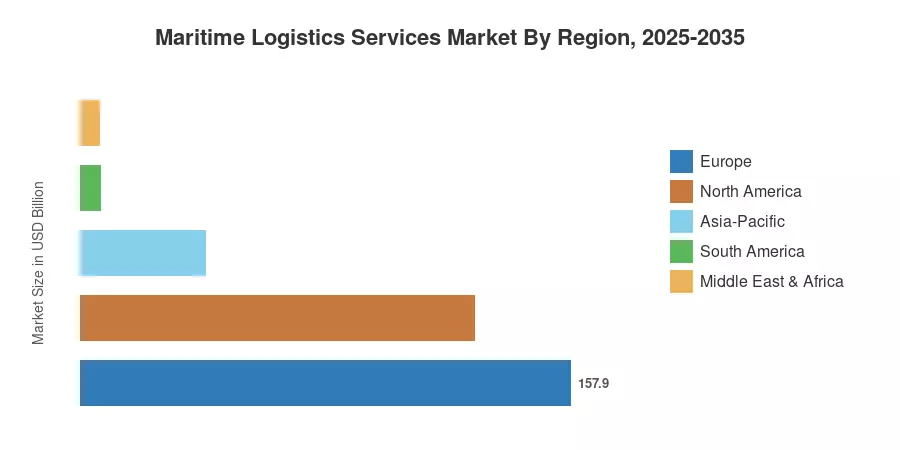
Regionally, Asia-Pacific commands 40.2% of the Maritime Logistics and Services Market and also grows fastest at a 6.3% CAGR, propelled by intra-Asian and South-South corridors. Europe follows at 24.6%, where carbon pricing is reshaping network design. The next decade rewards operators who treat compliance as a product, not a cost.


Key Report Takeaways

• By Cargo Type

  • Containerized cargo holds 34.8% of the Maritime Logistics and Services Market in 2025, sustained by consumer-goods restocking cycles
  • Dry bulk cargo accounted for USD 197.0 billion in 2025, tracking iron ore, grain, and bauxite flows
  • Roll-on/roll-off cargo expands at a 6.9% CAGR to 2035 as vehicle exports shift toward Asian origin ports

• By End-User Industry

  • Manufacturing and consumer goods represent 29.5% of demand in 2025
  • Pharmaceuticals and healthcare grow fastest at a 5.9% CAGR, driven by validated reefer capacity
  • Chemicals and petrochemicals contributed USD 118.1 billion in 2025

• By Region

  • Asia-Pacific leads the Maritime Logistics and Services Market with a 40.2% revenue share in 2025
  • Middle East and Africa posts a 6.1% CAGR through 2035 on transshipment hub buildout
  • North America generated USD 127.1 billion in 2025


Market Size and Forecast (2021–2035)

Sizing blends vessel-level AIS movement data, port authority throughput disclosures, carrier and forwarder financial filings, and customs trade statistics, triangulated against freight-rate indices and reconciled through primary interviews with shippers, terminal operators, and NVOCCs. The Maritime Logistics and Services Market series below is expressed in constant-scope USD billion.
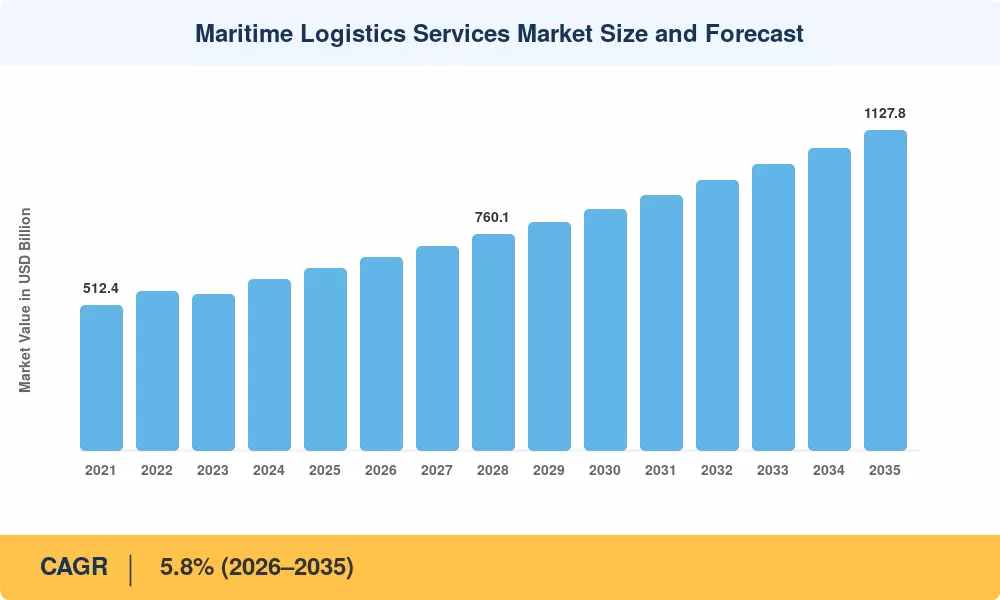
Maritime Logistics Services Market Size and Forecast
Our Impact
Enabled $4.3B Revenue Impact for Fortune 500 and Leading Multinationals
Partnering with 2000+ Global Organizations Each Year
30K+ Citations by Top-Tier Firms in the Industry

Driver Impact Analysis

Driver ~% Impact on CAGR Geographic Relevance Impact Timeline
Ton-mile expansion from resilient trade volumes +1.4 pp Global Long-term (≥4 yr)
Chokepoint rerouting and voyage lengthening +0.9 pp Asia–Europe, Americas Short-term (≤2 yr)
South-South and intra-Asian corridor growth +0.8 pp Asia-Pacific, Africa Long-term (≥4 yr)
IMO and EU-driven fleet renewal +0.7 pp Europe, Global Medium-term (2–4 yr)
Port terminal automation and capex cycles +0.6 pp Asia-Pacific, MEA Medium-term (2–4 yr)
Digital booking and visibility adoption +0.5 pp Global Short-term (≤2 yr)
Pharma-grade and cold-chain reefer demand +0.4 pp Global Medium-term (2–4 yr)


Ton-Mile Expansion Outruns Box Growth

In the maritime logistics and services market, volume only tells half the story. Because ships sailed larger arcs to avoid the Suez and Panama corridors, UNCTAD's analysis of marine transportation found that seaborne trade was around 12.6 billion tons in 2024, while ton-miles increased nearly twice as quickly [2]. Longer journeys increase the income collected per unit shipped, tighten the supply-demand balance, and absorb effective capacity. Even once chokepoints reopen, this structural lengthening continues because carriers keep the schedule buffers they established and shippers now factor price resilience into routing decisions.


Regulation Forces a Capital Cycle

The IMO's 2025 Net-Zero Framework and the EU Emissions Trading System together convert environmental policy into balance-sheet pressure. EU ETS surrender obligations added roughly USD 220 per metric ton of compliance cost in 2025 for covered voyages, with the FuelEU Maritime intensity ladder tightening every five years [7]. Operators respond by ordering dual-fuel tonnage — methanol and LNG orderbooks exceeded 25% of gross tonnage on order in 2025 — and by selling compliance-managed services to cargo owners who face their own Scope 3 disclosure obligations [9].

Terminals Become Software Businesses

Container terminals no longer compete on crane count alone. Investment in remote-controlled stacking, optical character recognition gates, and berth-window optimization exceeded USD 82 billion across major port authorities between 2023 and 2025 [4]. Ports that deployed predictive arrival systems reported truck turn-time reductions near 20%, which converts directly into higher annual throughput per hectare. That productivity is the pivot behind broader port terminal automation programs now spreading from Rotterdam and Singapore to Jebel Ali and Tanger Med.

Digital Documentation Reaches Critical Mass

Paper bills of lading cost the industry billions in delay and fraud exposure. The Digital Container Shipping Association's members committed to full electronic bill-of-lading adoption by 2030, and adoption crossed the low-teens percentage threshold in 2025 — the point at which network effects usually accelerate [3]. Banks accepting electronic records under revised trade-finance rules shorten payment cycles by days, releasing working capital for shippers and giving forwarders a new fee-bearing service to sell.


Restraints Impact Analysis

The negative weightings below are directional estimates of drag on the Maritime Logistics and Services Market. They should be read as relative severity indicators rather than deductions applied literally against the headline growth rate.

Restraint ~% Impact on CAGR Geographic Relevance Impact Timeline
Vessel overcapacity and freight-rate volatility -0.8 pp Global Short-term (≤2 yr)
Trade-policy fragmentation and sanctions exposure -0.7 pp Global Medium-term (2–4 yr)
Carbon compliance cost escalation -0.6 pp Europe Medium-term (2–4 yr)
Landside congestion and hinterland infrastructure gaps -0.5 pp South America, MEA Long-term (≥4 yr)
Seafarer and shore-side skills shortage -0.3 pp Global Long-term (≥4 yr)


An Orderbook Built for a Different Decade

The primary weakness of the maritime logistics and services market is capacity discipline. With deliveries focused in 2026–2027, the global container orderbook accounted for about 30% of the active fleet at the beginning of 2026, the highest percentage in more than fifteen years [9]. Effective supply may grow more quickly than demand when those ships enter the water while diverted routes return to normal, which would depress spot rates and the service margins that are built on top of them. By slow steaming, recycling older tonnage, and idling, carriers are already avoiding the strain.


Compliance Costs Land Unevenly

Carbon pricing is not geographically neutral. A voyage touching an EU port carries surrender obligations that an equivalent intra-Asian leg does not, creating an incentive to reshuffle transshipment through non-EU hubs such as Tanger Med and East Mediterranean ports [7]. That leakage erodes the policy's intent and imposes network redesign costs on operators serving European cargo owners. Smaller regional carriers, lacking in-house carbon desks, absorb proportionally higher administrative burden per TEU.

The Hinterland Bottleneck

Ships arrive faster than cargo clears. Rail and road connectivity constrains throughput at several high-growth gateways, with average container dwell in parts of West Africa and South America still measured in days rather than hours [4]. Until inland corridors, customs single windows, and empty-container depots scale in parallel with quay capacity, berth-side investment delivers diminishing returns.


Maritime Logistics Services Market Opportunities

Compliance-as-a-Service for Cargo Owners

Carbon accounting has become a saleable product. Shippers facing CSRD and SEC-adjacent disclosure obligations need auditable emissions data at the shipment level, not the annual level. Operators in the Maritime Logistics and Services Market that publish verified per-container intensity, offer book-and-claim green fuel allocation, and integrate the output directly into customer ERP systems can capture premium pricing that survives rate cycles [11]. Early movers report willingness-to-pay in the low single-digit percentage of freight spend.

African and South Asian Gateway Buildout

Emerging-market port capacity remains the widest structural gap. Adani's Vizhinjam transshipment terminal, Chancay in Peru, and multiple West African concessions collectively represent more than USD 20 billion of committed investment aimed at cargo currently transshipped elsewhere [4]. Whoever controls those gateways controls the feeder economics of an entire subcontinent for a generation.

Data Monetization Across the Booking Layer

Most participants ignore the capacity, rate, and dependability signals that are generated by each booking. Anonymized flow data can be bundled by platform operators into insurance underwriting inputs, dynamic surcharge products, and rate-benchmarking subscriptions—recurring income that lacks the asset intensity of vessel ownership. The Maritime Logistics and Services Market starts to resemble the airline distribution economy at this point.


Green Corridor Commercialization

The Clydebank Declaration's signatory states have designated more than 20 green shipping corridors linking specific port pairs with low-emission fuel supply [11]. These corridors bundle bunkering infrastructure, offtake commitments, and regulatory sandboxes into a single commercial package, giving first-mover operators guaranteed fuel access at a moment when methanol and ammonia supply is the binding constraint.

Pharmaceutical and Perishable Modal Shift

As controlled-atmosphere reefer containers attain verified stability characteristics, air-to-ocean conversion for temperature-controlled pharmaceuticals is quickening. For pharmaceutical companies under scrutiny for logistics emissions, the sustainability reporting benefit is significant, and the cost difference is around an order of magnitude [13].


Maritime Logistics Services Market Future Outlook

Autonomous and AI-Assisted Operations

Voyage optimization moves from advisory to executive. Machine-learning systems that ingest weather routing, hull-fouling telemetry, and berth-availability signals already cut fuel burn by 5–10% on long-haul rotations, and the same models increasingly control just-in-time arrival negotiation with terminals [8]. By the mid-2030s, expect crew-reduced coastal and short-sea vessels operating under remote-supervision frameworks, with the Maritime Logistics and Services Market absorbing a new layer of onshore operations-center employment even as bridge headcount falls.

Platform Economics and Disintermediation

Booking is consolidating around a handful of API-first platforms. Carriers that built direct digital channels captured a rising share of spot bookings, squeezing traditional forwarders toward higher-value customs, compliance, and multimodal orchestration work [3]. The likely equilibrium mirrors travel distribution: commoditized capacity sold through platforms, with margin migrating to whoever owns the customer relationship and the exception-handling layer.

The Alternative-Fuel Supercycle

Fuel choice is the decade's biggest capital allocation question. The IEA projects that low-emission fuels must supply a meaningful share of bunker demand by 2035 for shipping to stay on a net-zero-aligned path, yet green methanol and ammonia production capacity remains a fraction of what the orderbook implies [12]. Scarcity favors operators with signed offtake agreements, and vessel decarbonization economics will hinge on fuel-price spreads rather than engine technology.

ESG Reporting Becomes Contractual

Emissions data is migrating from sustainability reports into commercial contracts. Shippers increasingly write intensity thresholds into tenders, and lenders apply Poseidon Principles portfolio alignment tests to ship finance [11]. Within the Maritime Logistics and Services Market, that turns verified environmental performance into a qualification criterion — operators without granular, assurance-ready data will simply not be invited to bid.


Maritime Logistics Services Market Segmentation

By Cargo Type

Cargo mix determines volatility exposure across the Maritime Logistics and Services Market, with containerized flows tracking consumer demand and bulk flows tracking industrial cycles.

Segment Metric (2025) Primary Demand Driver
Containerized Cargo 34.8% share Consumer goods and e-commerce restocking
Dry Bulk Cargo USD 197.0 Billion Iron ore, coal, grain, and bauxite trade
Liquid Bulk Cargo 4.3% CAGR Crude, refined products, and chemical parcels
General Cargo 9.1% share Project cargo, steel, and forest products
Roll-On/Roll-Off Cargo 6.9% CAGR Vehicle exports and high-and-heavy equipment


Containerized cargo remains the commercial engine because it carries the highest revenue per ton and supports the richest service layer — customs brokerage, cargo insurance, visibility subscriptions, and inland drayage all attach to the box. Dry bulk provides ballast in the portfolio sense: lower margin, but far less exposed to the rate collapse risk that overcapacity poses to liner trades [9]. Roll-on/roll-off is the standout grower, as Chinese vehicle exports pushed car-carrier utilization to near-historic highs and triggered the largest pure car and truck carrier newbuild wave in two decades.

By End-User Industry

End-user concentration shapes contract duration and service-level expectations throughout the Maritime Logistics and Services Market.

Segment Metric (2025) Primary Demand Driver
Manufacturing & Consumer Goods 29.5% share Retail replenishment and durable goods trade
Chemicals & Petrochemicals USD 118.1 Billion Gulf and Asian petrochemical capacity additions
Food & Beverage 16.2% share Reefer produce, protein, and beverage exports
Electronics & Semiconductors 5.6% CAGR Fab buildout and component distribution
Energy & Mining USD 82.8 Billion Coal, LNG feeder, and critical minerals flows
Pharmaceuticals & Healthcare 5.9% CAGR Validated cold-chain modal shift from air
Automotive & Others 3.0% share Component kitting and aftermarket parts


Manufacturing and consumer goods anchor liner networks: these shippers sign annual contracts, tolerate standardized service, and fill the base load that makes weekly strings viable. Pharmaceuticals and healthcare grow fastest but from a small base, and they demand something different — continuous temperature telemetry, chain-of-custody documentation, and contingency routing that most ocean carriers historically did not offer [13].

By Service Type

Service mix explains why margin distribution across the Maritime Logistics and Services Market differs so sharply from volume distribution.

Segment Metric (2025) Primary Demand Driver
Ocean Freight Transportation 46.3% share Core port-to-port capacity provision
Port & Terminal Handling USD 138.0 Billion Throughput growth and automation-led productivity
Freight Forwarding & Customs Brokerage 16.8% share Trade-compliance complexity and multimodal needs
Warehousing & Distribution 6.7% CAGR Port-centric fulfilment and free-zone inventory
Ship Management & Marine Support Services 6.2% CAGR Technical management, crewing, and bunkering


Ocean transportation dominates revenue but delivers the thinnest and most cyclical margins. Terminal handling behaves like infrastructure — concession-protected, capital-intensive, and remarkably stable — which is why financial sponsors have bid terminal assets to premium multiples [4].


Regional Market Share Analysis

Region Metric (2025) Primary Investment Themes
Asia-Pacific 40.2% share Transshipment capacity, intra-Asian feeder networks, shipbuilding
Europe USD 157.9 Billion Carbon compliance, shore power, inland waterway integration
North America USD 127.1 Billion Nearshoring corridors, port electrification, rail interchange
Middle East & Africa 6.1% CAGR Hub terminals, free-zone logistics, bunkering
South America 6.5% share Grain and mineral export terminals, Pacific gateways
Total 100.0% / USD 641.8 Billion

Regional performance in the Maritime Logistics and Services Market reflects three variables: proximity to manufacturing clusters, gateway infrastructure quality, and exposure to carbon regulation.


North America

Country Metric Key Driver
US 74.6% of region Gulf and East Coast gateway expansion
Canada USD 21.6 Billion Prince Rupert and Montreal corridor capacity
Mexico 6.4% CAGR Nearshoring-driven Pacific and Gulf volumes


Federal support reshapes the coastline. The Port Infrastructure Development Program has awarded well over USD 3 billion since 2022 toward berth rehabilitation, rail interchange, and zero-emission cargo handling equipment, while the EPA's Clean Ports Program directed roughly USD 3 billion more into electrification and hydrogen pilots [16]. Mexico's Pacific ports absorb the nearshoring dividend, though rail congestion at inland crossings remains the binding constraint.

Europe

Country Metric Key Driver
Germany 18.9% of region Hamburg-Bremerhaven hinterland rail density
UK USD 21.3 Billion Freeport policy and transshipment repositioning
France 11.4% of region Le Havre corridor and inland waterway shift
Italy 5.4% CAGR Mediterranean transshipment and Africa feeder links
Spain USD 14.2 Billion Algeciras and Valencia hub throughput
Nordic Countries 5.9% CAGR Shore power mandates and short-sea electrification
Russia 4.1% of region Redirected Arctic and Pacific-facing flows
Rest of Europe USD 24.9 Billion Black Sea and Adriatic gateway diversification


Europe carries the heaviest regulatory load and the deepest compliance expertise. FuelEU Maritime obligations began biting in 2025, and the extension of ETS coverage to a full 100% of intra-EU emissions removes the phase-in cushion [7]. Ports responded with shore-power mandates ahead of the 2030 AFIR deadline; Rotterdam and Antwerp-Bruges together committed over EUR 1.5 billion to quay-side power and hydrogen import readiness [4].

Asia-Pacific

Country Metric Key Driver
China 41.8% of region Container manufacturing base and mega-port throughput
India 7.4% CAGR Sagarmala programme and Vizhinjam transshipment
Japan USD 27.4 Billion Automotive roll-on/roll-off and ammonia bunkering trials
South Korea 9.7% of region Shipbuilding leadership and Busan transshipment
ASEAN USD 44.9 Billion Singapore hub reinforcement and Vietnam export growth
Rest of Asia-Pacific 6.0% CAGR Australian bulk exports and Pacific feeder consolidation


Asia-Pacific anchors the Maritime Logistics and Services Market on the strength of intra-regional trade that now exceeds transpacific volume. India's Maritime Amrit Kaal Vision 2047 targets a multi-fold increase in port handling capacity, and Vizhinjam's commissioning gives the subcontinent its first natural deep-draft transshipment terminal capable of retaining cargo previously routed through Colombo and Singapore [4]. Singapore's Tuas mega-port continues phased delivery toward a 65 million TEU design capacity.

South America

Country Metric Key Driver
Brazil 52.3% of region Grain, iron ore, and Santos terminal expansion
Argentina USD 6.9 Billion Paraná waterway agri-export flows
Rest of South America 7.1% CAGR Chancay gateway and Pacific-Asia direct services


Chancay changes the map. The deep-water terminal north of Lima opened direct Asia sailings that cut Pacific transit by roughly ten days versus routings through Mexican and Panamanian hubs, giving Peruvian and Brazilian exporters a genuine alternative to Atlantic-facing corridors [10]. Panama Canal draft restrictions during drought years reinforced the commercial logic.

Middle East & Africa

Country Metric Key Driver
Saudi Arabia 24.6% of region Vision 2030 logistics hubs and Jeddah transshipment
UAE USD 16.4 Billion Jebel Ali free-zone integration and terminal operations
South Africa 5.8% CAGR Durban and Ngqura efficiency recovery programmes
Egypt 14.1% of region Suez Canal Economic Zone industrial clustering
Rest of MEA USD 12.7 Billion West African concessions and Indian Ocean feeders


Gulf states are converting energy rents into logistics infrastructure. Saudi Arabia's National Transport and Logistics Strategy targets a top-ten global logistics ranking by 2030, backed by more than USD 130 billion of programmed transport investment across ports, rail, and industrial zones [17]. Egypt's Suez Canal Economic Zone attracts manufacturing that generates its own export volumes, insulating throughput from transit-fee volatility.


Maritime Logistics Services Market By Region, 2025-2035

Competitive Benchmarking

Concentration in the Maritime Logistics and Services Market sits in the medium band, with an estimated HHI near 780 and a top-five combined share around 44%. Liner shipping is the concentrated core; forwarding, terminal operation, and marine services remain fragmented, populated by thousands of regional specialists. Alliance restructuring — most visibly the Gemini Cooperation — has shifted competition from raw capacity toward schedule reliability, with hub-and-spoke network operators publicly targeting roughly 84% on-time performance [8].

Company Est. Revenue Share Range Key Offerings for Maritime Logistics and Services Market Strategic Positioning
Mediterranean Shipping Company ~11–14% Global liner network, terminals, inland logistics Largest fleet; organic and acquisitive scale
A.P. Moller-Maersk ~9–12% Integrated ocean, air, contract logistics, terminals End-to-end integrator; methanol fleet leader
CMA CGM ~8–10% Liner services, CEVA Logistics, terminal concessions Diversified into media, logistics, and air
COSCO Shipping ~7–9% Container and bulk shipping, port operations State-backed; Belt and Road corridor alignment
Hapag-Lloyd ~5–7% Liner services, terminal investments Gemini partner; reliability-led differentiation
Ocean Network Express ~4–6% Container liner services Japanese carrier consolidation; lean cost base
Evergreen Marine ~3–5% Container liner and feeder services Asia-centric density; disciplined capex
DP World ~2–4% Terminal operations, free zones, feeder logistics Gateway infrastructure and trade-enablement
HMM ~2–3% Container and bulk liner services Korean flag carrier; premium tonnage renewal
Kuehne+Nagel ~2–3% Sea logistics, customs brokerage, visibility platforms Asset-light forwarding and digital control tower
DSV ~1–2% Sea freight forwarding, contract logistics Acquisition-driven scale in forwarding


Recent News & Developments

  • International Maritime Organization (April 2025): Member states approved the Net-Zero Framework introducing a global greenhouse-gas fuel-intensity standard and pricing mechanism for shipping, creating the sector's first worldwide carbon charge [1].


  • European Commission (January 2025): FuelEU Maritime entered application alongside full ETS phase-in for maritime emissions, extending compliance obligations to every covered voyage touching an EU port [7].
  • Adani Ports (December 2024): Vizhinjam International Seaport commenced commercial operations, giving India its first deep-draft transshipment terminal and beginning cargo repatriation from regional hubs [4].
  • Cosco Shipping Ports (November 2024): The Chancay multipurpose terminal in Peru opened, launching direct Asia–South America sailings and materially shortening Pacific transit times [10].


  • CMA CGM (June 2024): The carrier confirmed a multi-billion-dollar dual-fuel newbuild programme spanning methanol and LNG tonnage, among the largest single low-carbon fleet commitments recorded [9].
  • Digital Container Shipping Association (September 2023): All nine member carriers committed to issuing 100% of bills of lading electronically by 2030, establishing an industry-wide digital documentation deadline [3].


Maritime Logistics Services Market Report Scope

Parameter Detail
Market Scope Global ocean freight transportation, port and terminal handling, freight forwarding and customs brokerage, warehousing and distribution, and ship management and marine support services within the Maritime Logistics and Services Market
Study Period 2021–2035 (Historical 2021–2024; Base Year 2025; Forecast 2026–2035)
CAGR 5.8% (2026–2035)
Market Size Checkpoints USD 641.8 Billion (2025); USD 679.0 Billion (2026); USD 1,127.8 Billion (2035)
Fastest Growing Segments Roll-On/Roll-Off Cargo; Pharmaceuticals & Healthcare; Warehousing & Distribution
Companies Profiled 11 profiled operators including MSC, A.P. Moller-Maersk, CMA CGM, COSCO Shipping, Hapag-Lloyd, Ocean Network Express, Evergreen Marine, DP World, HMM, Kuehne+Nagel, DSV
Valuation Currency USD Billion, constant scope

FAQs

What contract structure best protects a shipper entering the Maritime Logistics and Services Market during a rate downcycle?
Blended contracting works best: lock 60–70% of volume on annual rates for network security, leave the balance on index-linked or spot terms to capture downside. Pure fixed contracts strand shippers above market when capacity floods in [9].
How should buyers evaluate a carrier's decarbonization claims during tender?
Ask for third-party assured, voyage-level intensity data rather than fleet averages, and confirm whether green fuel claims are physically delivered or book-and-claim certificates. Poseidon Principles disclosure status is a useful independent screen [25].
Which due-diligence red flags matter most when acquiring an asset in the Maritime Logistics and Services Market?
Concession tenure and renewal terms outrank throughput history for terminal assets. For forwarders, customer concentration above 20% with a single shipper and unhedged carrier liability exposure are the common deal-breakers [24].
Is electronic bill-of-lading adoption a genuine integration risk for mid-sized shippers?
Yes — the constraint is banking counterparties and insurers, not the shipper's own systems. Confirm your trade-finance provider accepts records under the applicable electronic transferable records framework before committing to a carrier's platform [3].
How do freight forwarders compete against carriers selling directly in the Maritime Logistics and Services Market?
Forwarders win on exception handling, multimodal orchestration, and customs complexity — services carriers underinvest in. Direct carrier channels take the simple, high-volume port-pair bookings, pushing intermediaries toward specialized and compliance-heavy freight [3].
What emerging use case is most underestimated by buyers today?
Port-centric fulfilment. Positioning inventory inside free zones adjacent to gateways cuts inland drayage, defers duty, and enables faster regional replenishment than centralized inland distribution centers [17].
Does carbon leakage to non-EU transshipment hubs create real commercial opportunity?
It does, though regulators are actively monitoring it. Hubs like Tanger Med and East Mediterranean ports have gained transshipment calls, but the Commission has signalled it will review the transshipment port list if diversion proves material [7].    
Author
Author
Author Profile
Snehal Singh LinkedIn
Manager - Research
High acumen in analyzing complex macro & micro markets with more than 6 years of work experience in the field of market research. By implementing her analytical skills in forecasting and estimation into market research reports, she has expertise in Packaging, Construction, and Equipment domains. She handles a team size of 20-25 resources and ensures smooth running of the projects, associated marketing activities, and client servicing.

Research Approach

Maritime Logistics and Services Market

Introduction

The maritime logistics services market is anticipated to have exponential growth by 2030, at a healthy CAGR during the forecast period 2023 to 2030. Maritime logistics refers to the coordination of efficient movement of goods and services throughout the supply chain by utilising sea transportation. This service provides a variety of years to utilize international waters for both transporting goods and locally within a country’s territorial waters.

The increasing trade volumes, growing cross-border activities, and progressive government initiatives have facilitated the growth opportunity for maritime logistics services across the world. Companies are majorly adopting advanced technologies such as big data analytics, the Internet of Things (IoT), and blockchain to provide efficient solutions and enhance their track & trace capabilities and shipment visibility process.

Considering the present scenario in the maritime logistics market, the research tries to answer to answer the following questions:

  • What are the drivers and restraints of the maritime logistics services market?
  • What is the expected growth rate during the forecast period, 2023-2030?
  • Who are the major players in the maritime logistics services market?

Research Objectives

The main objectives of this research are framed as follows:

  • To analyse and study the market size, value and market shares of the key players.
  • To analyse and study the maritime logistics services market competitive developments such as joint ventures, expansions, new product launches, and acquisitions in the market.
  • To track and analyse the competitive developments such as joint ventures, expansions, new product launches, and acquisitions in the maritime logistics services market.
  • To track and analyse the market in terms of its dynamics in different regions/countries.
  • To classify and forecast the market based on service type, segment size, and region.
  • To identify the opportunities and challenges that are influencing the maritime logistics services market growth.
  • To evaluate the impact of government policies on the maritime logistics services market.

Research Methodology

The research methodology adopted to analyse the maritime logistics services market is a mix of primary and secondary research. The data collection has been done through various primary and secondary sources. Primary research has been conducted in the form of questionnaire surveys. A detailed secondary research process has been conducted using various reliable sources such as company websites. The picture of the maritime logistics industry has been derived through secondary sources such as WTO, IMF, Dow Jones, Bloomberg, and Ocean Freight Exchange Ltd.

The secondary source research includes Government and industry reports, the US Census Bureau Report, Government Reports, Regional Reports, and other Statistical Reports. The primary research includes surveys and interviews of industry leaders.

The market data has been gathered from both primary and secondary sources. The secondary sources include various sources such as company websites, research papers, monthly magazines, government reports, and newspaper articles. The primary research involves interviews with experts from the industry and surveys.

Approaches Used

Two approaches have been used in the research to determine the dynamics of the maritime logistics services market:

Bottom-up approach: This approach has been used to identify the potential market size and share of the business aspects of the maritime logistics services market.

Top-down approach: This approach is used to validate the current position of the maritime logistics services market in comparison with the total market size.

The market sizing has been done based on forecast using survey data, current trends, and estimations. The factor-based analysis method was used to check the driver’s impact on the maritime logistics services market. The demand and supply sides of the market have been triangulated through the factor analysis and a time-series approach is used to build the historical data set.

Conclusion

The maritime logistics services market is rapidly increasing due to increasing international trade, rising cross-border activities, and progressive government initiatives. The research aims to analyse the drivers, restraints, growth opportunities, and competitive landscape in the maritime logistics services market. The research methodology adopted for this research is a mix of primary and secondary sources such as surveys and interviews with industry experts. The market sizing and potential market size have been determined on the basis of forecasts using survey data, current trends, and estimations. The factor-based analysis method and a time-series approach were used to check the driver’s impact on the maritime logistics services market. The demand and supply sides of the market were triangulated through the factor analysis.

Download Free Sample

Kindly complete the form below to receive a free sample of this Report

* Please use a valid business email

Download PDF ×

We do not share your information with anyone. However, we may send you emails based on your report interest from time to time. You may contact us at any time to opt-out.
















