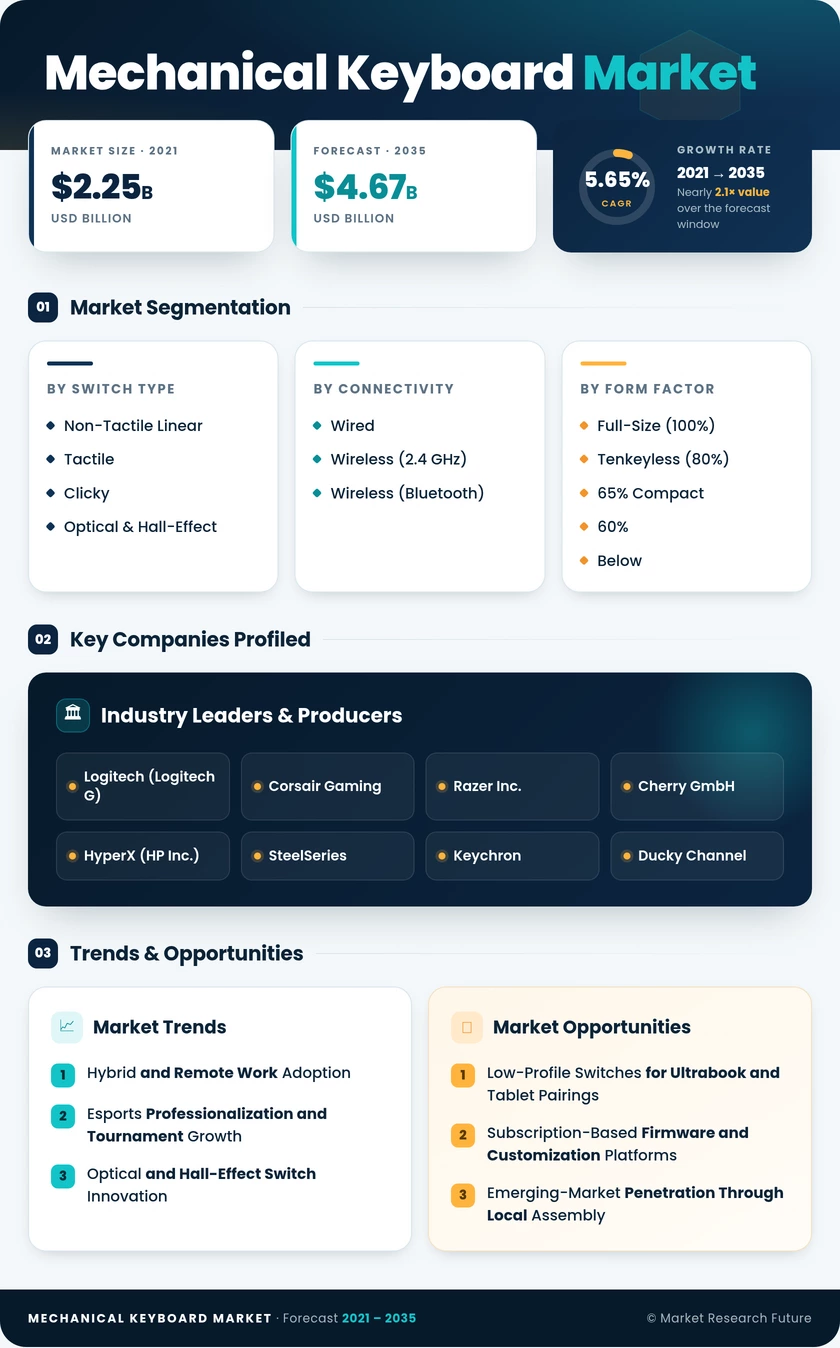
Mechanical Keyboard Market (2025 - 2035)

ID: MRFR/SEM/0708-CR
101 Pages
Aarti Dhapte
Last Updated: July 09, 2026
Mechanical Keyboard Market Size, Share and Research Report By Switch Type (Non-Tactile Linear Switches, Tactile Switches, Clicky Switches, Optical & Hall-Effect Switches), By Connectivity (Wired, Wireless (2.4 GHz), Wireless (Bluetooth)), By Form Factor (Full-Size (100%), Tenkeyless (80%), 65% Compact, 60% and Below), By Keycap Material (ABS, PBT (Double-Shot), POM and Other), By Application and End User (Gaming and Esports, Office and Industrial, Enthusiast / DIY, Content Creation) and By Regional (North America, Europe, South America, Asia Pacific, Middle East and Africa) - Industry Forecast to 2035.
Mechanical Keyboard Market
Market Size
Forecast Period2025-2035
CAGR (2025-2035)5.65%
2025 Market SizeUSD 2.71 Billion
2035 Market SizeUSD 4.67 Billion
Key Players
Logitech
Corsair Gaming
Razer Inc.
Cherry GmbH
HyperX
SteelSeries
Opportunities
  • Low-Profile Switches for Ultrabook and Tablet Pairings
  • Subscription-Based Firmware and Customization Platforms
  • Emerging-Market Penetration Through Local Assembly
  1. 1 Market Overview |
    1. 1.1 Study Assumptions & Market Definition |
    2. 1.2 Scope of the Study |
    3. 1.3 Research Methodology
  2. 2 Market Summary & Key Takeaways
  3. 3 Market Dynamics |
    1. 3.1 Market Drivers Analysis | |
      1. 3.1.1 Hybrid and Remote Work Adoption | |
      2. 3.1.2 Esports Professionalization and Tournament Growth | |
      3. 3.1.3 Optical and Hall-Effect Switch Innovation | |
      4. 3.1.4 Ergonomic Workplace Mandates | |
      5. 3.1.5 Content-Creator Peripheral Demand | |
      6. 3.1.6 Enterprise IT Refresh Cycles | |
      7. 3.1.7 Compact Form-Factor Adoption in Mobile Workstations |
    2. 3.2 Market Restraints Analysis | |
      1. 3.2.1 Premium Pricing Versus Membrane Alternatives | |
      2. 3.2.2 Acoustic Noise Concerns in Shared Workspaces | |
      3. 3.2.3 Weight and Bulk Limiting Portable Use | |
      4. 3.2.4 Supply-Chain Concentration in Southern China | |
      5. 3.2.5 Fragmented Switch-Compatibility Standards |
    3. 3.3 Market Opportunity Analysis | |
      1. 3.3.1 Low-Profile Switches for Ultrabook and Tablet Pairings | |
      2. 3.3.2 Subscription-Based Firmware and Customization Platforms | |
      3. 3.3.3 Emerging-Market Penetration Through Local Assembly | |
      4. 3.3.4 Enterprise Ergonomic Procurement Programs | |
      5. 3.3.5 Custom Enthusiast and DIY Kits |
    4. 3.4 Industry Value Chain Analysis |
    5. 3.5 Porter's Five Forces Analysis
  4. 4 Global Mechanical Keyboard Market Size & Forecast (2021–2035) |
    1. 4.1 Historical Market Size (2021–2025) |
    2. 4.2 Current & Forecast Market Size (2026–2035) |
    3. 4.3 Market Size by Revenue (USD Billion) |
    4. 4.4 Year-over-Year Growth Analysis
  5. 5 Segmentation Analysis |
    1. 5.1 By Switch Type | |
      1. 5.1.1 Non-Tactile Linear Switches | |
      2. 5.1.2 Tactile Switches | |
      3. 5.1.3 Clicky Switches | |
      4. 5.1.4 Optical & Hall-Effect Switches |
    2. 5.2 By Connectivity | |
      1. 5.2.1 Wired | |
      2. 5.2.2 Wireless (2.4 GHz) | |
      3. 5.2.3 Wireless (Bluetooth) |
    3. 5.3 By Form Factor | |
      1. 5.3.1 Full-Size (100%) | |
      2. 5.3.2 Tenkeyless (80%) | |
      3. 5.3.3 65% Compact | |
      4. 5.3.4 60% and Below |
    4. 5.4 By Keycap Material | |
      1. 5.4.1 ABS | |
      2. 5.4.2 PBT (Double-Shot) | |
      3. 5.4.3 POM and Other |
    5. 5.5 By Application and End User | |
      1. 5.5.1 Gaming and Esports | |
      2. 5.5.2 Office and Industrial | |
      3. 5.5.3 Enthusiast / DIY | |
      4. 5.5.4 Content Creation
  6. 6 Regional Analysis |
    1. 6.1 North America | |
      1. 6.1.1 United States | |
      2. 6.1.2 Canada | |
      3. 6.1.3 Mexico |
    2. 6.2 Europe | |
      1. 6.2.1 Germany | |
      2. 6.2.2 United Kingdom | |
      3. 6.2.3 France | |
      4. 6.2.4 Italy | |
      5. 6.2.5 Spain | |
      6. 6.2.6 Nordic Countries | |
      7. 6.2.7 Russia | |
      8. 6.2.8 Rest of Europe |
    3. 6.3 Asia-Pacific | |
      1. 6.3.1 China | |
      2. 6.3.2 India | |
      3. 6.3.3 Japan | |
      4. 6.3.4 South Korea | |
      5. 6.3.5 ASEAN | |
      6. 6.3.6 Rest of Asia-Pacific |
    4. 6.4 South America | |
      1. 6.4.1 Brazil | |
      2. 6.4.2 Argentina | |
      3. 6.4.3 Rest of South America |
    5. 6.5 Middle East & Africa | |
      1. 6.5.1 Saudi Arabia | |
      2. 6.5.2 UAE | |
      3. 6.5.3 South Africa | |
      4. 6.5.4 Egypt | |
      5. 6.5.5 Rest of MEA
  7. 7 Competitive Landscape |
    1. 7.1 Market Share Analysis (2025) |
    2. 7.2 Competitive Benchmarking Matrix |
    3. 7.3 Company Profiles | |
      1. 7.3.1 Logitech (Logitech G) | |
      2. 7.3.2 Corsair Gaming | |
      3. 7.3.3 Razer Inc. | |
      4. 7.3.4 Cherry GmbH | |
      5. 7.3.5 HyperX (HP Inc.) | |
      6. 7.3.6 SteelSeries | |
      7. 7.3.7 Keychron | |
      8. 7.3.8 Ducky Channel | |
      9. 7.3.9 Das Keyboard (Metadot) | |
      10. 7.3.10 Leopold
  8. 8 Future Outlook & Strategic Recommendations (2026–2035) |
    1. 8.1 AI-Driven Personalization and Adaptive Input |
    2. 8.2 Platform Economics and Software Monetization |
    3. 8.3 Sustainability and Circular-Design Mandates |
    4. 8.4 Convergence with Extended-Reality Workspaces
  9. 9 Recent Developments & News
  10. 10 Frequently Asked Questions (FAQs)
  11. 11 Report Scope & Methodology |
    1. 11.1 Study Period & Base Year |
    2. 11.2 Data Sources & Citations |
    3. 11.3 Abbreviations
  12. 12 LIST OF TABLES |
  13. TABLE 1 Global Mechanical Keyboard Market Size & Forecast, by Revenue (USD Billion), 2021–2035 |
  14. TABLE 2 Global Mechanical Keyboard Market – Year-over-Year Growth Analysis, 2021–2035 |
  15. TABLE 3 Global Mechanical Keyboard Market – Driver Impact Analysis |
  16. TABLE 4 Global Mechanical Keyboard Market – Restraint Impact Analysis |
  17. TABLE 5 Global Mechanical Keyboard Market Size, by Switch Type, 2021–2035 (USD Billion) |
  18. TABLE 6 Global Mechanical Keyboard Market Size, by Connectivity, 2021–2035 (USD Billion) |
  19. TABLE 7 Global Mechanical Keyboard Market Size, by Form Factor, 2021–2035 (USD Billion) |
  20. TABLE 8 Global Mechanical Keyboard Market Size, by Keycap Material, 2021–2035 (USD Billion) |
  21. TABLE 9 Global Mechanical Keyboard Market Size, by Application and End User, 2021–2035 (USD Billion) |
  22. TABLE 10 Global Mechanical Keyboard Market Size, by Region, 2021–2035 (USD Billion) |
  23. TABLE 11 North America Mechanical Keyboard Market Size, by Country, 2021–2035 (USD Billion) |
  24. TABLE 12 Europe Mechanical Keyboard Market Size, by Country, 2021–2035 (USD Billion) |
  25. TABLE 13 Asia-Pacific Mechanical Keyboard Market Size, by Country, 2021–2035 (USD Billion) |
  26. TABLE 14 South America Mechanical Keyboard Market Size, by Country, 2021–2035 (USD Billion) |
  27. TABLE 15 Middle East & Africa Mechanical Keyboard Market Size, by Country, 2021–2035 (USD Billion) |
  28. TABLE 16 Competitive Benchmarking Matrix – Global Mechanical Keyboard Market, 2025 |
  29. TABLE 17 Company Profiles – Key Players, Global Mechanical Keyboard Market |
  30. TABLE 18 Recent Developments & Strategic Announcements, 2023–2024 |
  31. TABLE 19 Report Scope & Methodology Summary |
  32. TABLE 20 Detailed Sources and Citations |
  33. TABLE 21 North America Mechanical Keyboard Market Size, by Switch Type, 2021–2035 (USD Billion) |
  34. TABLE 22 North America Mechanical Keyboard Market Size, by Connectivity, 2021–2035 (USD Billion) |
  35. TABLE 23 North America Mechanical Keyboard Market Size, by Form Factor, 2021–2035 (USD Billion) |
  36. TABLE 24 North America Mechanical Keyboard Market Size, by Keycap Material, 2021–2035 (USD Billion) |
  37. TABLE 25 North America Mechanical Keyboard Market Size, by Application and End User, 2021–2035 (USD Billion) |
  38. TABLE 26 Europe Mechanical Keyboard Market Size, by Switch Type, 2021–2035 (USD Billion) |
  39. TABLE 27 Europe Mechanical Keyboard Market Size, by Connectivity, 2021–2035 (USD Billion) |
  40. TABLE 28 Europe Mechanical Keyboard Market Size, by Form Factor, 2021–2035 (USD Billion) |
  41. TABLE 29 Europe Mechanical Keyboard Market Size, by Keycap Material, 2021–2035 (USD Billion) |
  42. TABLE 30 Europe Mechanical Keyboard Market Size, by Application and End User, 2021–2035 (USD Billion) |
  43. TABLE 31 Asia-Pacific Mechanical Keyboard Market Size, by Switch Type, 2021–2035 (USD Billion) |
  44. TABLE 32 Asia-Pacific Mechanical Keyboard Market Size, by Connectivity, 2021–2035 (USD Billion) |
  45. TABLE 33 Asia-Pacific Mechanical Keyboard Market Size, by Form Factor, 2021–2035 (USD Billion) |
  46. TABLE 34 Asia-Pacific Mechanical Keyboard Market Size, by Keycap Material, 2021–2035 (USD Billion) |
  47. TABLE 35 Asia-Pacific Mechanical Keyboard Market Size, by Application and End User, 2021–2035 (USD Billion) |
  48. TABLE 36 South America Mechanical Keyboard Market Size, by Switch Type, 2021–2035 (USD Billion) |
  49. TABLE 37 South America Mechanical Keyboard Market Size, by Connectivity, 2021–2035 (USD Billion) |
  50. TABLE 38 South America Mechanical Keyboard Market Size, by Form Factor, 2021–2035 (USD Billion) |
  51. TABLE 39 South America Mechanical Keyboard Market Size, by Keycap Material, 2021–2035 (USD Billion) |
  52. TABLE 40 South America Mechanical Keyboard Market Size, by Application and End User, 2021–2035 (USD Billion) |
  53. TABLE 41 Middle East & Africa Mechanical Keyboard Market Size, by Switch Type, 2021–2035 (USD Billion) |
  54. TABLE 42 Middle East & Africa Mechanical Keyboard Market Size, by Connectivity, 2021–2035 (USD Billion) |
  55. TABLE 43 Middle East & Africa Mechanical Keyboard Market Size, by Form Factor, 2021–2035 (USD Billion) |
  56. TABLE 44 Middle East & Africa Mechanical Keyboard Market Size, by Keycap Material, 2021–2035 (USD Billion) |
  57. TABLE 45 Middle East & Africa Mechanical Keyboard Market Size, by Application and End User, 2021–2035 (USD Billion)
  58. 13 LIST OF FIGURES |
  59. FIGURE 1 Mechanical Keyboard Market Dynamics — Drivers, Restraints, Opportunities |
  60. FIGURE 2 Value Chain Analysis — Mechanical Keyboard Market |
  61. FIGURE 3 Porter's Five Forces Analysis — Mechanical Keyboard Market |
  62. FIGURE 4 Global Mechanical Keyboard Market Size Trend (USD Billion), 2021–2035 |
  63. FIGURE 5 Global Mechanical Keyboard Market Share, by Switch Type, 2025 (%) |
  64. FIGURE 6 Global Mechanical Keyboard Market Share, by Connectivity, 2025 (%) |
  65. FIGURE 7 Global Mechanical Keyboard Market Share, by Form Factor, 2025 (%) |
  66. FIGURE 8 Global Mechanical Keyboard Market Share, by Keycap Material, 2025 (%) |
  67. FIGURE 9 Global Mechanical Keyboard Market Share, by Application and End User, 2025 (%) |
  68. FIGURE 10 Global Mechanical Keyboard Market Share, by Region, 2025 (%) |
  69. FIGURE 11 North America Mechanical Keyboard Market Size Trend (USD Billion), 2021–2035 |
  70. FIGURE 12 Europe Mechanical Keyboard Market Size Trend (USD Billion), 2021–2035 |
  71. FIGURE 13 Asia-Pacific Mechanical Keyboard Market Size Trend (USD Billion), 2021–2035 |
  72. FIGURE 14 South America Mechanical Keyboard Market Size Trend (USD Billion), 2021–2035 |
  73. FIGURE 15 Middle East & Africa Mechanical Keyboard Market Size Trend (USD Billion), 2021–2035 |
  74. FIGURE 16 Competitive Landscape — Market Share Analysis, 2025

Segmentation Quick Reference

DimensionSub-SegmentsDominant SegmentFastest Growing Segment
Switch TypeNon-Tactile Linear, Tactile, Clicky, Optical & Hall-EffectNon-Tactile Linear SwitchesOptical & Hall-Effect Switches
ConnectivityWired, Wireless (2.4 GHz), Wireless (Bluetooth)WiredWireless (2.4 GHz)
Form FactorFull-Size (100%), Tenkeyless (80%), 65% Compact, 60% and BelowFull-Size (100%)65% Compact
Keycap MaterialABS, PBT (Double-Shot), POM and OtherABSPBT (Double-Shot)
Application & End UserGaming and Esports, Office and Industrial, Enthusiast / DIY, Content CreationGaming and EsportsEnthusiast / DIY


Market Segmentation Overview

By Switch Type

Sub-SegmentKey Trend
Non-Tactile Linear SwitchesContinued dominance in competitive gaming; budget alternatives from Chinese manufacturers expanding the addressable price range
Tactile SwitchesPreferred by office typists seeking feedback without an audible click; growing adoption in enterprise procurement.
Clicky SwitchesNiche enthusiast appeal; constrained by noise considerations in shared environments
Optical & Hall-Effect SwitchesFastest innovation cycle; adjustable actuation and unlimited lifespan drive premium positioning


Optical and hall-effect architectures represent the primary disruption vector in switch technology, with established brands and startups alike competing to deliver analog-input precision that traditional contact-based designs cannot match.

By Connectivity

Sub-SegmentKey Trend
WiredTournament standard; stable demand from esports and enterprise deployments
Wireless (2.4 GHz)Rapid uptake as polling rates match wired performance; dominant wireless protocol for gaming
Wireless (Bluetooth)Multi-device pairing drives adoption in productivity and mobile setups


Wireless connectivity continues to close the performance gap with wired solutions, and 2.4 GHz technology now satisfies the latency requirements of all but the highest-tier competitive play.

By Form Factor

Sub-SegmentKey Trend
Full-Size (100%)Revenue leader; essential for data-entry and accounting workflows requiring a numpad
Tenkeyless (80%)Balanced compromise between key count and desk footprint
65% CompactFastest-growing layout; arrow keys retained while eliminating the function row
60% and BelowUltra-portable builds favored by travel-oriented enthusiasts.


Compact layouts below 75% are reshaping the category as home offices shrink and workers prioritize desk real estate alongside ergonomic mouse placement.

By Keycap Material

Sub-SegmentKey Trend
ABSCost-effective default; prone to shine over time, but sufficient for budget and mid-range boards
PBT (Double-Shot)Premium durability and texture retention; increasingly standard on keyboards above USD 100
POM and OtherSpecialty materials for enthusiast customization; very small volume share


PBT double-shot keycaps are transitioning from a premium upgrade to an expected standard on mid-tier and above mechanical keyboards, driven by consumer awareness of long-term durability advantages.

By Application and End User

Sub-SegmentKey Trend
Gaming and EsportsLargest revenue contributor; professional sponsorships amplify brand preference
Office and IndustrialErgonomic mandates and hybrid-work budgets drive steady enterprise adoption.
Enthusiast / DIYFastest-growing segment; community-driven group buys sustain premium pricing power
Content CreationMacro-programmable layouts and streaming integrations fuel niche but loyal demand


The enthusiast and DIY channel continues to punch above its weight in revenue terms, with average selling prices three to four times higher than mass-market equivalents and brand loyalty that insulates premium manufacturers from price-based competition.


Download PDF ×

We do not share your information with anyone. However, we may send you emails based on your report interest from time to time. You may contact us at any time to opt-out.